

- What Earth’s Magnetic Field Has to Do With Climate History - October 7, 2025
- The Science Behind Heat Domes and Their Growing Impact - October 7, 2025
- What Ancient Lake Beds Teach Us About Past Rainfall Patterns - October 6, 2025
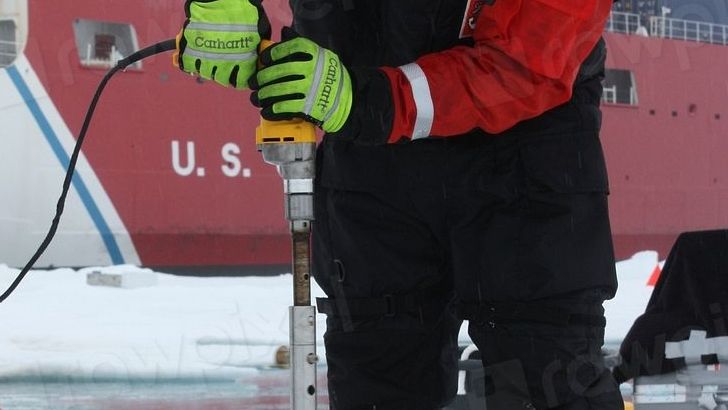
Ice Cores Reveal Climate History Spanning Hundreds of Thousands of Years
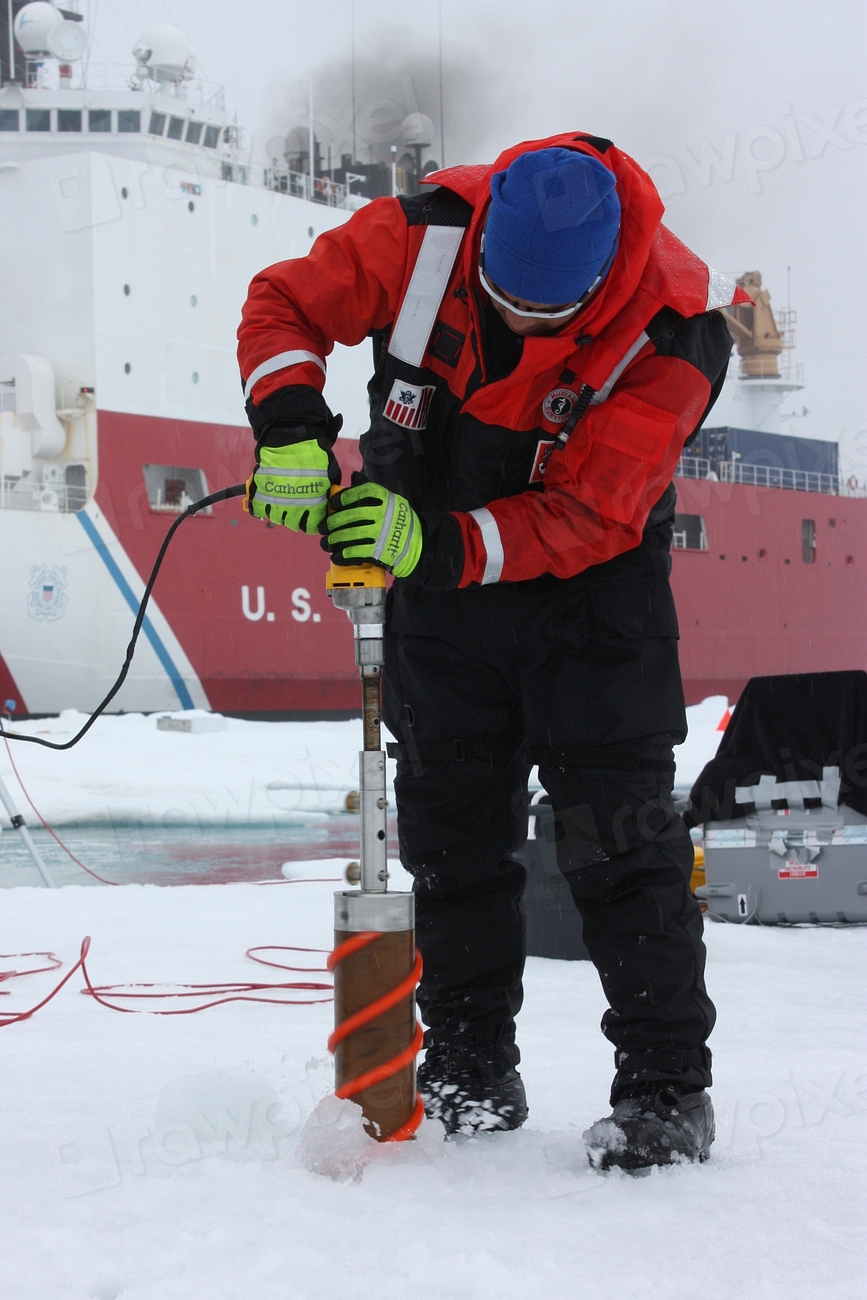
Most ice core records come from Antarctica and Greenland, and the longest ice cores extend to 3km in depth. The oldest continuous ice core records to date extend 123,000 years in Greenland and 800,000 years in Antarctica. These ancient ice archives contain trapped air bubbles that preserve actual samples of past atmospheres, allowing scientists to directly measure greenhouse gas concentrations from long ago.
Crucially, the ice encloses small bubbles of air that contain a sample of the atmosphere – from these it is possible to measure directly the past concentration of atmospheric gases, including the major greenhouse gases: carbon dioxide, methane and nitrous oxide. Atmospheric carbon dioxide levels are now 50% higher than before the industrial revolution. The magnitude and rate of the recent increase are almost certainly unprecedented over the last 800,000 years.
Rapid Climate Shifts Challenge Previous Assumptions
However, ice cores have provided us with evidence that abrupt changes are also possible. During the last glacial period, Greenland experienced a sequence of very fast warmings. The temperature increased by more than 10°C within a few decades. New research from multiple ice cores collected across Greenland with data spanning up to 120,000 years provides new understanding of abrupt Dansgaard-Oeschger events, how they unfold and what that might mean for the future.
Just published research from multiple ice cores collected across Greenland with data spanning up to 120,000 years provides new understanding of these abrupt events, how they unfold and what that might mean for the future. The events, known as Dansgaard-Oeschger events, represent “tipping points” in Earth’s climate – situations in which the climate crosses a threshold that leads to sudden and large-scale change. These findings suggest that the climate system can shift dramatically in mere decades, overturning earlier beliefs about gradual change.
Ocean Circulation Changes Drive Global Climate Patterns
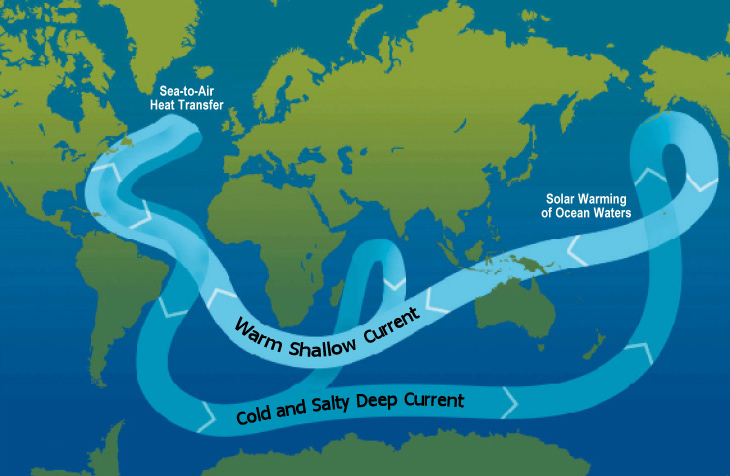
Recent model experiments suggest that a future AMOC weakening will again decrease precipitation over northernmost South America and increase rainfall over northeastern Brazil. During AMOC slowdowns, northernmost South America experienced a decrease in precipitation, while marked increases in precipitation were recorded over tropical South America to the south of the equator. These oceanic changes demonstrate how shifts in one region can reshape weather patterns across entire continents.
These changes were synchronous and proportional to the warming (cooling) of the surface South (North) Atlantic due to the decreases in AMOC strength. The research highlights how ocean circulation acts as a massive heat distribution system, and when this system changes, the effects ripple across the globe. Antarctica and the Southern Ocean experienced a different pattern, consistent with the idea that these rapid jumps were caused by sudden changes in the transport of heat in the ocean. Most likely, freshwater delivered from the ice sheet to the North Atlantic periodically disrupted the overturning of the ocean, causing the transport of tropical heat to the north to reduce and then suddenly increase again.
Proxy Data Extends Climate Records Beyond Direct Measurements
Paleoclimatologists gather proxy data from natural recorders of climate variability such as corals, pollen, ice cores, tree rings, caves, pack rat middens, ocean and lake sediments, and historical data. By analyzing records taken from these and other proxy sources, scientists can extend our understanding of climate far beyond the instrumental record. These natural archives serve as Earth’s own climate library, storing detailed information about past conditions.
Paleoclimate proxies are physical, chemical and biological materials preserved within the geologic record (in paleoclimate archives) that can be analyzed and correlated with climate or environmental parameters in the modern world. In the study of past climates (“paleoclimatology”), climate proxies are preserved physical characteristics of the past that stand in for direct meteorological measurements and enable scientists to reconstruct the climatic conditions over a longer fraction of the Earth’s history. Reliable global records of climate only began in the 1880s, and proxies provide the only means for scientists to determine climatic patterns before record-keeping began.
Tree Rings and Coral Reefs Chronicle Centuries of Change

Dendroclimatology is the science of determining past climates from trees, primarily from properties of the annual tree rings. Tree rings are wider when conditions favor growth, narrower when times are difficult. Because climate conditions influence tree growth, patterns in tree-ring widths, density, and isotopic composition reflect variations in climate. In temperate regions where there is a distinct growing season, trees generally produce one ring a year, recording the climate conditions each year.
Another type of proxy data, corals build their hard skeletons from calcium carbonate – a mineral extracted from seawater. The carbonate also contains isotopes of oxygen as well as trace metals that can be used to determine the temperature of the water in which the coral grew. Cooler temperatures tend to cause coral to use heavier isotopes in its structure, while warmer temperatures result in more normal oxygen isotopes being built into the coral structure.
Advanced Data Assimilation Methods Transform Climate Reconstruction
In recent years, paleoclimate data assimilation (paleoDA), which statistically combines model simulations with proxy data, has become an increasingly popular reconstruction method. Reconstructions of past climates in both time and space provide important insight into the range and rate of change within the climate system. However, producing a coherent global picture of past climates is difficult because indicators of past environmental changes (proxy data) are unevenly distributed and uncertain.
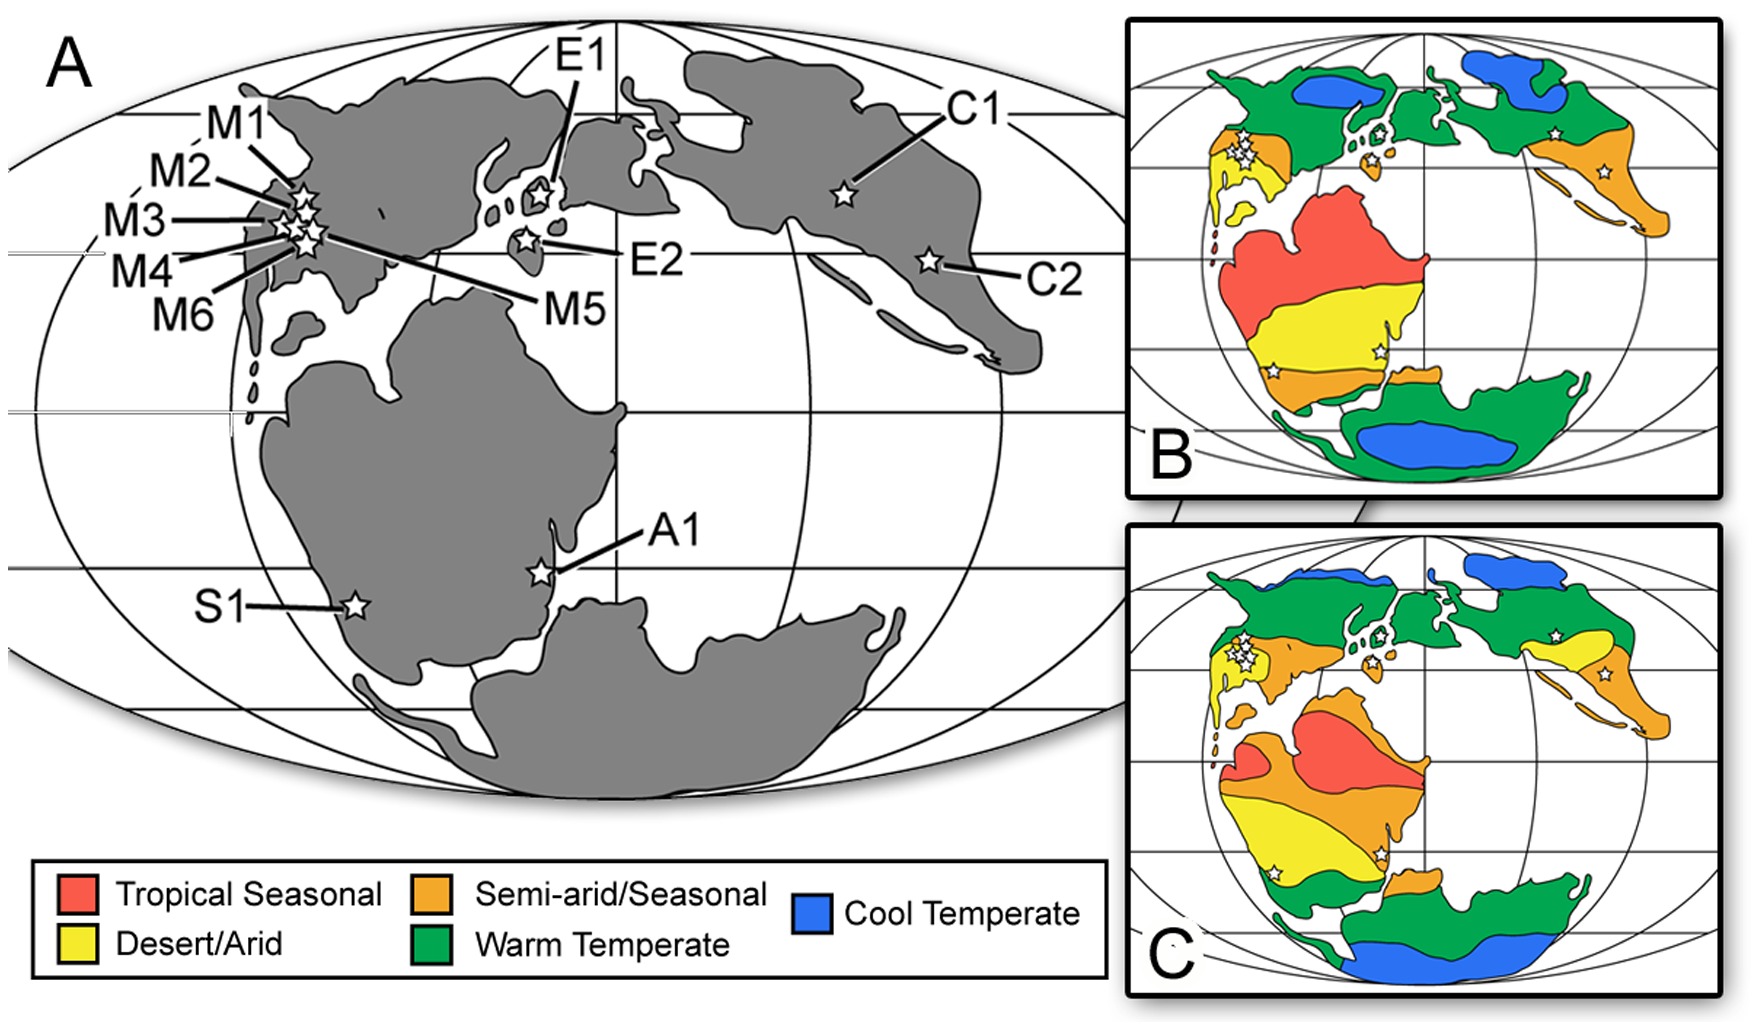
We assimilate proxy estimates of SST with model simulation output from the PlioMIP2 and “Pliocene-like” simulations with altered cloud distributions to produce reconstructions for two time windows: the mid-Pliocene (3.5–3.0 Ma) and the early Pliocene (5.0–4.5 Ma). The mid-Pliocene reconstruction serves as a point of comparison for the numerous proxy and modeling-based syntheses targeting this particular time period, whereas the early Pliocene reconstruction addresses past observations suggesting it is even warmer than the mid-Pliocene, with very different zonal and meridional SST gradients.
Climate Sensitivity Validation Through Ancient Evidence
Zhu et al. utilized paleo-data to evaluate the high ECS of the Community Earth System Model version 2 (CESM2), which was 5.2°C – significantly higher than previous models. This model significantly overestimated global cooling during the Last Glacial Maximum (LGM) and warming during the early Eocene, indicating its high ECS was inconsistent with paleoclimate data. This demonstrates how ancient climate data serves as a crucial reality check for modern climate models.
These studies attributed the excessive climate sensitivity of CESM2 to issues in the parameterization of clouds. The revised model shows markedly improved performance in simulating both the LGM and early Eocene climates, and it now exhibits a much-reduced ECS (around 4°C), while still performing reliably for the present-day climate. The paleoclimate validation process helps scientists create more accurate predictions for future climate scenarios.
Carbon Dioxide Records Reveal Unprecedented Modern Levels

They report a reading of 172 parts per million (ppm) CO2 as the lowest CO2 concentration ever recorded in an ice core–about 10 ppm lower than the previous lowest reading. They report a reading of 172 parts per million (ppm) CO2 as the lowest CO2 concentration ever recorded in an ice core–about 10 ppm lower than the previous lowest reading. In 2008, Dieter Lüthi and other scientists pubished a paper in Nature that extended the ice core record of atmospheric CO2 concentrations from 650,000 years before present to 800,000 years before present. Scientists found that atmospheric concentrations correlated strongly with Antarctic temperature throughout the eight glacial cycles in the 800,000 year ice core record.
The study of past CO2 levels and climates helps us undersand the conditions in which human societies developed. This ‘paleoclimate’ information offers important lessons for understanding sustainability and the range of climatic conditions that human societies are known to be suited for. Ice cores also show that current carbon dioxide concentrations are now higher than they have been for hundreds of thousands of years, and the higher concentrations are driven by human burning of fossil fuels.
Monsoon Systems and Long-Term Climate Variability

Multicentennial to millennium variability in monsoon events emerge from a combination of time scales. Over the Holocene, the interannual to decadal teleconnections between the African and Indian monsoon rains are affected by the long-term changes in the mean state, so that variability increased over India and decreased in Africa. This research reveals how monsoon patterns have shifted dramatically over thousands of years.
The Indian signal is associated with changes in time of the teleconnection between ENSO and the Indian dipole variabilities. For Africa, the trends have been associated with changes in AMO-Mediterranean variability, and, depending on models, to teleconnections with ENSO. These findings help scientists understand how climate systems interact across vast distances and time scales, creating patterns that affect billions of people.
Sea Level and Temperature Patterns in the Pacific

By adopting paleoclimate proxy records along with a series of climate model simulations, here we show that the zonal gradient is likely to decrease under sustained strong forcing. Paleoclimate proxy records indicate an overall increase of the zonal gradient over time, which has been accompanied by global-mean cooling associated with decreasing carbon dioxide concentrations. This research shows how the Pacific Ocean’s temperature patterns have changed over geological time scales.
Proxy–model comparisons from the mid-Holocene and ensemble projections of future warming reveal that Northern-Hemisphere warming repeatedly forces the Pacific Decadal Oscillation into a persistent negative phase. This forced North Pacific response stifles winter storms, pointing to a persistent warming-driven drought risk in the Southwest US.
Modern Warming in Historical Context
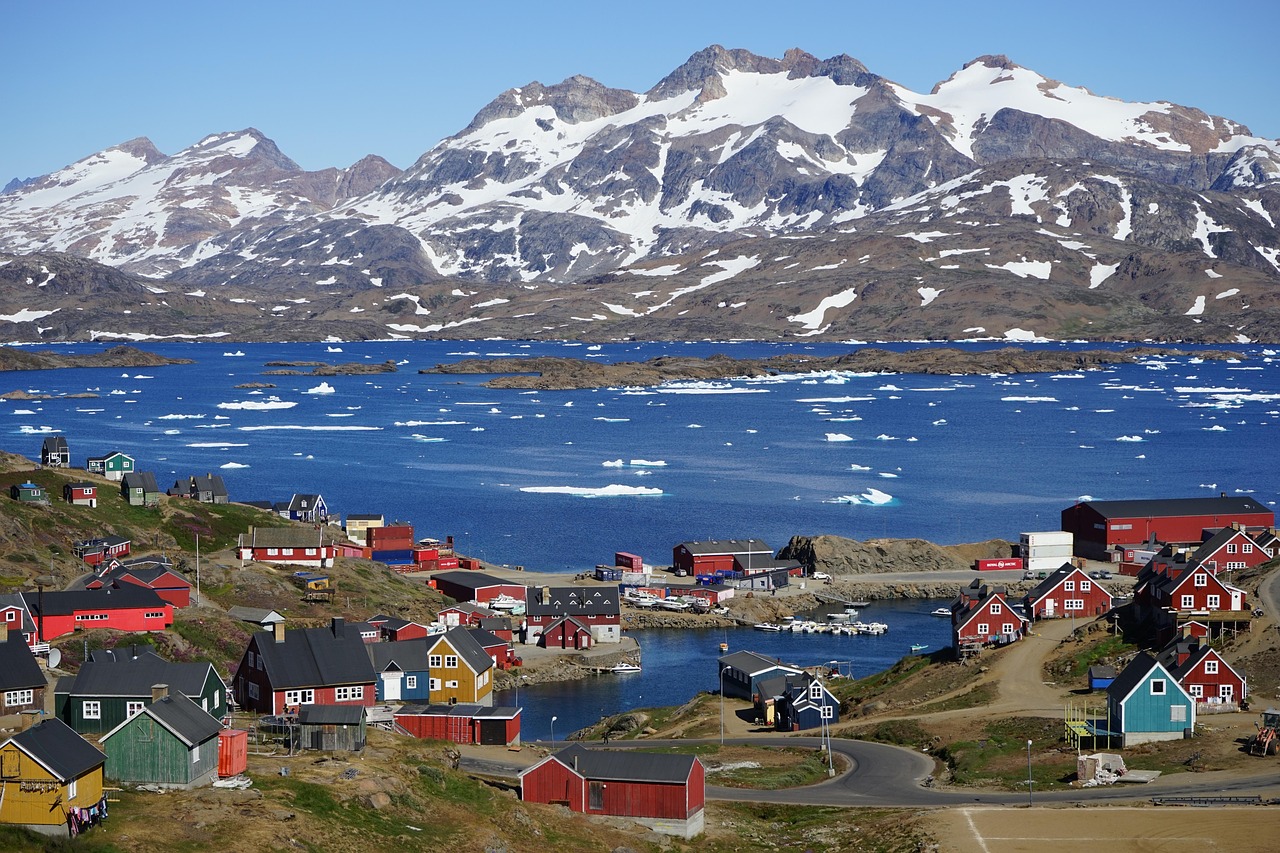
This modern temperature reconstruction, combined with observational records over the past century, shows that current temperatures in Greenland are the warmest in more than 1,000 years, and potentially the warmest in the past 2,000 years. Climate models project that if emissions continue, by 2050, Greenland temperatures will exceed anything seen since the last interglacial period, around 125,000 years ago. These findings place current climate change in stark perspective against thousands of years of natural variation.
Paleoclimate records show how human activity has boosted global temperatures in a very short span of geologic time. Piecing together all the evidence produces a picture of a planet that was often much hotter than today, but was cooler than the present climate for most of the last 11,000 years. The data reveals that while Earth has experienced dramatic climate changes before, the current rate and magnitude of change is unprecedented in the context of human civilization.
Future Climate Insights from Ancient Patterns
Paleoclimate information provides a baseline for understanding natural climate variability and how human activities have altered the climate. Paleoclimate reconstructions also allow us to estimate the potential impacts of climate change on multiple aspects of the climate system. Furthermore, paleoclimatology provides data that we can use to model and predict both current and future climate change scenarios. However, paleoclimate data are used as a foundation for climate scientists by providing crucial information such as rates of past climate change and how vegetation and animal populations responded to the change.
Proxy data can also help determine changes to sea level, ice cover and vegetation during past warm periods. One example is the previous interglacial period around 125,000 years ago – called the Eemian that was likely as warm or warmer than today – which can provide evidence on how all of these factors may change as the world warms. By studying how Earth’s climate system responded to natural changes in the past, scientists can better understand what might happen as human activities continue to alter our planet’s climate.