


- Why Scientists Track Atmospheric Carbon With Giant Towers - October 7, 2025
- The Link Between Melting Ice and Rising Sea Levels Explained - October 6, 2025
- How Ocean Currents Help Regulate Global Climate - October 5, 2025
The Invisible Highways of Climate

Picture this: a butterfly flaps its wings in Brazil and somewhere across the globe, your weekend picnic gets rained out. While that classic chaos theory example might be a bit dramatic, there’s actually some serious science behind how distant climate patterns control what’s happening right outside your window. Teleconnections are significant relationships or links between weather phenomena at widely separated locations on earth, which typically entail climate patterns that span thousands of miles. These invisible pathways act like atmospheric highways, carrying weather information across continents and oceans. Guided along by the jet stream, these Rossby waves serve as the foundation for teleconnection patterns, which provide a pathway for information (like temperature and pressure) to be transferred to and affect weather patterns in places thousands of miles away. Rossby waves are the vehicles that travel along our global information superhighway that keep our climate system fully connected and in constant communication.
When Pacific Ocean Moods Rule Your Weather

The Pacific Ocean doesn’t just sit there looking pretty – it actually controls weather patterns across the entire planet. El Niño is a major teleconnection pattern created by El Niño-Southern Oscillation (ENSO) changes to the atmosphere and ocean. Changes in the temperature of the ocean surface in the tropical Pacific Ocean also affect the weather. El Niño conditions cause changes in the amount of precipitation worldwide. When ocean temperatures in the tropical Pacific get warmer than usual during an El Niño event, the effects ripple outward like stones thrown into a pond. The emergence of the El Niño weather phenomenon in the middle of 2023 had a significant influence on temperatures during both 2023 and 2024, and is likely the largest short-term contributor to the 2023/2024 temperature spike. This El Niño peaked just before the end of 2023 and ended in April-May 2024.
These Pacific mood swings don’t just affect temperatures – they reshape entire regional weather patterns. Southern Alaska, for example, can become warmer than usual. And the U.S. Gulf Coast can be cooler and more rainy than usual. El Niño even has an impact as far away as West Antarctica.
The Atlantic’s Hidden Weather Control Room

While the Pacific gets most of the attention, the Atlantic Ocean has its own powerful climate influencer called the North Atlantic Oscillation (NAO). Think of it as nature’s pressure cooker system that can dramatically alter winter weather across multiple continents. The North Atlantic Oscillation causes unusual weather in the Northern Hemisphere. The cause is the North Atlantic Oscillation (NAO) – changes in the intensity of a low pressure system over Iceland and a high pressure system in the subtropical Atlantic.
During the winter of 1995-96 the changes in pressure caused cold and snowy weather in eastern North America, bitter cold in Northern Europe, and wet weather in southern Europe and northern Africa. These far-reaching effects happen because atmospheric pressure patterns create ripple effects that travel through the jet stream. It’s like a domino effect, where one falling piece sets off a chain reaction thousands of miles away.
Record-Breaking Heat Shows Climate Pattern Disruption
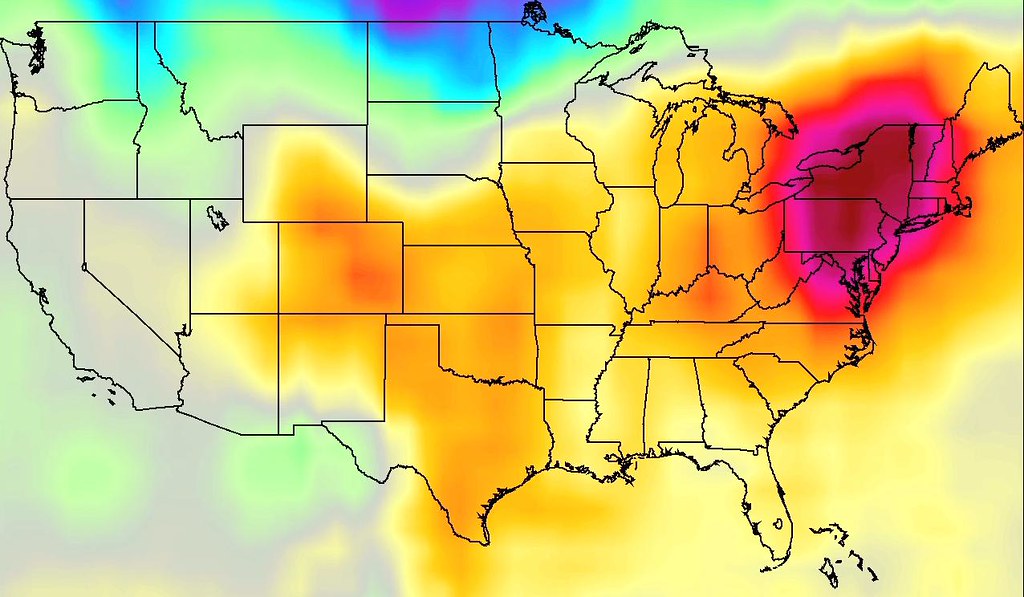
2024 had a global average temperature of 15.10°C; 0.12°C higher than the previous highest annual value in 2023. 2024 was 0.72°C warmer than the 1991–2020 average, and 1.60°C warmer than the pre-industrial level, making it the first calendar year to exceed 1.5°C above that level. These aren’t just abstract numbers – they represent massive disruptions to the climate patterns that normally regulate local weather. When global temperature patterns shift this dramatically, it’s like changing the foundation of a house while people are still living in it.
We estimate that 3.3 billion people – 40% of Earth’s population – experienced a locally record warm annual average in 2024. This includes 2/3 of the population of China, and a majority of the populations of Brazil, Nigeria, Ethiopia, Mexico, 1/3 of the United States, and much of South and Central America, and Eastern Europe. These record-breaking temperatures aren’t just random hot spells – they represent fundamental changes to how global climate patterns interact with local weather systems.
How Atmospheric Waves Create Weather Chaos

The atmosphere operates like a massive ocean of air, complete with waves that can stretch across entire continents. Foundational to teleconnection patterns are large-scale atmospheric waves, specifically Rossby waves, named after the world-renowned meteorologist Carl-Gustaf Rossby. Rossby waves can persist from days to months and can vary from a few hundred miles long to spanning the entire planet! These invisible waves carry energy and momentum from one region to another, creating high and low pressure systems that directly control your local weather.
When you see a wave traveling along the surface of water, there are peaks and troughs in the water height. The same happens in the atmosphere with a traveling Rossby wave – as the Rossby wave travels through the atmosphere, the peaks and troughs of the wave produce regions of high and low air pressure. These pressure changes are what create storms, clear skies, heat waves, and cold snaps in your neighborhood.
Extreme Weather Events Get Connected Globally
Modern research reveals something mind-blowing: extreme weather events aren’t isolated incidents but part of a globally connected network. We show that extreme-rainfall events in the monsoon systems of south-central Asia, east Asia and Africa are significantly synchronized. Moreover, we uncover concise links between south-central Asia and the European and North American extratropics, as well as the Southern Hemisphere extratropics.
Complex global climate interactions, known as teleconnections, can lead to widespread repercussions triggered by localized extreme weather. Understanding these teleconnection patterns is crucial for weather forecasting, enhancing safety, and advancing climate science. Scientists have discovered that when extreme rainfall hits one part of Asia, it can influence storm patterns thousands of miles away in North America or Europe, creating a domino effect of weather disruptions.
The Devastating Real-World Impact
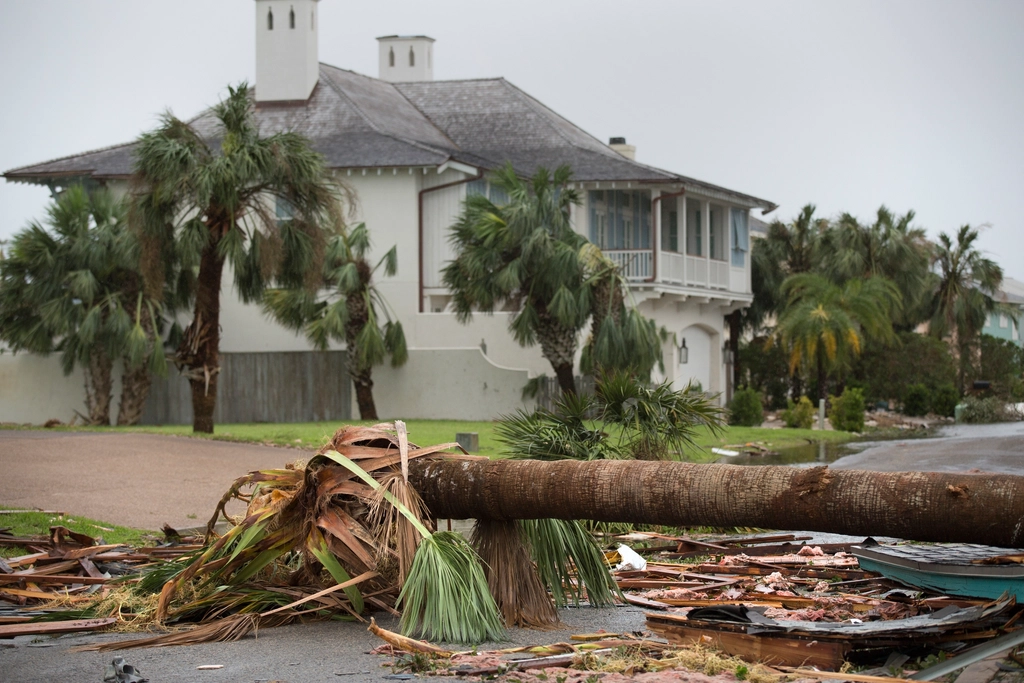
The 2024 hurricane season showed exactly how global climate patterns translate into local devastation. Tropical cyclones caused the most damage from 1980 to 2024 ($1,543.2 billion) and had the highest average event cost ($23.0 billion per event). Severe storms ($514.3 billion), drought ($367.5 billion), and inland flooding ($203.0 billion) also caused considerable damage. These aren’t just statistics – they represent homes destroyed, lives lost, and communities shattered by the interaction between global climate patterns and local weather systems.
Hurricane Helene rapidly intensified from 45 to 80 mph (72.4 to 128.7 km/h), and it was blowing at 140 mph (225.3 kph) less than 36 hours later when it made landfall on September 26 as a Category 4 in the Florida Gulf Coast. In states such as North Carolina, the hurricane battered communities with high percentages of people living with disabilities, people of advanced age, or living in mobile homes, all markers of populations that face significant challenges to recover from such disasters. This rapid intensification is becoming more common as global climate patterns intensify storm development.
Sea Ice Loss Triggers Global Weather Shifts

What happens in the Arctic doesn’t stay in the Arctic. Open water is often warmer than the air above, particularly during winter months, so the reduced sea ice cover contributed to unusually high surface air temperatures around Antarctica. These elevated regional temperatures were a factor, albeit not a primary one, in the record or near-record global temperatures of 2024. When ice melts and exposes dark ocean water, it absorbs more heat, creating temperature changes that influence atmospheric pressure patterns worldwide.
In contrast to the pronounced decline in Arctic sea ice since the 1980s, persistent large negative anomalies in Antarctic sea ice extent have only been observed since 2016. Warmer ocean temperatures and atmospheric circulation patterns are likely contributing factors, but research is ongoing. These changes at the poles alter the fundamental temperature gradients that drive weather patterns across the planet, affecting everything from storm tracks to seasonal temperature patterns in your hometown.
Climate Networks Reveal Hidden Connections
Scientists are now using advanced network analysis to map these invisible climate connections, revealing shocking patterns of global weather interdependence. We find that the distance distribution of significant connections (P < 0.005) around the globe decays according to a power law up to distances of about 2,500 kilometres. Complex networks are used to analyse global-scale teleconnections between extreme-rainfall events, revealing a peak in the distance distribution of statistically significant connections at around 10,000 kilometres.
Our study results demonstrate that the distances of significant teleconnections initially conform to a power-law decay, signifying a decline in connectivity with distance. However, this power-law decay tendency breaks beyond a certain threshold distance, suggesting the existence of long-distance connections. Additionally, we uncover a greater prevalence of long-distance connectivity among extreme cooling events compared to extreme warming events. This research proves that weather events separated by thousands of miles are more connected than we ever imagined.
Rising Seas Amplify Local Flooding
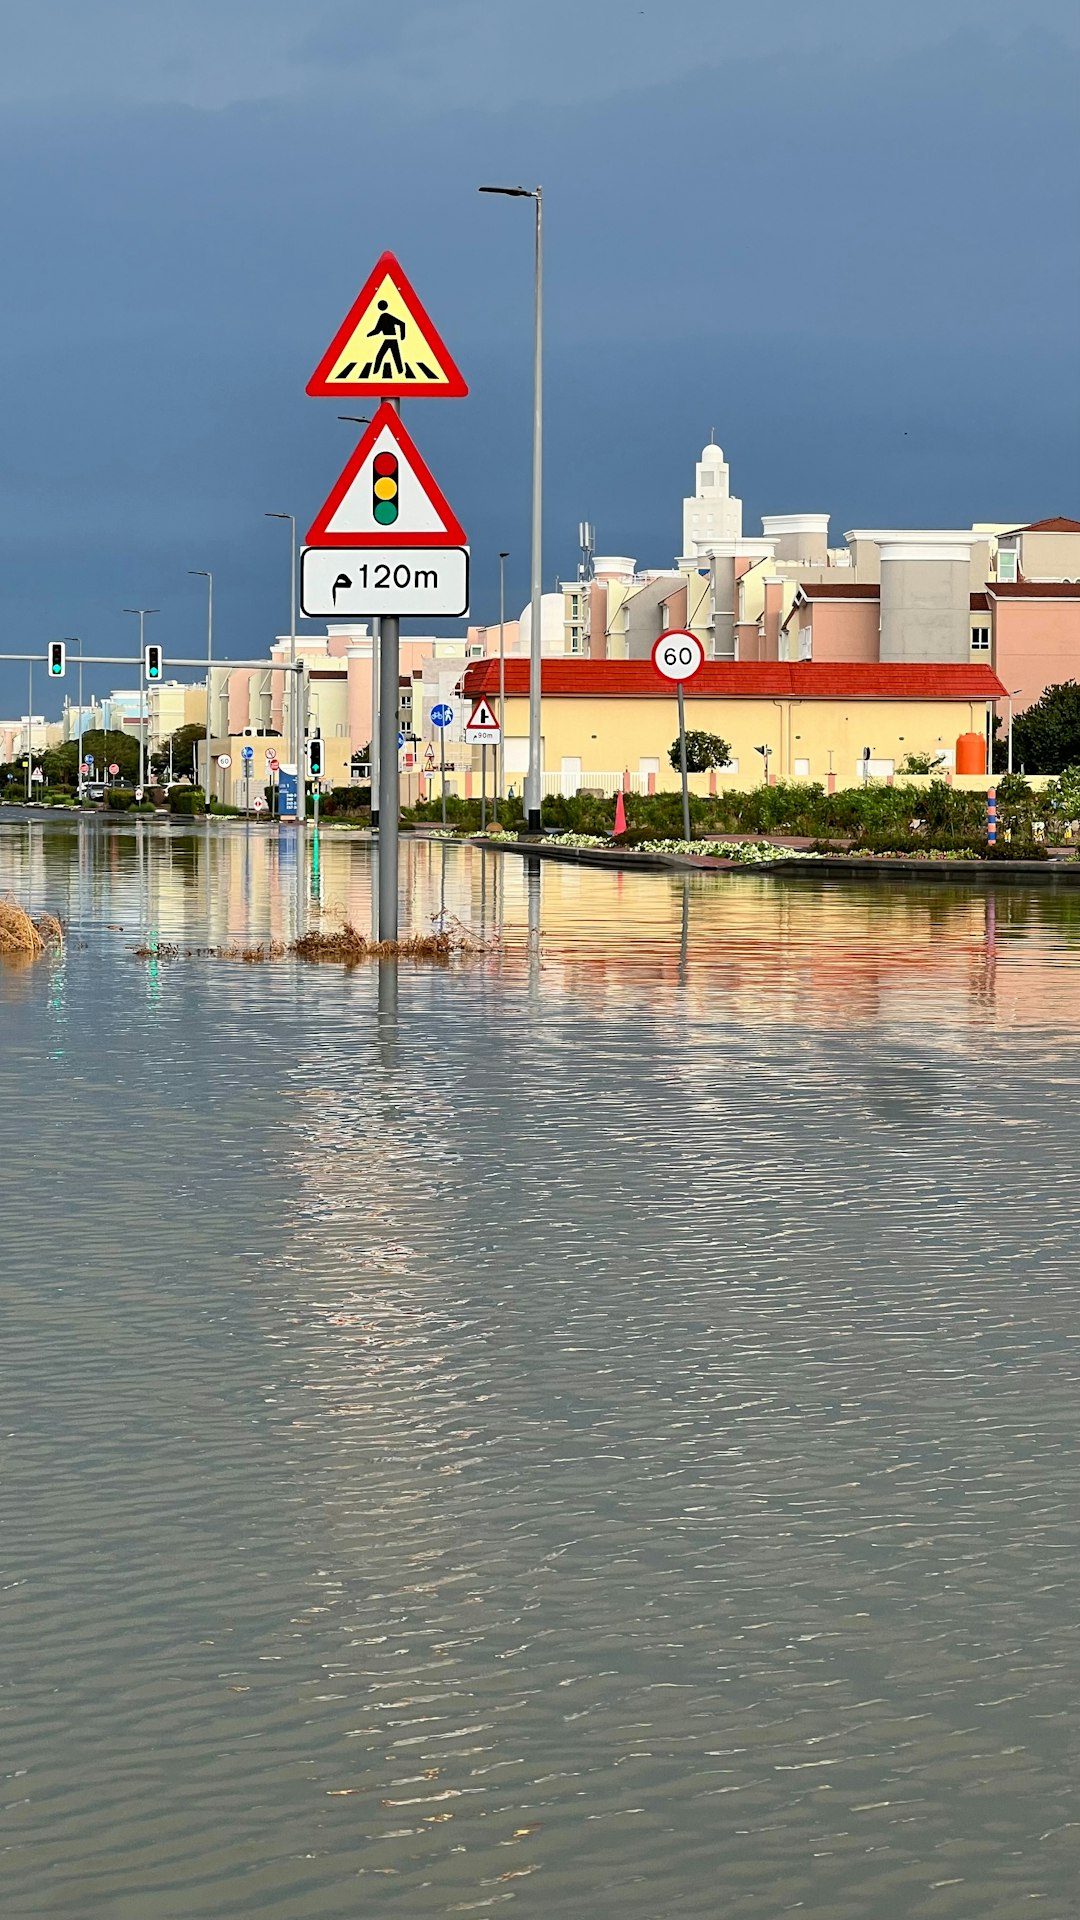
Global sea level rise might seem like a distant problem, but it’s making local flooding events much worse through its interaction with storm systems. A study of Hurricane Katrina estimated that higher sea levels led to flood elevations 15-60 percent higher than climate conditions in 1900. A study of Hurricane Sandy estimated that sea levels at the time increased the likely of flooding by three times and that additional rising will make severe flooding four times more likely in the future.
This isn’t just about coastal areas – sea level rise affects inland flooding too. Hurricanes today travel more slowly than they previously did. Though the mechanism that is causing this slowdown is still debated, it is clear that storms are “stalling” and subjecting coastal regions to higher total rainfall and longer periods of high winds and storm surge. This has increased the destruction caused by recent storms in the United States.
Future Weather Patterns Look Increasingly Extreme
The global climate patterns controlling local weather are shifting into dangerous new territory. The WMO report forecasts that the annually averaged global mean near-surface temperature for each year between 2025 and 2029 is predicted to be between 1.2°C and 1.9°C higher than the average over the years 1850-1900. There is an 80% chance that at least one year between 2025 and 2029 will be warmer than the warmest year on record (currently 2024). And there is an 86% chance that at least one year will be more than 1.5°C above the pre-industrial level.
As global warming intensifies, the frequency and impact of these events are likely to increase, making it imperative to incorporate such network-based insights into future climate forecasting and risk management strategies. By bridging the gap between short-term variability and long-term climate change, our study provides a more nuanced understanding of the interconnected nature of extreme weather phenomena and highlights the urgent need to monitor and mitigate potential cascading effects in a warming world.