


- What Earth’s Magnetic Field Has to Do With Climate History - October 7, 2025
- The Science Behind Heat Domes and Their Growing Impact - October 7, 2025
- What Ancient Lake Beds Teach Us About Past Rainfall Patterns - October 6, 2025
Billion-Dollar Disasters Continue Across the U.S.
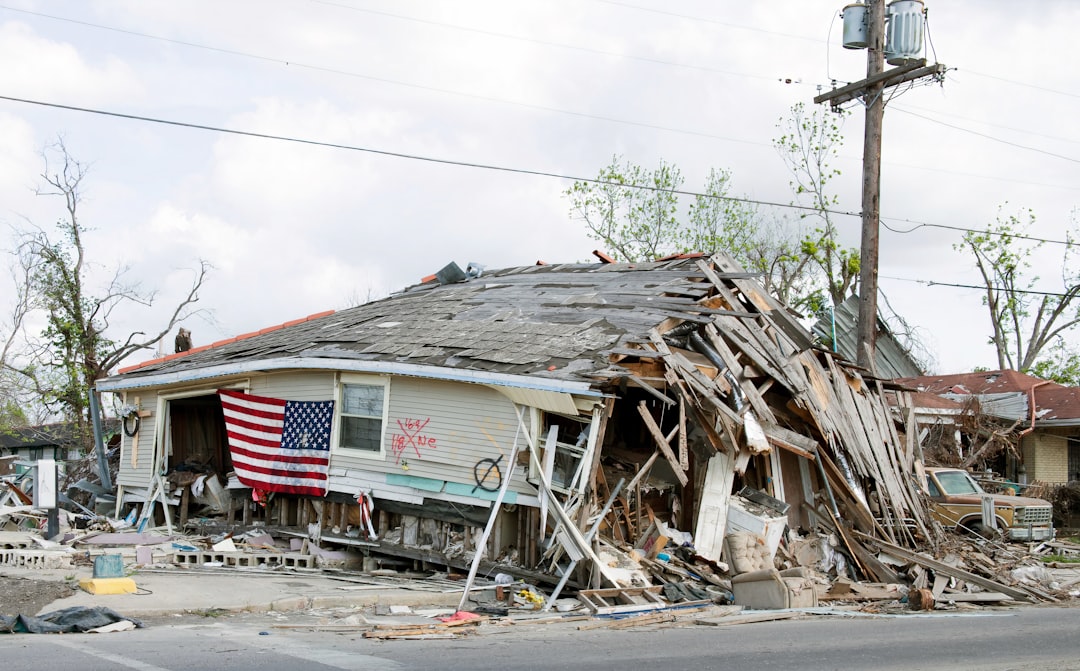
In the first half of 2025, the U.S. experienced 15 billion-dollar weather disasters, matching the 10-year average for January to June. While not a record, these costly events underscore the ongoing financial toll of extreme weather.
Filling the Gap Left by NOAA

Insurance broker Gallagher Re now fills the gap in disaster tracking after NOAA’s program was eliminated this year. Their quarterly reports provide essential data on high-cost disasters previously monitored by federal agencies.
Global Perspective on 2025 Disasters

Globally, just four billion-dollar weather disasters occurred outside the U.S. during the first half of the year. Altogether, 19 such events worldwide resulted in $134 billion in damages—a significant share, with 60% of the total classified as insured losses.
U.S. Leads in Insured Damages
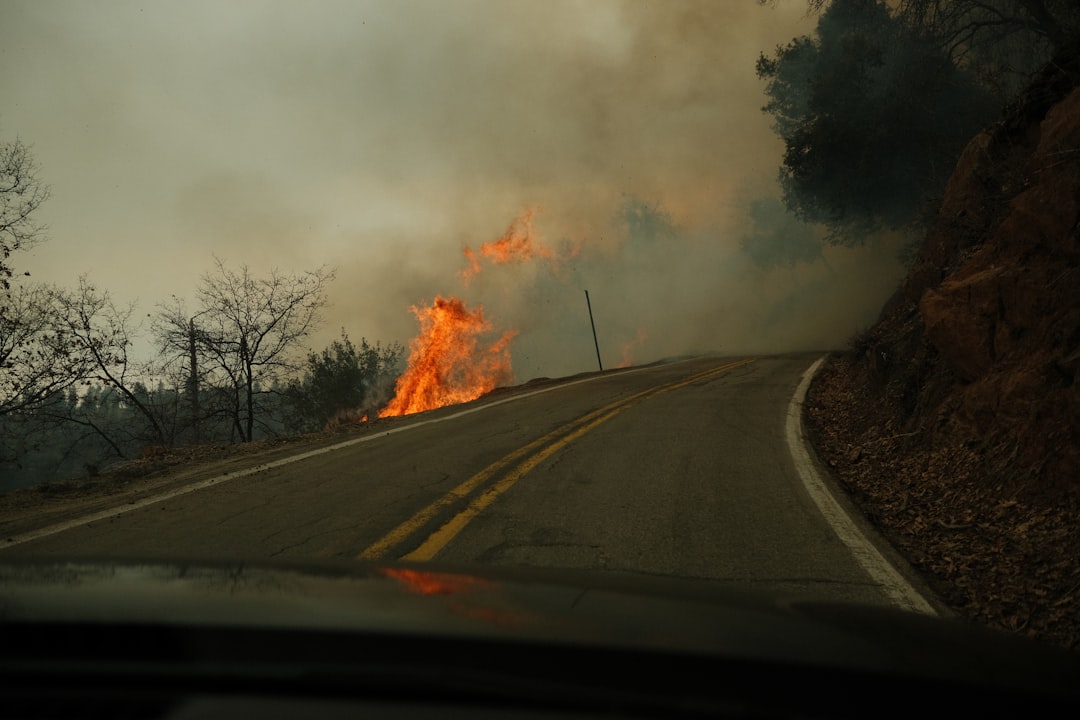
The U.S. accounted for a remarkable 92% of insured damages globally, largely due to the devastating Los Angeles wildfires in January. Insured, inflation-adjusted weather-related losses worldwide reached a record $81 billion for the first half of 2025, breaking last year’s record of $75 billion.
Seasonal Trends in Insured Losses

Historically, insured losses break down by quarter as follows: 15% in Q1, 25% in Q2, 44% in Q3, and 16% in Q4. The third quarter tends to see the highest losses, coinciding with the peak hurricane and typhoon season in the Northern Hemisphere.
Increasing Financial Risks and Insurance Gaps

As extreme weather becomes more frequent and severe, the financial burden on insurance providers and communities continues to grow. Rising insured losses highlight the increasing costs of climate-related disasters, often straining both private and public resources.
The Need for Comprehensive Tracking
With the loss of NOAA’s official disaster tracking, independent analyses like those from Gallagher Re are now crucial for understanding national and global risk. Robust data on weather disasters is essential for informed policy, disaster preparedness, and community resilience in a rapidly changing climate.