

- 10 Things You Didn’t Know About Ancient Climate Records Hidden in Geological Layers - March 9, 2026
- Why Scientists Track Atmospheric Carbon With Giant Towers - October 7, 2025
- The Link Between Melting Ice and Rising Sea Levels Explained - October 6, 2025
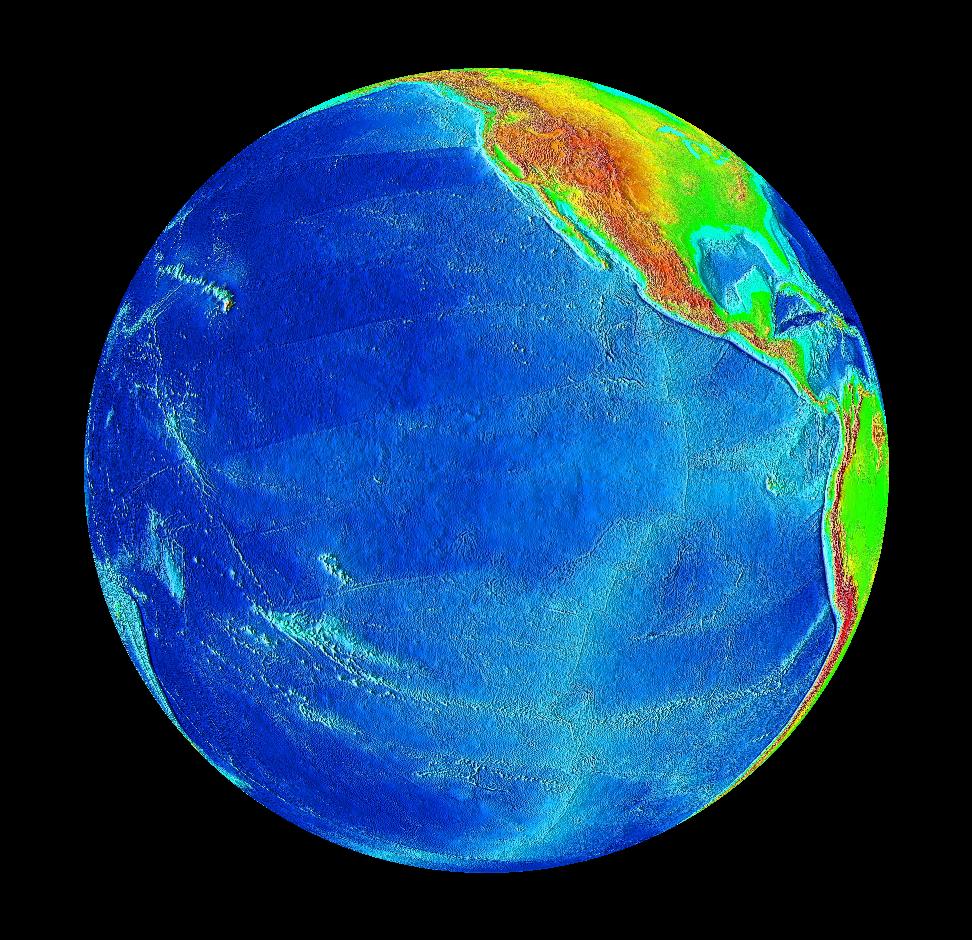
The Pacific Ocean’s Climate Control System
Think of the Pacific Ocean as a massive thermostat that controls weather patterns around the globe. El Niño and La Niña are complex weather patterns resulting from variations in ocean temperatures in the Equatorial Pacific, representing the warm and cool phases of a natural climate pattern across the tropical Pacific known as the El Niño-Southern Oscillation, or “ENSO” for short. The pattern shifts back and forth irregularly every two to seven years, bringing predictable changes in ocean temperature and disrupting the normal wind and rainfall patterns across the tropics.
El Niño means Little Boy in Spanish, named by South American fishermen who first noticed periods of unusually warm water in the Pacific Ocean in the 1600s. The full name they used was El Niño de Navidad, because El Niño typically peaks around December. After just a few months of La Niña conditions, the tropical Pacific is now ENSO-neutral, and forecasters expect neutral to continue through the Northern Hemisphere summer.
El Niño: When the Ocean Heats Up
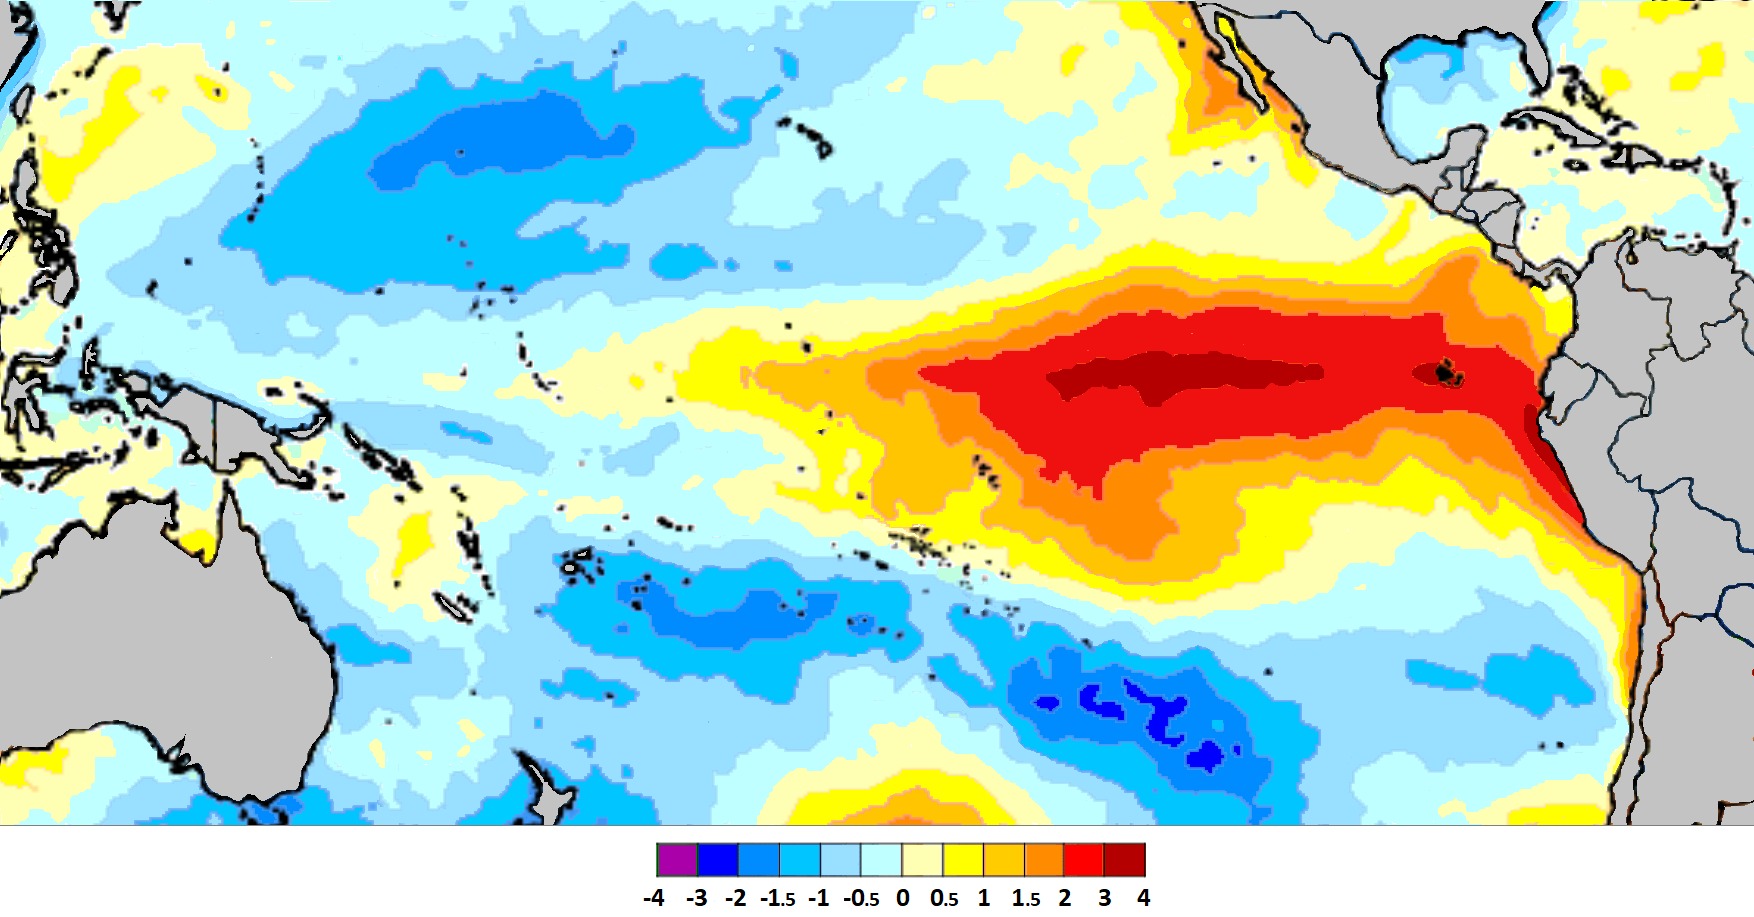
El Niño is a climate pattern that describes the unusual warming of surface waters in the eastern tropical Pacific Ocean. El Niño is the “warm phase” of a larger phenomenon called the El Niño-Southern Oscillation (ENSO). Scientists use the Oceanic Niño Index (ONI) to measure deviations from normal sea-surface temperatures. El Niño events are indicated by sea surface temperature increases of more than 0.9 degrees Fahrenheit for at least five successive three-month seasons.
During an El Niño event, westward-blowing trade winds weaken along the Equator. These changes in air pressure and wind speed cause warm surface water to move eastward along the Equator, from the western Pacific to the coast of northern South America. These warm surface waters deepen the thermocline, the level of ocean depth that separates warm surface water from the colder water below.
El Niño events occur irregularly at two- to seven-year intervals. Episodes of El Niño and La Niña typically last nine to 12 months, but can sometimes last for years. El Niño and La Niña events occur every two to seven years, on average, but they don’t occur on a regular schedule.
La Niña: The Ocean’s Cool Down Period

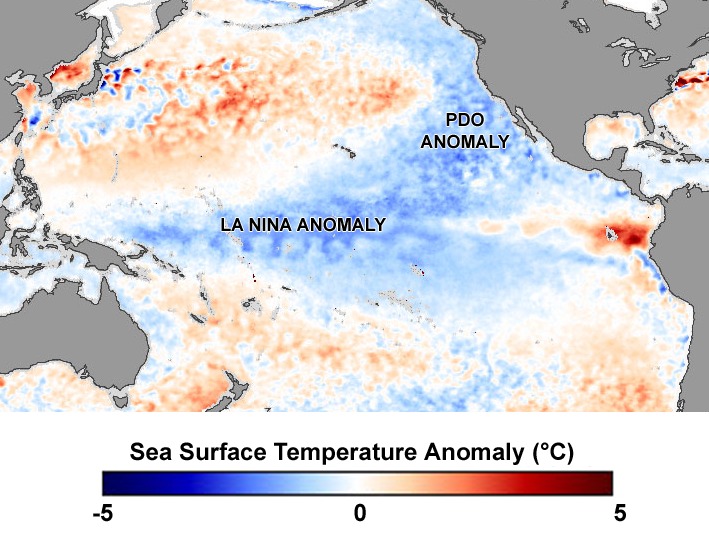
La Niña is the cold phase of the El Niño-Southern Oscillation. La Niña is defined by cooler-than-average sea surface temperatures in the central-eastern equatorial Pacific Ocean and related atmospheric changes. La Niña triggers changes in global atmospheric and oceanic circulation that are responsible for anomalous precipitation patterns that can last from months to multiple seasons.
During La Niña, the surface winds across the entire tropical Pacific are stronger than usual, and most of the tropical Pacific Ocean is cooler than average. Rainfall increases over Indonesia (where waters remain warm) and decreases over the central tropical Pacific (which is cool). Both El Niño and La Niña can last more than a year, but it is rare for El Niño events to last longer than a year or so, while it is common for La Niña to last for two years or more. The longest El Niño in the modern record lasted 18 months, while the longest La Niña lasted 33 months.
How Normal Pacific Conditions Work
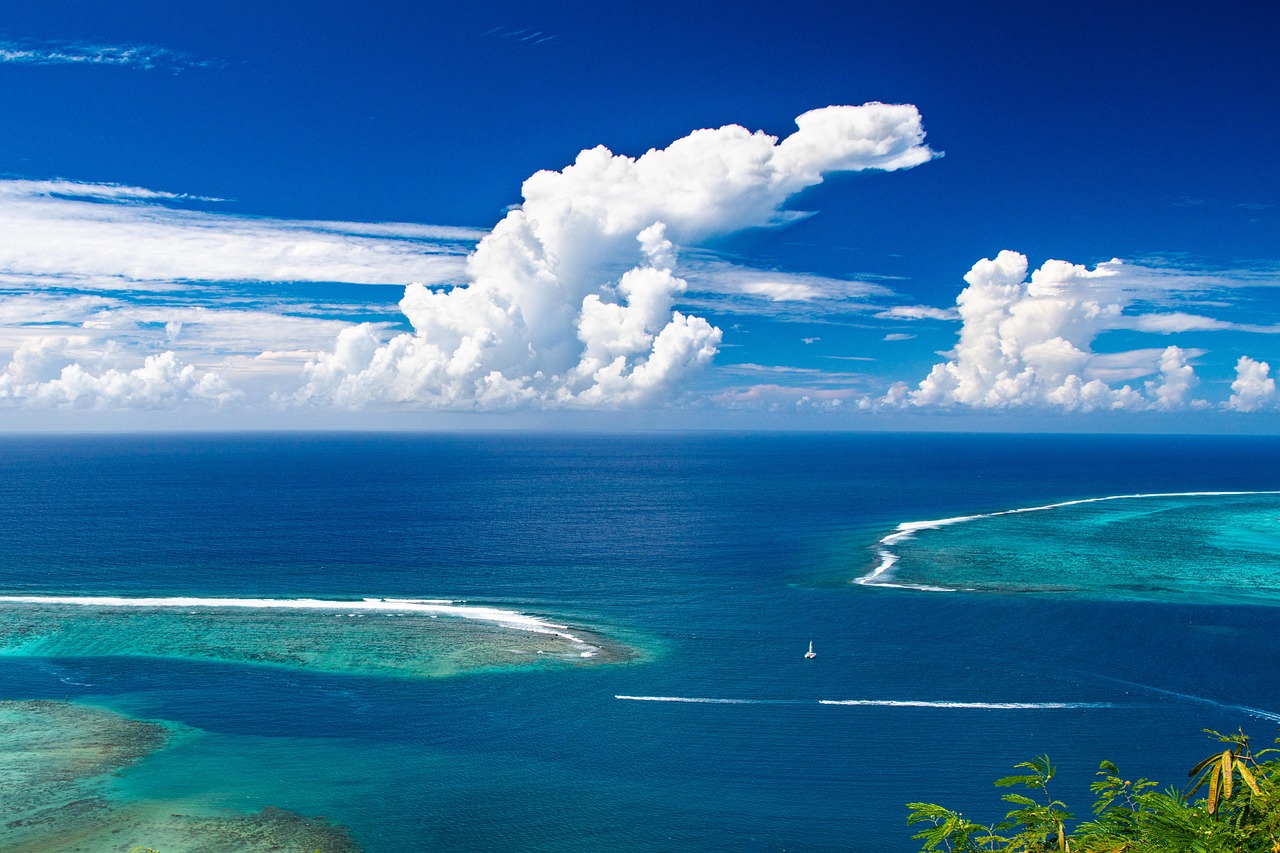
During normal conditions in the Pacific ocean, trade winds blow west along the equator, taking warm water from South America towards Asia. To replace that warm water, cold water rises from the depths – a process called upwelling. These winds pile up warm surface water off Asia, so that the sea surface is about half a meter higher at Indonesia than at Ecuador in South America. The sea surface temperature is about 8°C warmer off the coast of Asia than in the eastern Pacific, due to an upwelling of cold water from deeper levels in the east Pacific.
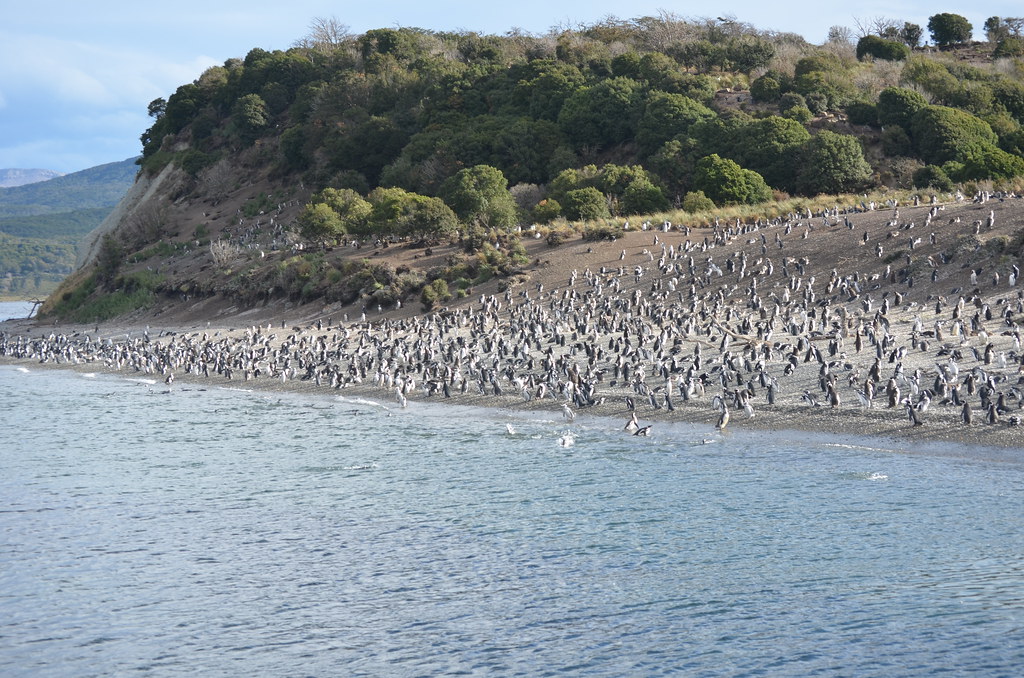
The cooler water off South America is nutrient-rich, supporting high levels of primary productivity, diverse marine ecosystems, and major fisheries. Clouds and rainfall are found in rising air over the warmest water near Asia, whereas the east Pacific is relatively dry.
Recent El Niño Activity: 2023-2024
The 2023-24 El Niño has peaked during November-January and is now gradually weakening. The 2023-24 El Niño event started emerging in June 2023 and peaked in November 2023 – January 2024 as one of the five strongest on record before dissipating. The past nine years have been the warmest on record even with the cooling influence of a multi-year La Niña from 2020 to early 2023.
As of mid-February 2025, the equatorial Pacific is characterized by weak La Niña conditions, with slightly cooler-than-average sea surface temperatures in the east-central region, a pattern that has been present since December 2024. The latest forecasts from the WMO Global Producing Centres for Seasonal Prediction indicate that the sea surface temperatures in the equatorial Pacific are expected to become closer to average.
Current Status and 2025 Forecasts
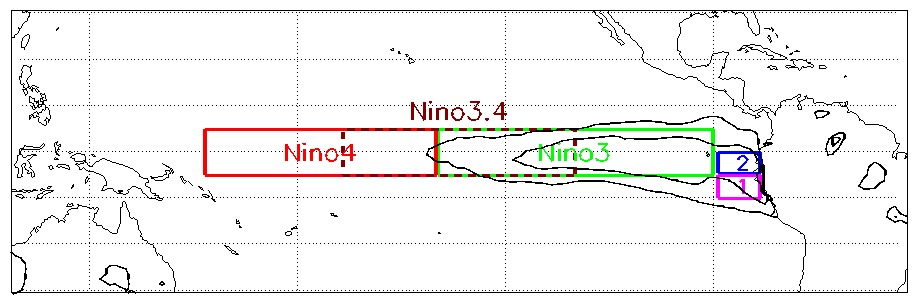
As of mid-July 2025, the equatorial Pacific remains in an ENSO-neutral state, with sea surface temperatures in the Niño 3.4 region close to average. The most recent weekly average of the NINO3.4 index was +0.1 °C. The latest seasonal, monthly, and weekly values suggest that the tropical Pacific has been experiencing ENSO-neutral conditions.
ENSO-neutral is most likely through the late Northern Hemisphere summer 2025 with a 56% chance in August-October. According to the ENSO forecast issued by the IRI in July 2025, there is a high probability of 75% of ENSO-neutral conditions continuing during July–September 2025, while the chances for La Niña and El Niño are 20% and 5%, respectively. Thereafter, a brief period of La Niña conditions is favored in the fall and early winter 2025-26 before reverting to ENSO-neutral.
La Niña’s Brief 2024-2025 Appearance
After months of hearing about the possibility of the world entering a La Niña climate pattern, NOAA’s Climate Prediction Center announced that water temperatures in critical parts of the Pacific Ocean had finally reached the threshold required for La Niña to emerge in December. La Niña is characterized by lower-than-average sea-surface temperatures, with anomalies of at least -0.5 degrees Celsius over parts of the Central and Eastern Pacific.
With the March 2025 Niño-3.4 index measuring -0.01 °C according to the most reliable sea surface temperature dataset, we can say with confidence that La Niña conditions have ended. After dipping into La Niña for a few months, the Niño-3.4 index returned to near average in March 2025. Even though La Niña is officially here, the CPC expects it to remain weak. A weak La Niña is less likely to have a significant impact on weather patterns during the winter and spring.
El Niño’s Impact on Weather Patterns
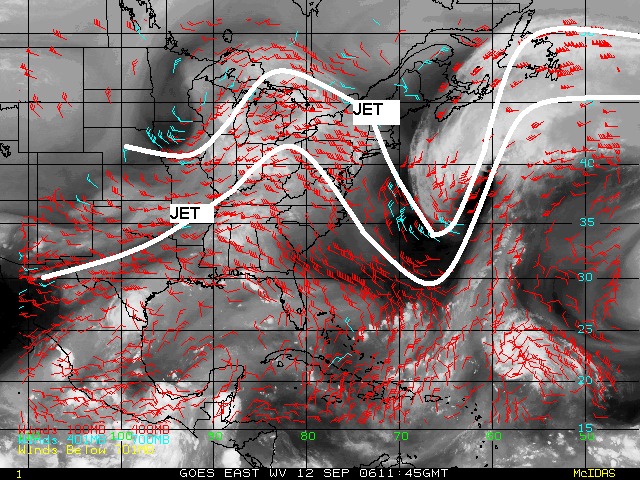
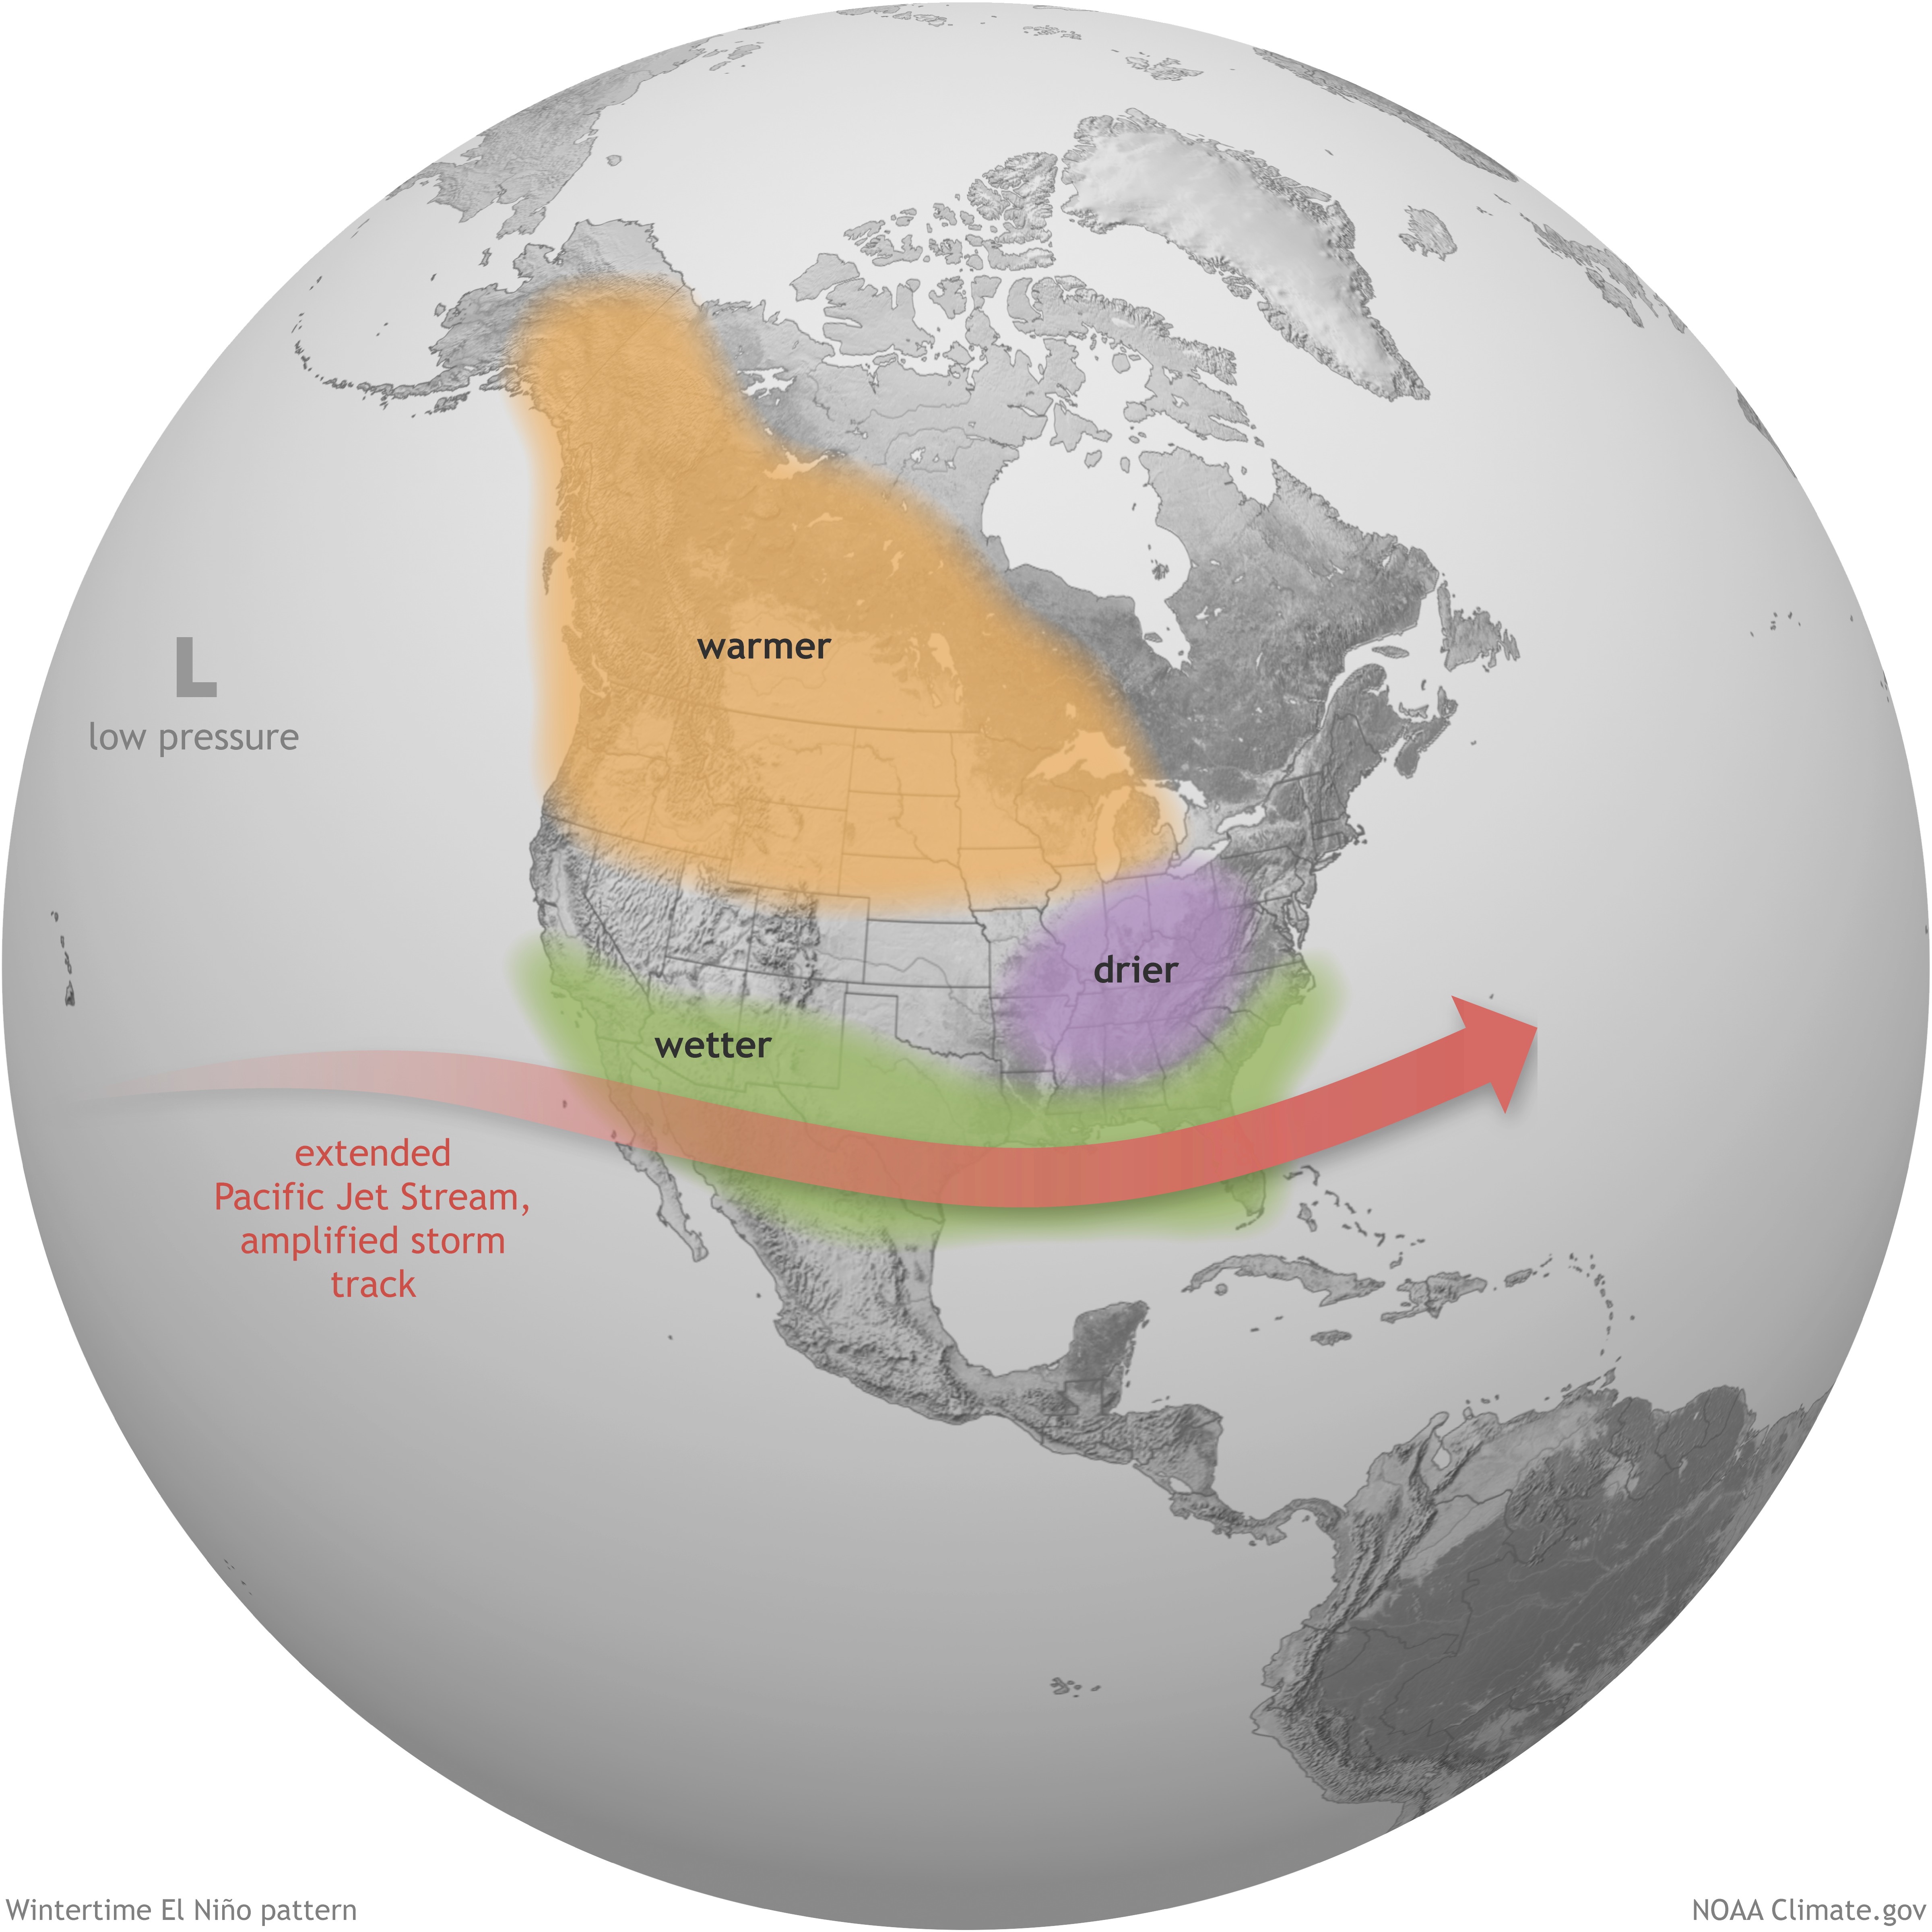
The warmer waters cause the Pacific jet stream to move south of its neutral position. With this shift, areas in the northern U.S. and Canada are dryer and warmer than usual. But in the U.S. Gulf Coast and Southeast, these periods are wetter than usual and have increased flooding. The eastward movement of oceanic and atmospheric heat sources cause unusually severe winter weather at the higher latitudes of North and South America. Regions as far north as the U.S. states of California and Washington may experience longer, colder winters because of El Niño.
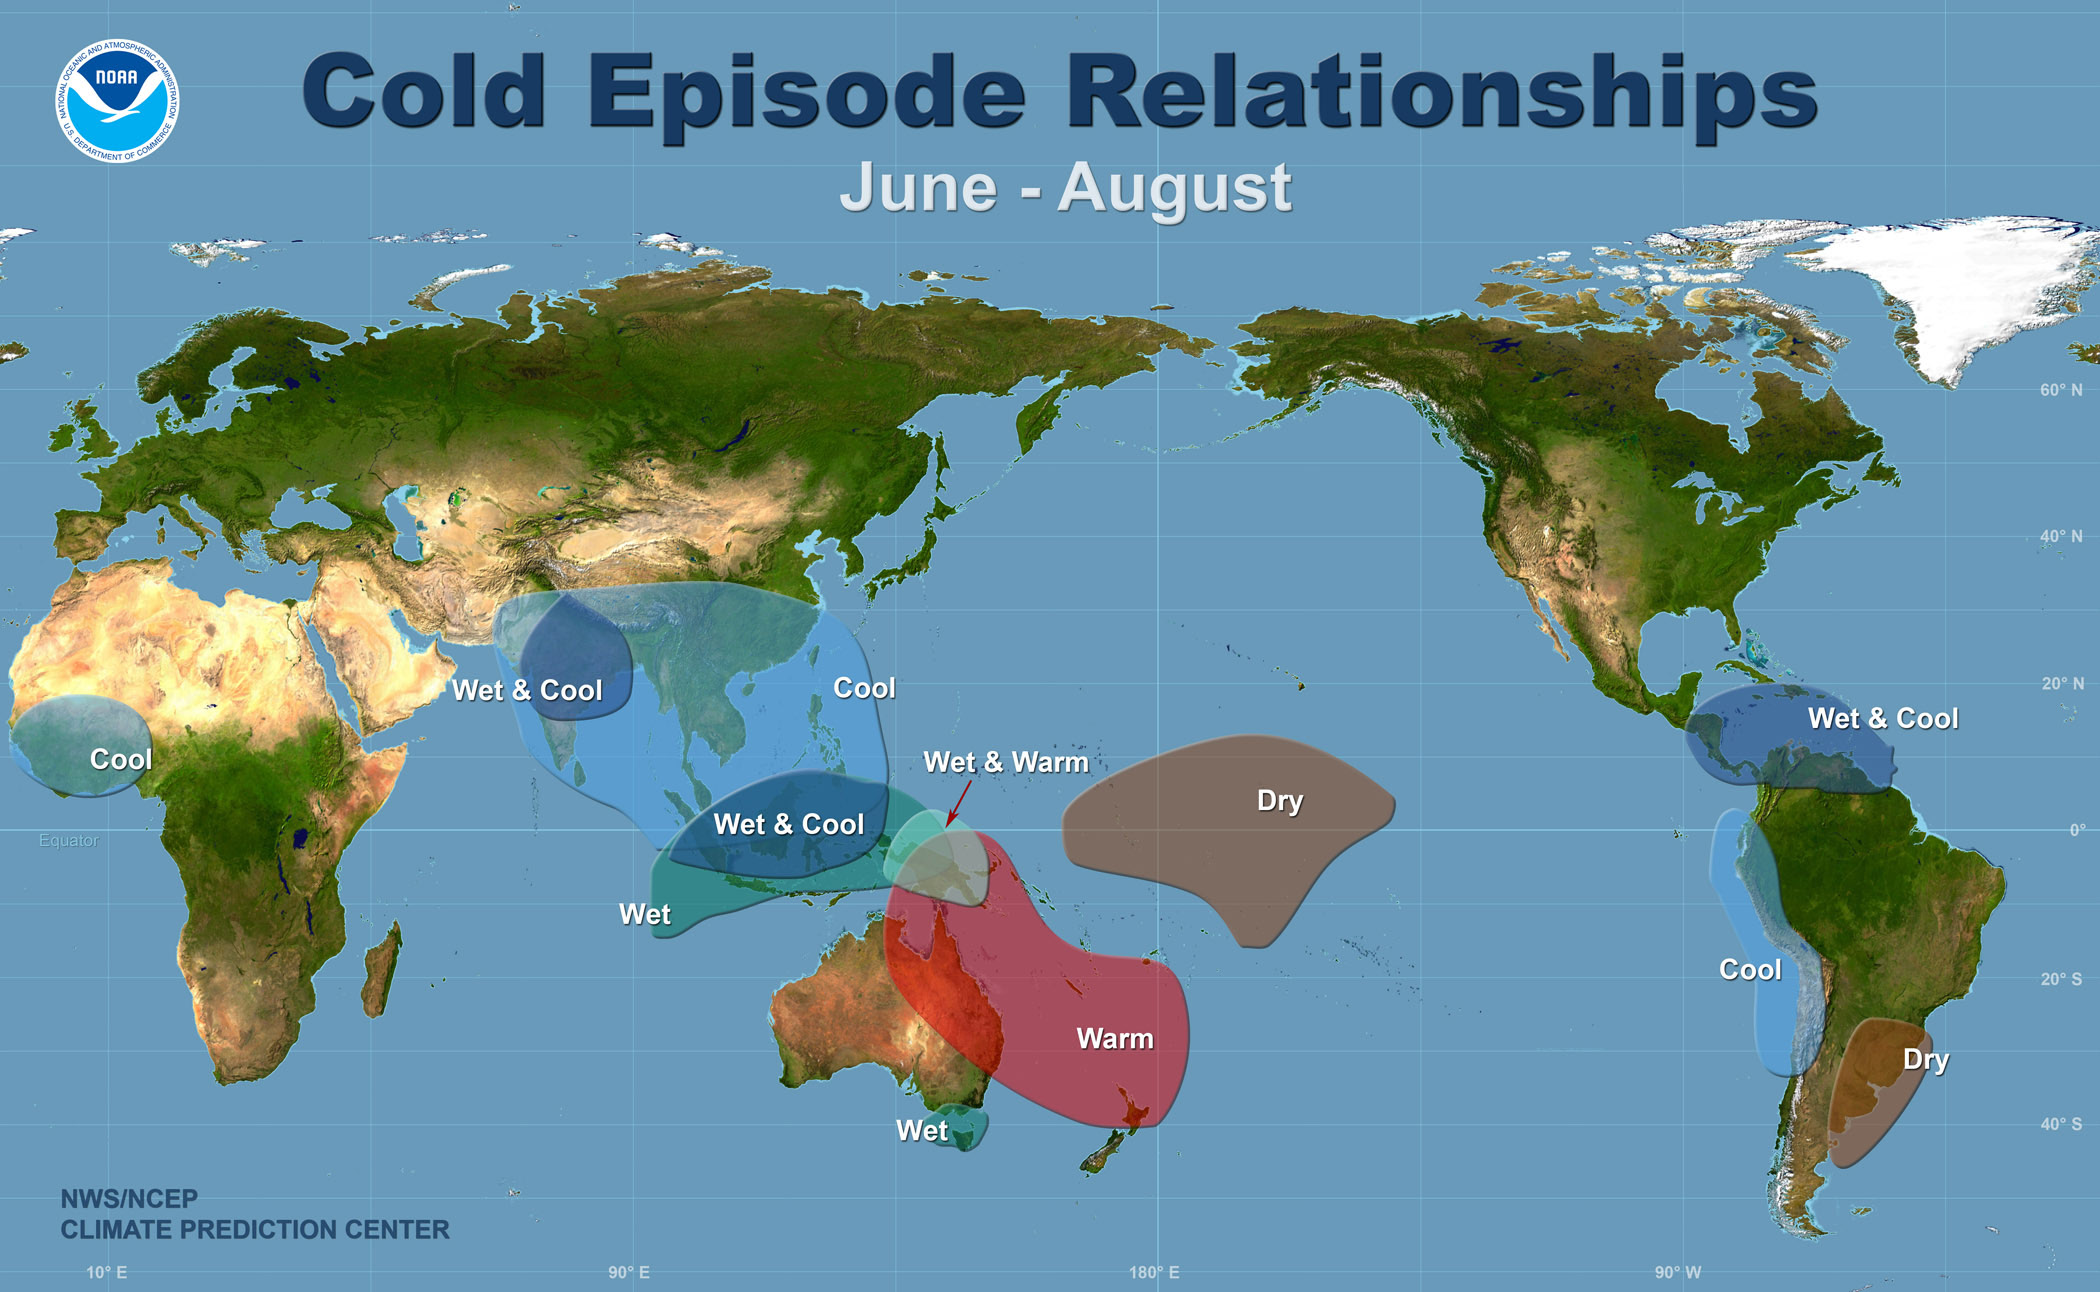
During particularly severe El Niño events in the tropical Pacific, the typical dry weather along the Pacific coast of South America is replaced by floods, while the Southeast Asia and Australia region experiences devastating drought instead of its usual tropical humidity. The climate in these regions then flips from its normal conditions into the opposite climatic extreme.
La Niña’s Weather Effects
These cold waters in the Pacific push the jet stream northward. This tends to lead to drought in the southern U.S. and heavy rains and flooding in the Pacific Northwest and Canada. During a La Niña year, winter temperatures are warmer than normal in the South and cooler than normal in the North. Traditionally, a La Niña winter produces warmer-than-average temperatures across the southern U.S., drier conditions in the West, and colder, stormier weather in the northern tier of the country.
Speaking of La Niña impacts, you might recall there’s a link between La Niña and active Atlantic hurricane seasons. In brief, La Niña reduces vertical wind shear – the difference between near-surface winds and upper-level winds – and makes it easier for hurricanes to grow. La Niña can also lead to a more severe hurricane season.
The 2024-2025 La Niña’s Unusual Behavior
But after a closer examination of the 2024-2025 winter, the climate pattern defied some of these typical patterns. While temperatures in much of the country were close to average, regions from the Southwest to Texas experienced above-normal readings, with some of the warmest conditions in the nation. Conversely, the mid-Atlantic, Southeast and Florida experienced colder-than-usual temperatures, which was particularly unusual given the La Niña state.
That said, it’s interesting that the October–December 2024 temperature and rain/snow patterns over the U.S. resemble the expected patterns from previous La Niña events. The pattern here resembles what we would expect in October–December from combined climate trends and La Nina.
Historical Strength and Frequency
Thanks to historical sources, the El Niño events over the last 450 years can easily be ascertained. To our knowledge, there have been 47 strong or very strong El Niño events during this period. “Strong” means an increase in sea surface temperatures of between 3°C and 5°C off the Peruvian coast, while “very strong” means a temperature increase of more than 5°C. On average, strong or very strong El Niño events have recurred every 10 years over the past 450 years.
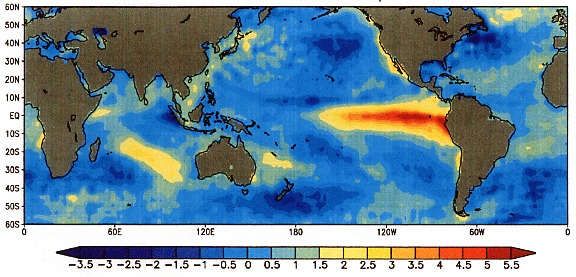
El Niño events of 1982-83 and 1997-98 were the most intense of the 20th century. During the 1982-83 event, sea-surface temperatures in the eastern tropical Pacific were 7.8-12.8° C above normal. These strong temperature increases caused severe climatic changes: Australia experienced harsh drought conditions; typhoons occurred in Tahiti; and record rainfall and flooding hit central Chile.
The Science Behind ENSO
The Bjerknes feedback is a positive feedback between tropical Pacific surface wind and ocean temperature, which essentially means processes in the ocean and atmosphere goad each other to bring on an ENSO event. We often don’t know exactly what initiates the feedback loop – sometimes sea surface temperatures start to cool and then the trade winds begin to strengthen, or vice versa.
The tropical Pacific receives more sunlight than any other region on Earth, and much of this energy is stored in the ocean as heat. Under neutral, normal conditions, the waters off southeast Asia and Australia are warmer and sea level stands higher than in the eastern Pacific. But as an El Niño pattern develops and trade winds weaken, gravity causes the warm water to move east. This mass, referred to as the “western Pacific warm pool,” extends down to about 200 meters in depth.
Global Climate Change Context

However, naturally occurring climate events such as La Nina and El Nino events are taking place in the broader context of human-induced climate change, which is increasing global temperatures, exacerbating extreme weather and climate, and impacting seasonal rainfall and temperature patterns. WMO Secretary-General Celeste Saulo highlights that “Since June 2023 we have seen an extended streak of exceptional global land and sea surface temperature. Even if a short-term cooling La Niña event does emerge, it will not change the long-term trajectory of rising global temperatures due to heat-trapping greenhouse gases in the atmosphere.”
El Niño events cause short-term spikes in global average surface temperature while La Niña events cause short term surface cooling. Therefore, the relative frequency of El Niño compared to La Niña events can affect global temperature trends on timescales of around ten years.
El Niño and La Niña continue to be among the most powerful climate forces on our planet, affecting everything from hurricane seasons to agricultural patterns worldwide. While we’ve gotten much better at predicting these patterns, their interaction with our changing climate keeps scientists busy trying to understand what comes next.