

- Why Scientists Track Atmospheric Carbon With Giant Towers - October 7, 2025
- The Link Between Melting Ice and Rising Sea Levels Explained - October 6, 2025
- How Ocean Currents Help Regulate Global Climate - October 5, 2025
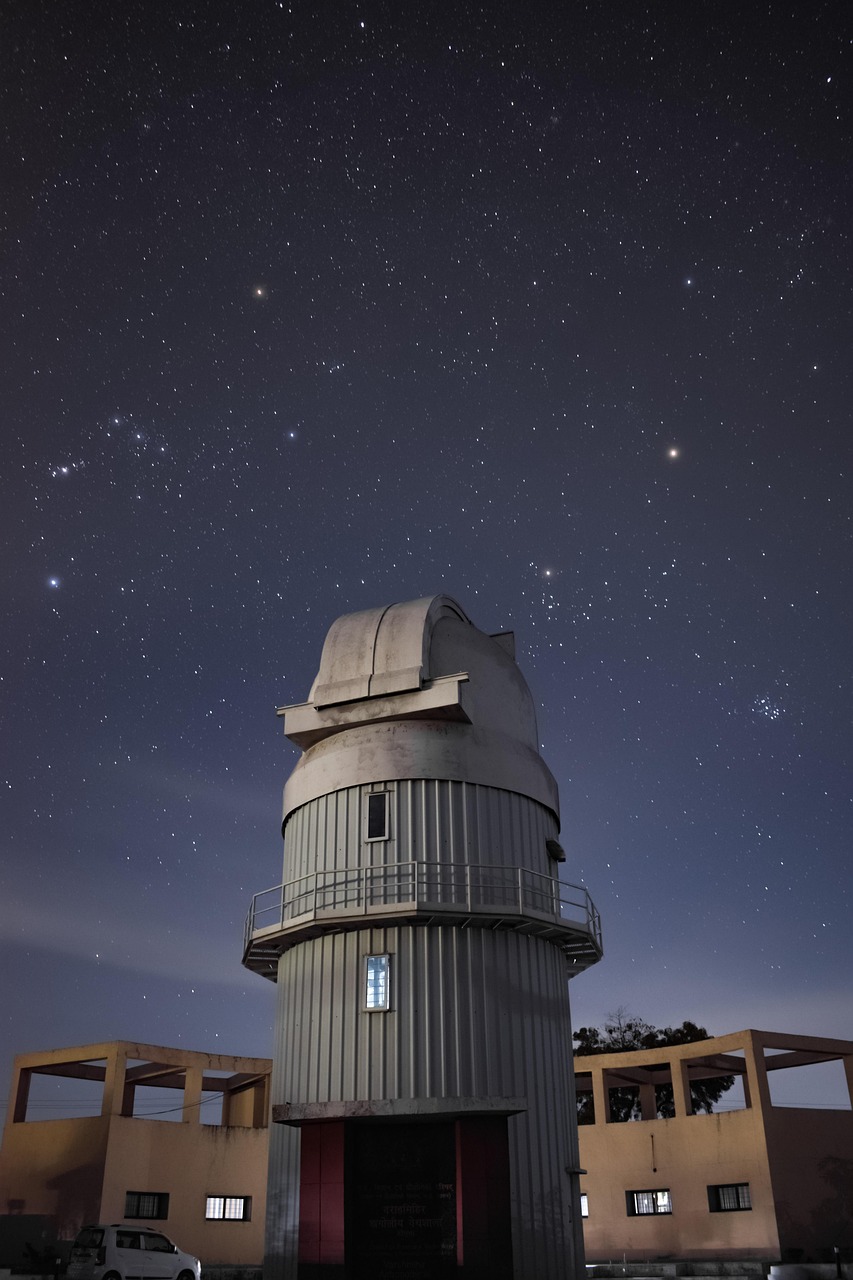
The Birth of Atmospheric Monitoring
The carbon dioxide data on Mauna Loa constitute the longest record of direct measurements of CO2 in the atmosphere. They were started by C. David Keeling of the Scripps Institution of Oceanography in March of 1958 at a facility of the National Oceanic and Atmospheric Administration. What started as a single researcher’s curiosity about atmospheric composition has evolved into a global network of monitoring stations. The idea was revolutionary at the time – instead of just studying pollution at ground level, scientists realized they needed to understand what was happening high above our heads. This breakthrough came when researchers discovered that the atmosphere was like a massive mixing bowl, constantly stirring gases from around the world. NOAA started its own CO2 measurements in May of 1974, and they have run in parallel with those made by Scripps since then.
The Science Behind the Height
Tall tower measurements allow us to determine the flux (how much is being released or soaking up) of trace gases over larger areas than is possible by just measuring at the surface. Because air mixes upward over time, the higher you sample the air, the larger “footprint” you are sampling from. Think of it like trying to understand traffic patterns in a city – you wouldn’t just look at one intersection. The taller the vantage point, the more you can see. For instance, CO2 being released by a factory 20 miles away from the tower will mix with air from the surrounding area as it goes up into the sky. If you sample the air 300 meters above the ground, you may be able to detect the effects of that factory. But if you sampled the air at the ground, you would most likely not be able to detect the effects of the CO2-emitting factory 20 miles away. This principle explains why scientists prefer these towering monitoring stations – they capture the bigger picture rather than just local influences.
Record-Breaking Carbon Levels in 2024
The global average carbon dioxide set a new record high in 2024: 422.5 parts per million (“ppm” for short). The increase over 2023 amounts was 2.8 ppm. This dramatic spike caught many scientists off guard and highlighted just how crucial these monitoring towers have become. The largest spike shown in 2024, represents an annual increase of 2.8 parts per million of carbon dioxide in the air. It is the largest yearly increase since measurements started in the 1950s. The towers detected this unprecedented jump months before satellite data or computer models could confirm it. Monthly readings at Mauna Loa peaked at around 427 ppm in May 2024.
The Technology That Never Sleeps
CO2, the most important greenhouse gas, is measured continuously at all the tall towers. Most towers also measure carbon monoxide (CO) and/or methane (CH4) continuously as well. In addition, flask samples are taken daily at each tower. These flasks are sent back to the CCGG Boulder Central Facility for analysis of more than 50 greenhouse and other trace gases. The technology is remarkably sophisticated – imagine having a laboratory that runs 24/7 without human intervention, collecting air samples every few minutes and analyzing them with precision that can detect changes as small as parts per million. Carbon dioxide is the principal carbon greenhouse gas, and measurements of its abundance are sensitive to upwind fluxes, including fossil fuel emissions and uptake and release by vegetation and soils. Carbon monoxide is an indicator of combustion, and elevated levels can result from urban or industrial emissions or from biomass burning. CO data contribute to the interpretation of CO2 measurements by helping to identify and quantify pollution episodes.
The Boulder Giant: A Research Marvel
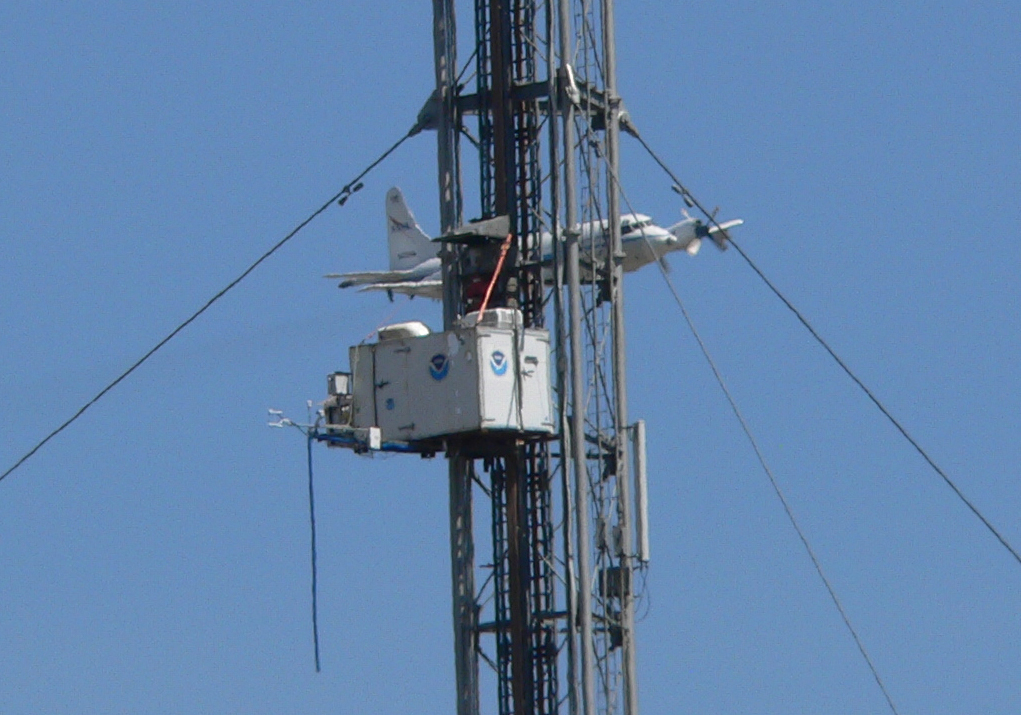
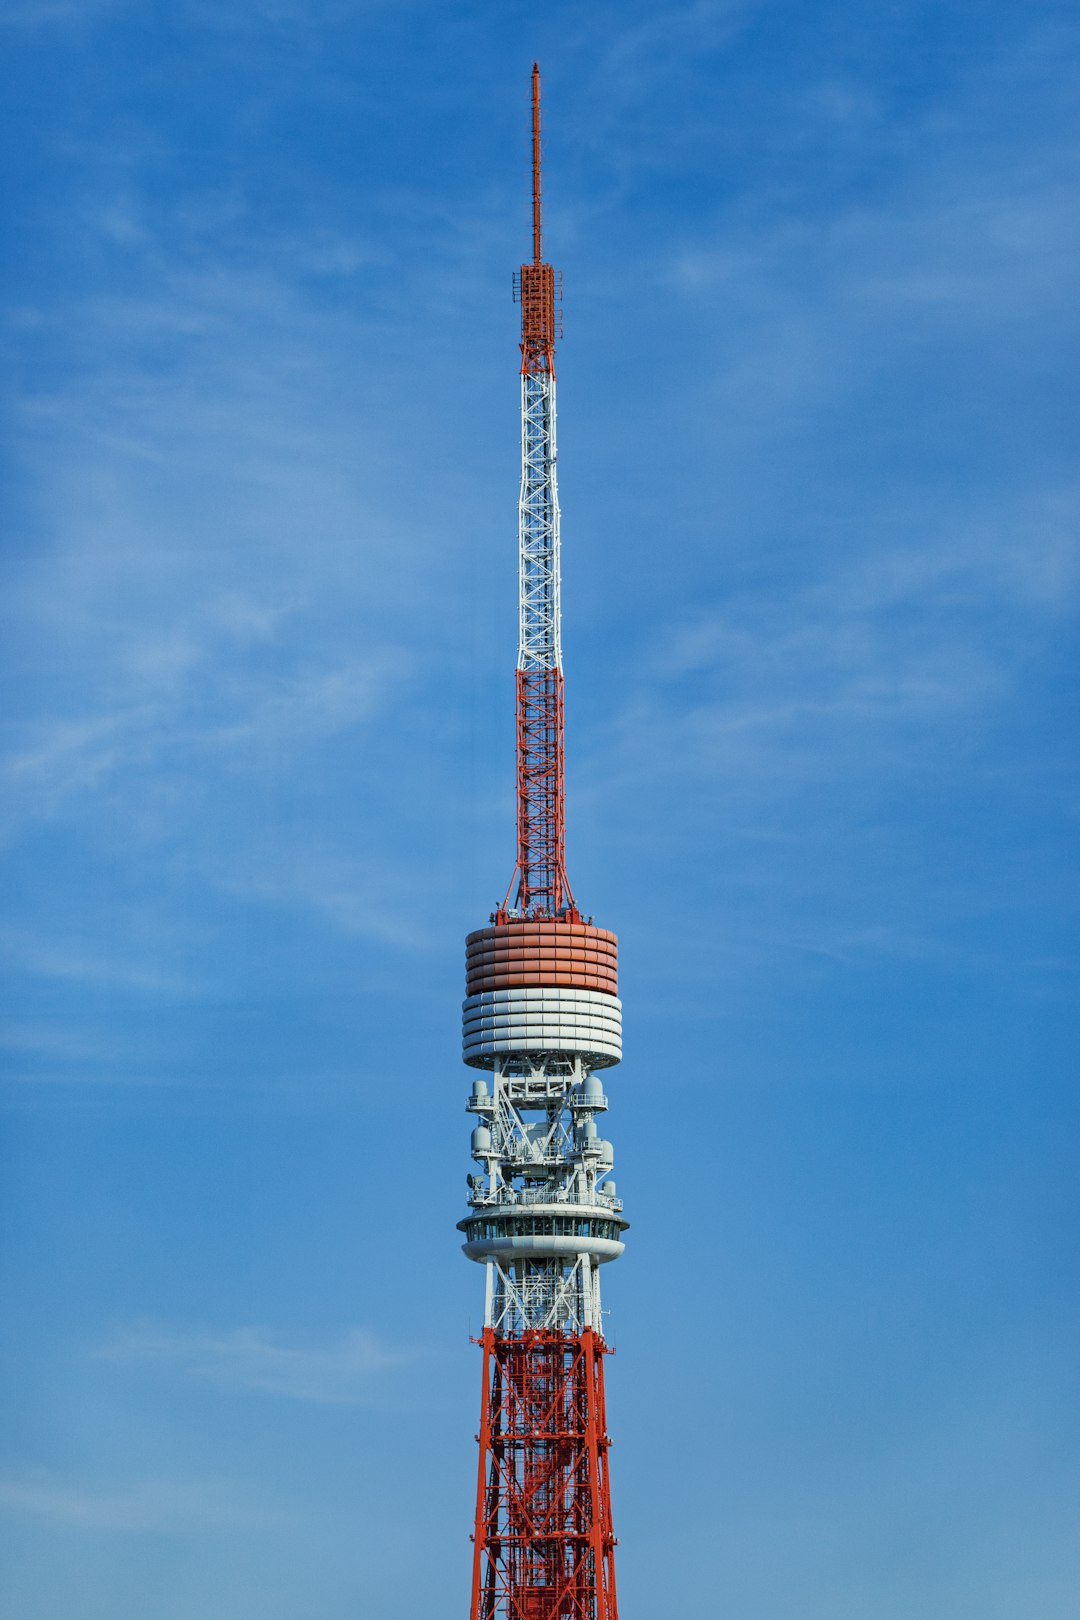
The BAO Tower stands 300 meters tall (almost 1,000 feet) and is instrumented with air sampling inlets at three heights up the tower (22m, 100m, and 300m). This particular tower is special because unlike all the other towers in our network, the Boulder Atmospheric Observatory (BAO) Tall Tower was built specifically for atmospheric research. The Eiffel Tower is 30m taller than the BAO Tower. Visitors are often shocked by the sheer scale of these structures – they’re engineering marvels that can withstand hurricane-force winds while maintaining incredibly precise measurements. An elevator is equipped on the BAO Tower, which is not seen on many of the other towers within the Air Sampling Network, making maintenance possible even at these dizzying heights.
Strategic Tower Placement Across America
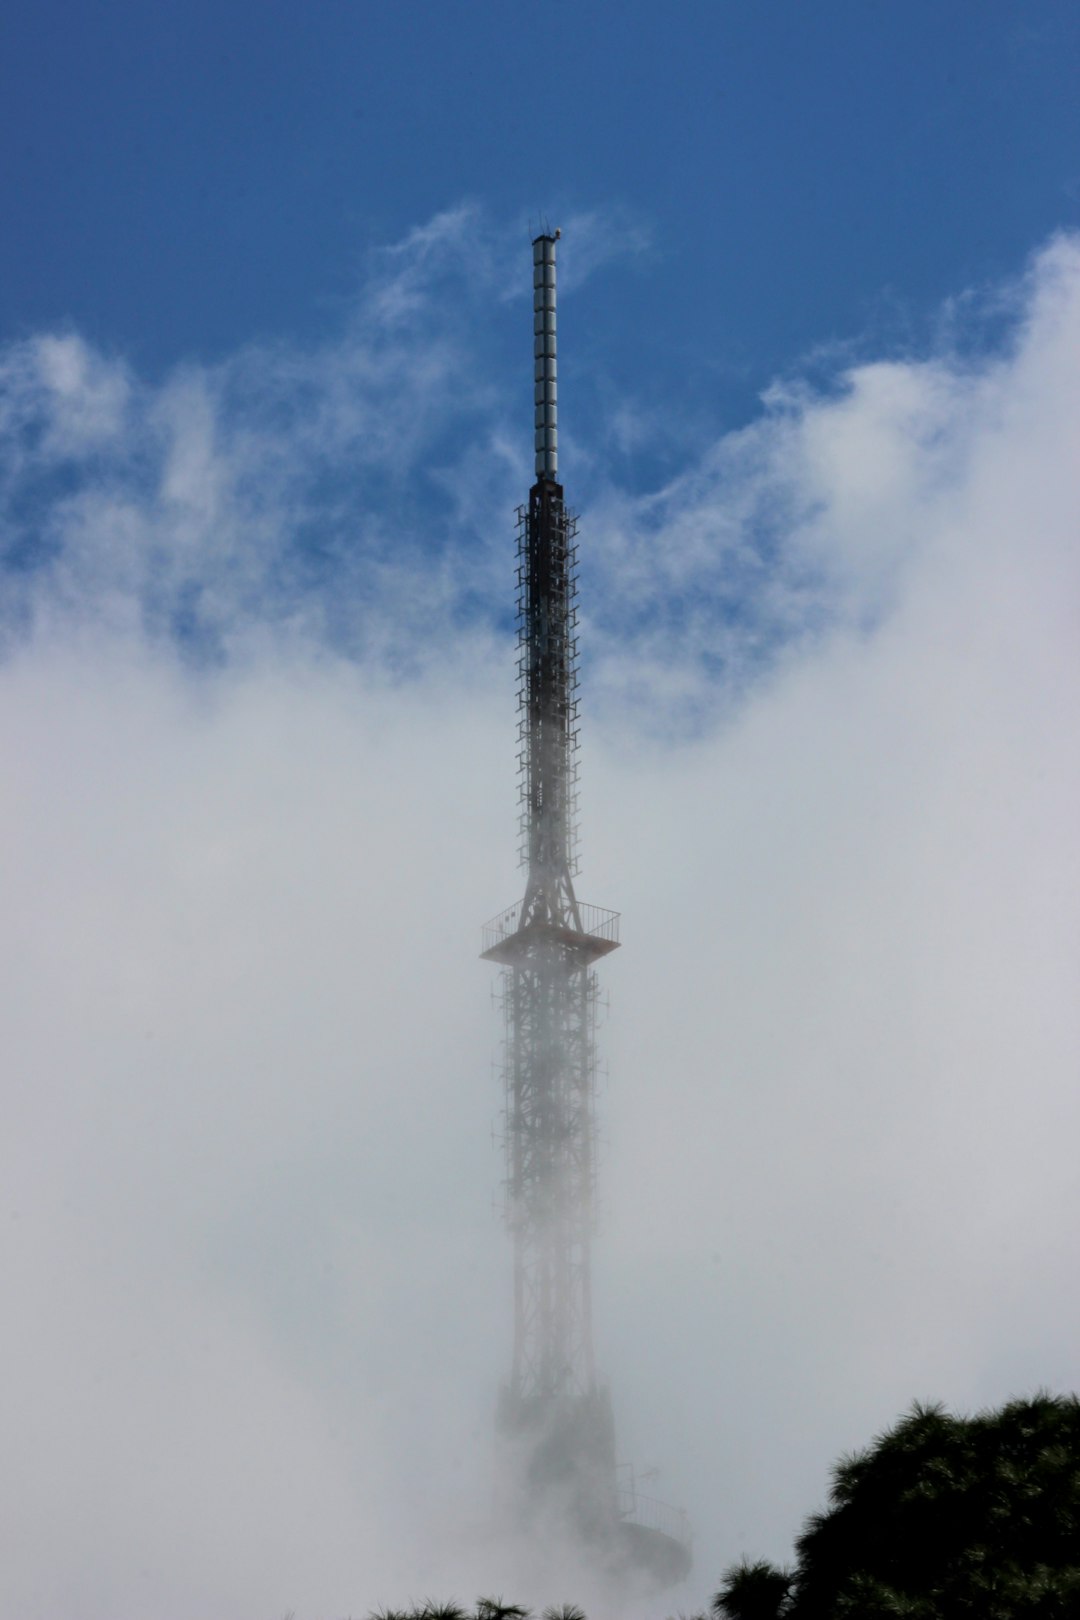
Plans call for the addition of six more towers distributed throughout the continental US over the next several years. The current network includes towers in strategic locations from coast to coast. The WLEF station is located 24 km west of Park Falls, Wisconsin (pop. 3200) in the Chequamegon National Forest (about 325,000 ha). The region immediately surrounding the tower is dominated by boreal lowland and wetland forests typical of the region. The sampling platform is the WLEF television transmission tower (447 m tall). Scientists didn’t randomly choose these locations – each tower placement represents years of research into wind patterns, regional ecosystems, and atmospheric mixing. The Colorado Atmospheric Observatory (CAO) site was chosen to sample continental background air east of the Rocky Mountains. CAO is located near Leader, Colorado 40 miles due east from the Denver International Airport.
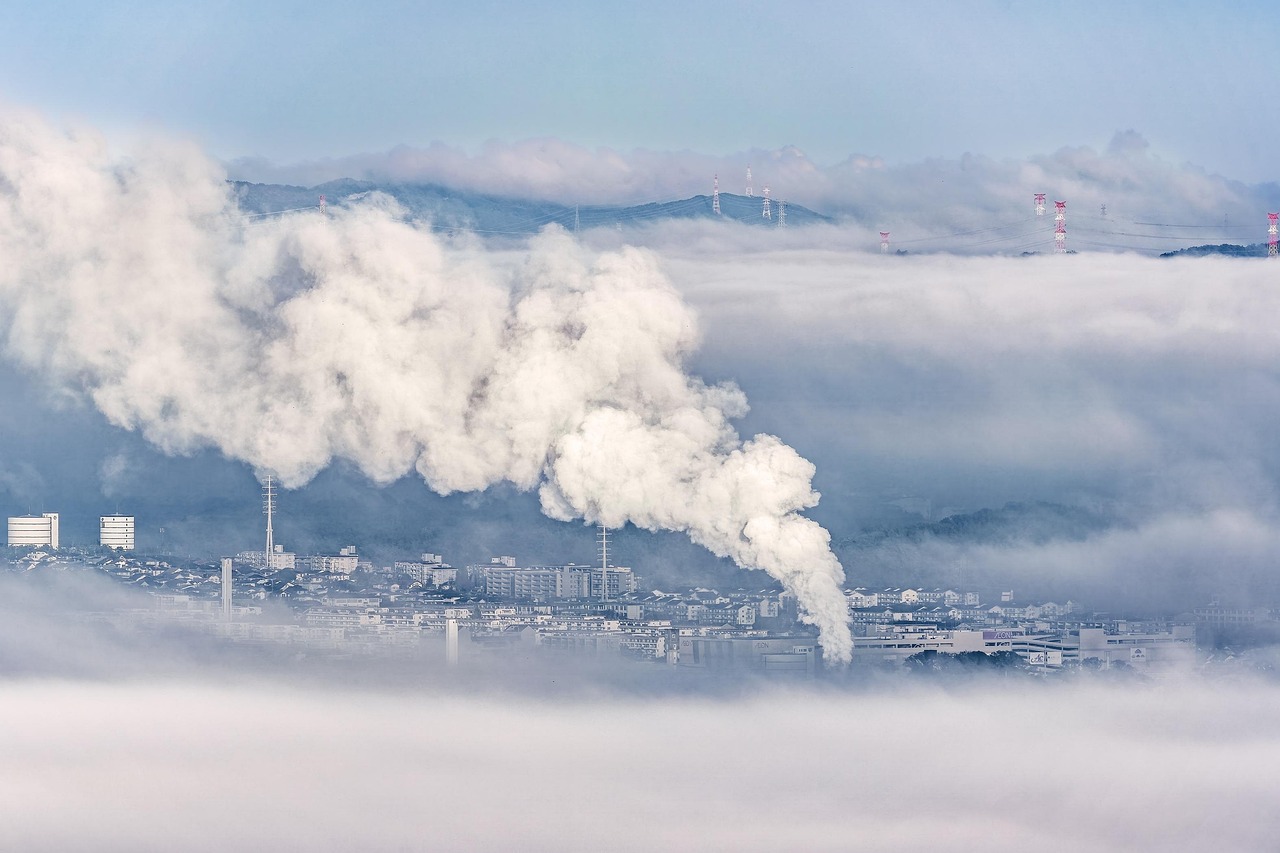
Detecting Regional Pollution Sources
The towers serve as atmospheric detectives, capable of identifying pollution sources from surprisingly far away. Instrumentation for monitoring CO2 and CO was installed in April 2007. Because of its proximity to the Denver metropolitan area, measurements from the BAO tower will provide detailed information about urban and industrial sources of CO2. What’s fascinating is how sensitive these instruments are – they can detect carbon signatures from different sources. Notice winds from the west carry air that has the least amount of CH4, CO, and hydrocarbon pollutants, whereas winds from the south, north, and east have elevated levels of these pollutants. This is because the city of Denver lies to the south and many oil and gas wells are located in northeastern Colorado, which leaks these hydrocarbons into the air. This capability makes them invaluable for tracking down pollution sources and verifying emissions reductions.
Global Background vs. Regional Signals
NOAA/GML operates staffed atmospheric baseline observatories from which numerous in situ and remote atmospheric and solar measurements are conducted. These observatories were established in order to provide sampling of the most remote air on the planet so that the true “background atmosphere” could be monitored. The network includes both remote baseline stations and continental towers, each serving different purposes. GML measures greenhouse gases at four of the Observatories: Barrow, Alaska; Mauna Loa, Hawaii; American Samoa; and South Pole, Antarctica. While baseline observatories measure global background concentrations, the tall towers capture regional variations that help scientists understand local and regional carbon sources and sinks. This dual approach provides both the global picture and regional details needed for comprehensive climate monitoring.
The Wildfire Connection
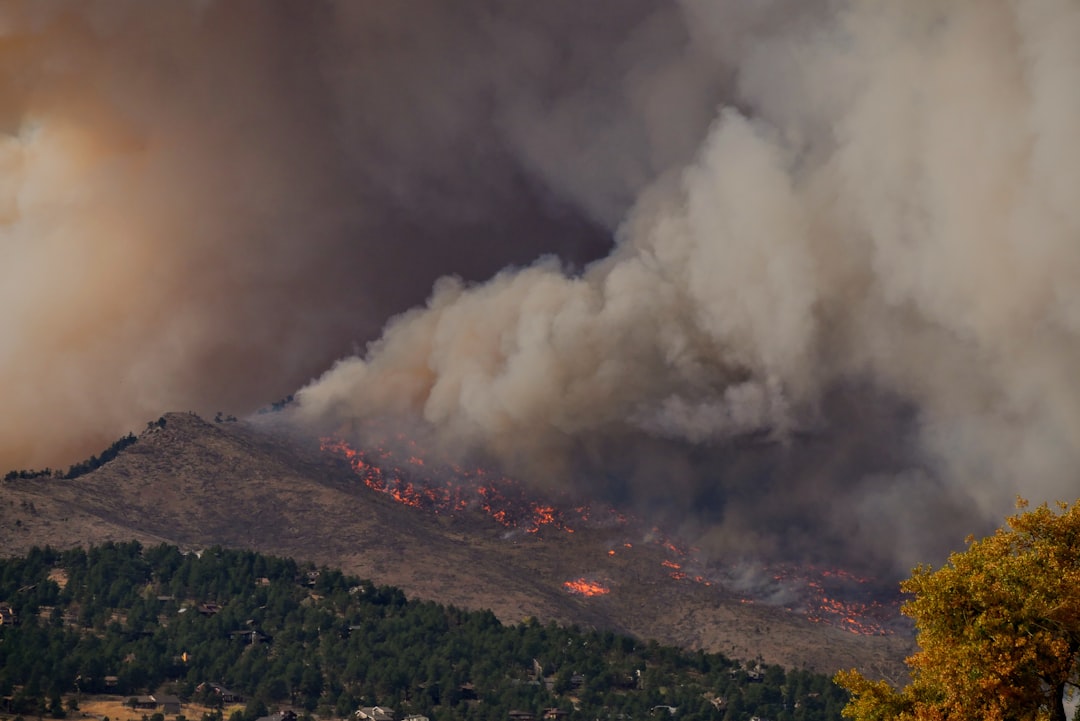
Even though the 2023-24 El Niño had waned by April, record high air temperatures and drought in all of 2024, similar to those during an El Nino, were likely drivers of the large increase in atmospheric carbon dioxide in 2024. In addition to other factors, large forest fires in both the Amazon and Canada contributed to the 2024 global increase. The towers have become crucial for tracking the atmospheric impacts of increasingly severe wildfire seasons. 2024 saw the second highest global burden of carbon monoxide (CO) on record, based on the dataset going back to 2003, after the year 2016. The exceptionally high emissions from wildfires in South America, mentioned above, contributed largely to these record values. The emissions were transported over the Pacific and Atlantic Oceans leading to remarkable positive CO anomalies. These measurements help scientists understand how climate change and wildfires create feedback loops that accelerate atmospheric carbon accumulation.
Seasonal Breathing of the Planet

The seasonal cycle of highs and lows (small peaks and valleys) is driven by Northern Hemisphere summer vegetation growth, which reduces atmospheric carbon dioxide, and winter decay, which increases it. The long-term trend of rising carbon dioxide levels is driven by human activities. The towers capture what scientists call the “breathing” of our planet – the natural rise and fall of CO2 as plants grow and die with the seasons. At Mauna Loa, the highest monthly value each year occurs in May. In May 2024, carbon dioxide hit just under 427 ppm – a new record. This seasonal pattern is like a planetary heartbeat, with the Northern Hemisphere’s vast forests acting as the lungs of the Earth. The towers reveal how this natural cycle is being overwhelmed by human emissions, creating an ever-rising baseline despite nature’s best efforts to absorb excess carbon.
Supporting Climate Policy Decisions
For example, measurements of the greenhouse gas, carbon dioxide, collected at the BAO tower and at seven similar towers across the country feed into NOAA’s Carbon Tracker system. Carbon Tracker is a sophisticated model designed to help policy makers, industry leaders, and the public better understand the dynamics of carbon dioxide in the atmosphere so they can make more informed decisions regarding their emissions of this greenhouse. The data from these towers doesn’t just sit in academic journals – it directly influences policy decisions at local, national, and international levels. Data from NOAA’s network of “tall towers” helps state and local governments measure their efforts at reducing carbon emissions. Government officials use this information to track whether emission reduction policies are working and to identify areas where more action is needed. The towers provide the objective, real-time measurements that policymakers need to make evidence-based decisions about climate action. These towering sentinels of atmospheric science continue their silent vigil, measuring the invisible changes that will determine our planet’s future. Their data provides the foundation for climate science, policy decisions, and our understanding of how human activities are reshaping Earth’s atmosphere. As carbon dioxide levels reach unprecedented heights, these monitoring towers remain our most reliable witnesses to one of the greatest challenges of our time.