

- What Earth’s Magnetic Field Has to Do With Climate History - October 7, 2025
- The Science Behind Heat Domes and Their Growing Impact - October 7, 2025
- What Ancient Lake Beds Teach Us About Past Rainfall Patterns - October 6, 2025
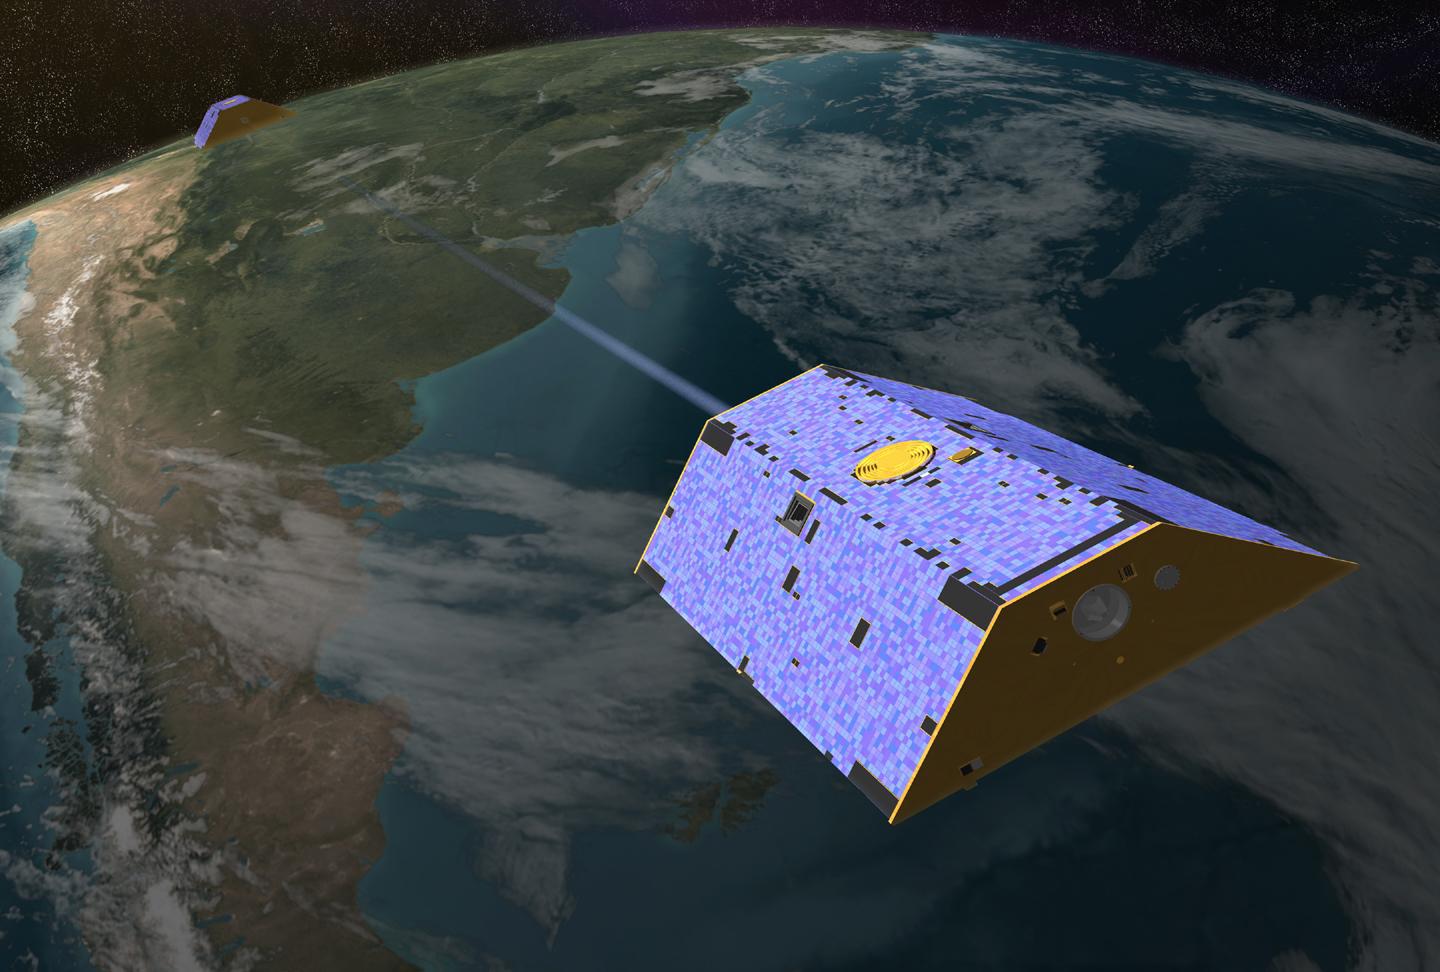
Revolutionary GRACE Satellites Transform Ice Sheet Monitoring
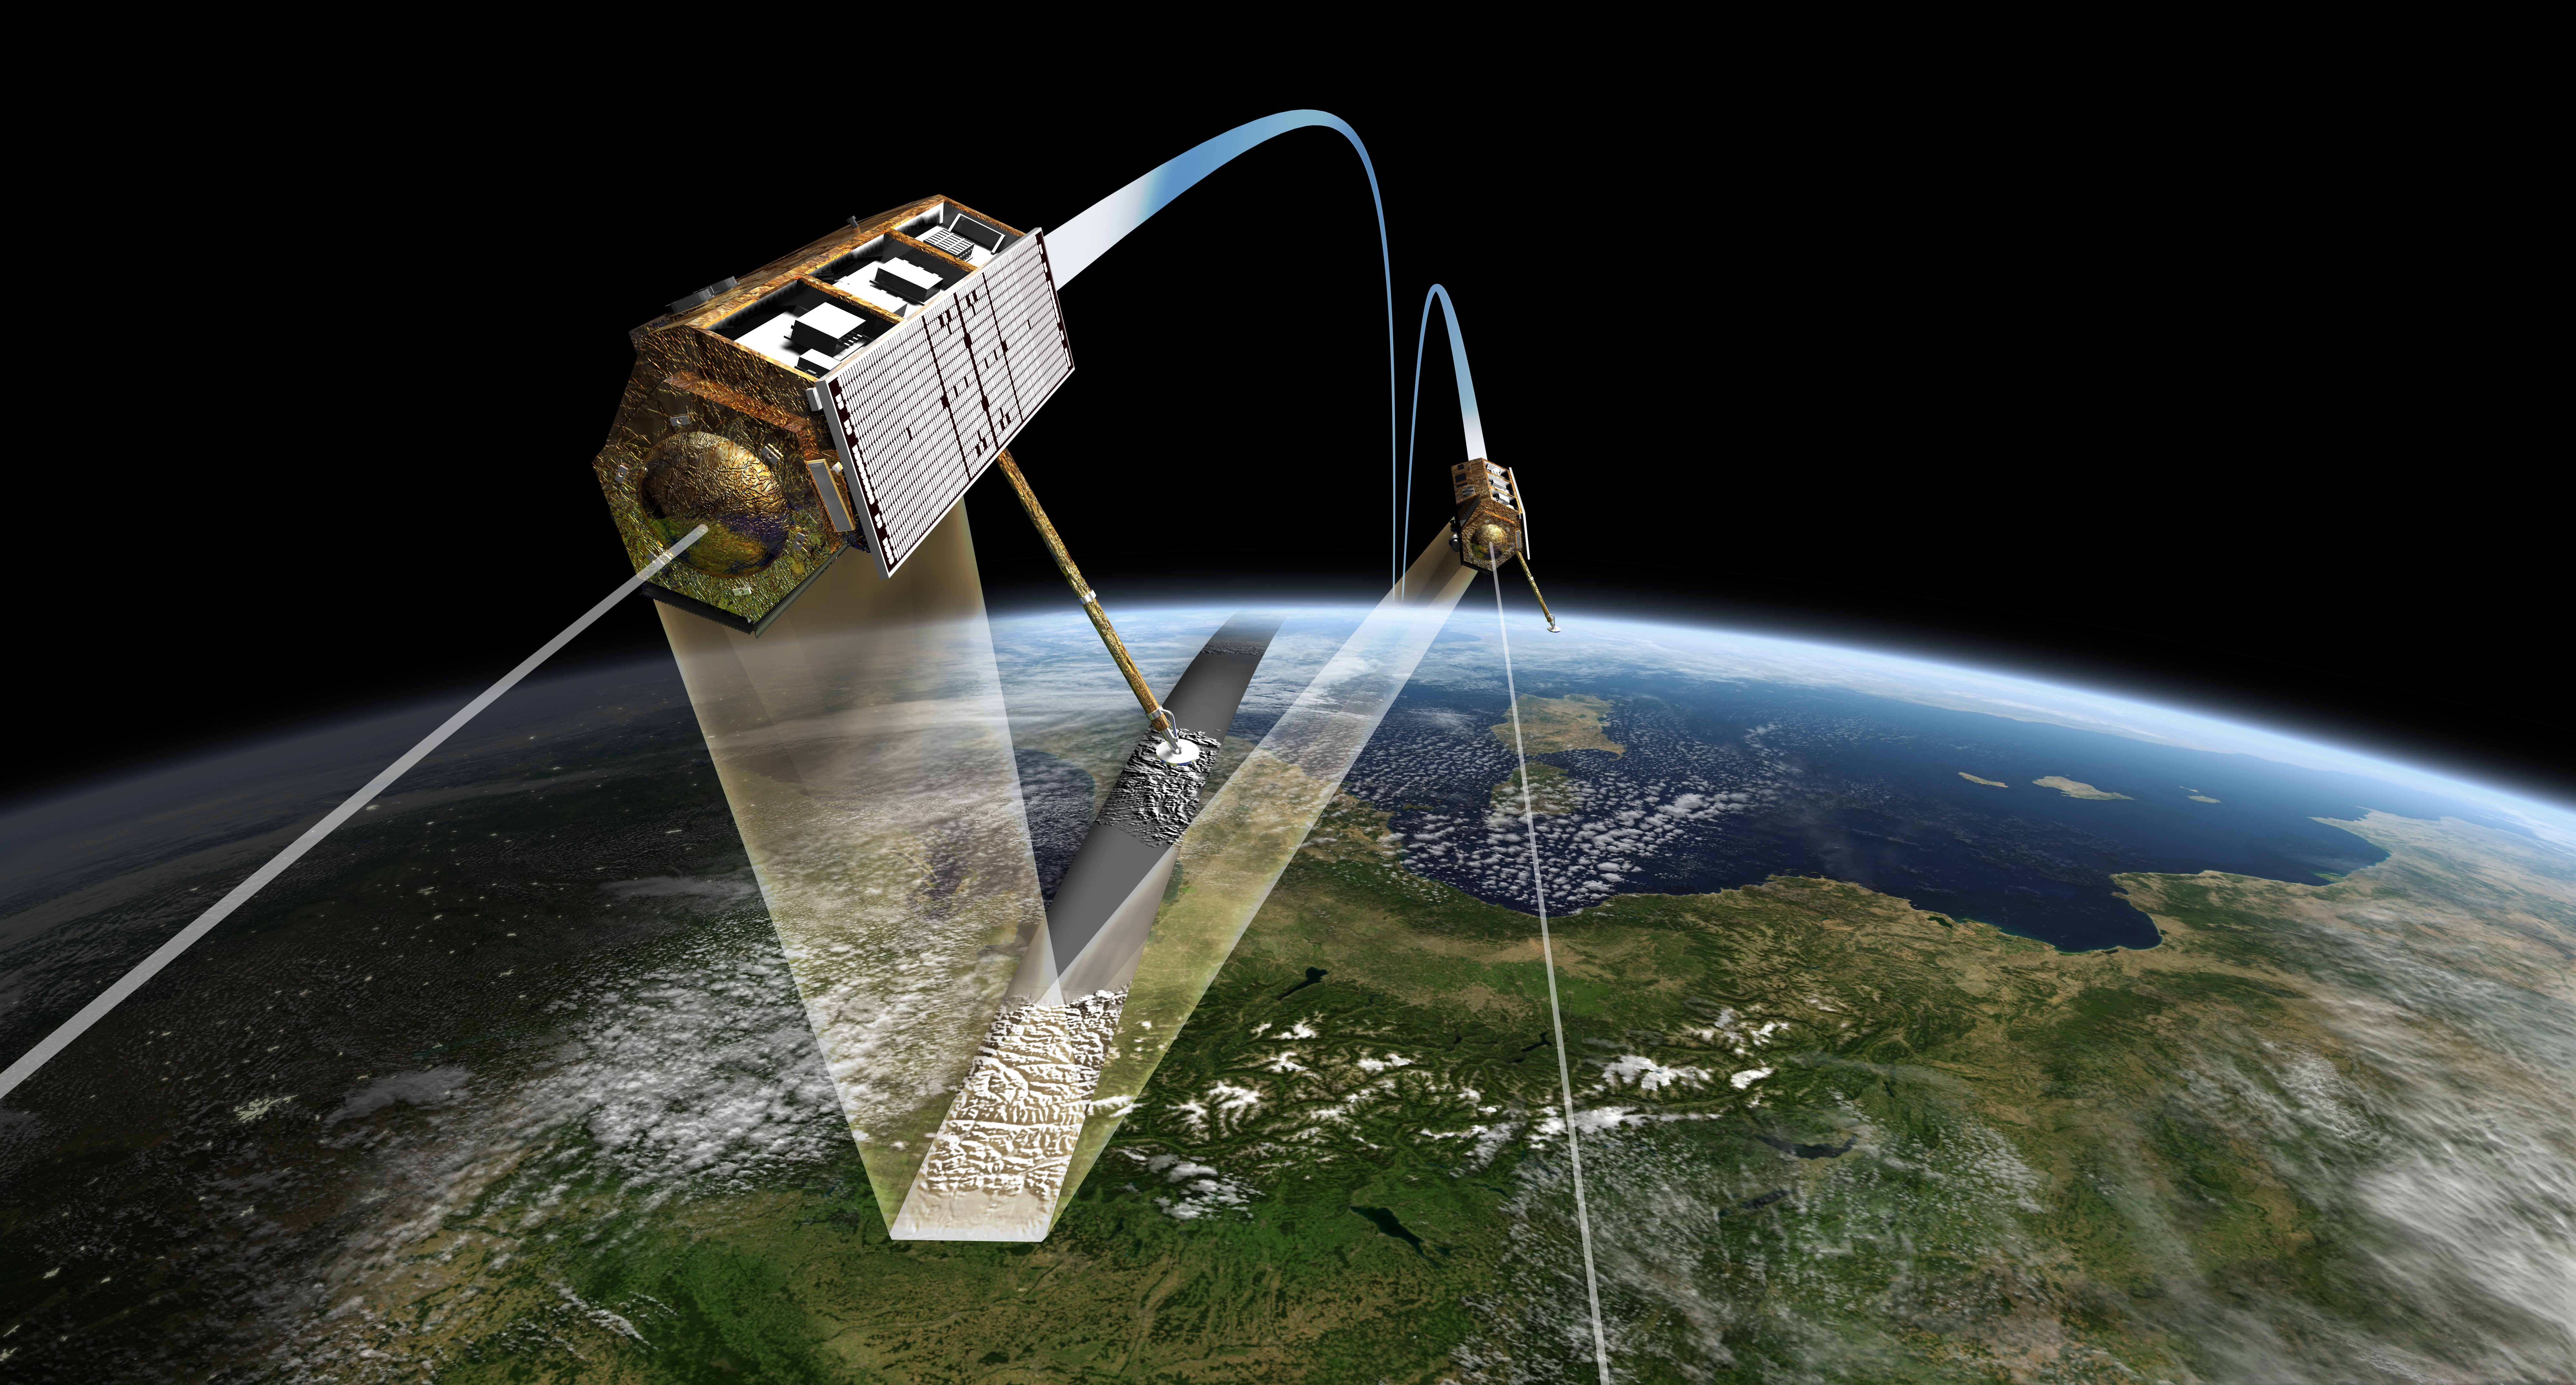
The twin GRACE-1 and GRACE-2 satellites measure minute shifts in Earth’s gravity to chart flows of mass across the planet, such as the unexpectedly rapid melt of polar ice sheets. These revolutionary spacecraft work in tandem, flying roughly 220 kilometers apart and constantly monitoring their distance from each other with microwave pulses down to microns. When the satellites approach a more massive feature, such as an ice sheet, the enhanced gravity of that region tugs a little bit more on the first satellite – briefly widening the distance between the pair – before the second satellite catches up. This ingenious system has provided scientists with an unprecedented window into our planet’s changing ice masses since 2002.
ICESat-2 Laser Technology Revolutionizes Precision Measurements
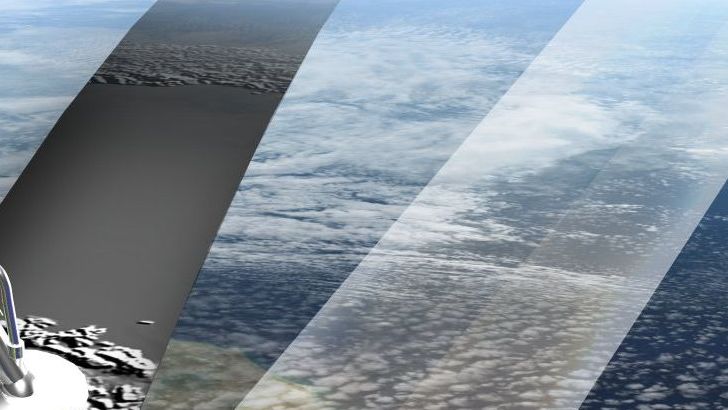
The NASA Ice, Cloud, and land Elevation Satellite 2, or ICESat-2, carries a photon-counting laser altimeter that allows scientists to measure the elevation of ice sheets, glaciers, sea ice, tree canopy height, ocean height, and more – all in unprecedented 3-D detail. The satellite’s ATLAS instrument shoots an astounding 10,000 laser pulses every second, with each pulse containing about 20 trillion photons. The sensor stops the “stopwatch” and measures the photons’ travel time to within 1-billionth of a second. Capable of measuring changes in ice thickness, forest growth and cloud height down to 0.02 inches (0.4 millimeters) every year – the thickness of a No. 2 pencil, this technology represents a quantum leap in satellite monitoring capabilities.
Groundbreaking Joint Mission Between ESA and NASA Satellites
Scientists have now delivered the first measurements of Greenland Ice Sheet thickness change using CryoSat-2 and ICESat-2 – the ESA and NASA ice satellite missions. This historic collaboration represents a breakthrough in polar science, as CryoSat-2 and ICESat-2 measurements of Greenland Ice Sheet elevation change agree to within 3%. The study made use of four years of measurements from both missions, including those collected during the Cryo2ice campaign, a pioneering ESA-NASA partnership initiated in 2020. By adjusting CryoSat-2’s orbit to synchronize with ICESat-2, ESA enabled the near-simultaneous collection of radar and laser data over the same regions.
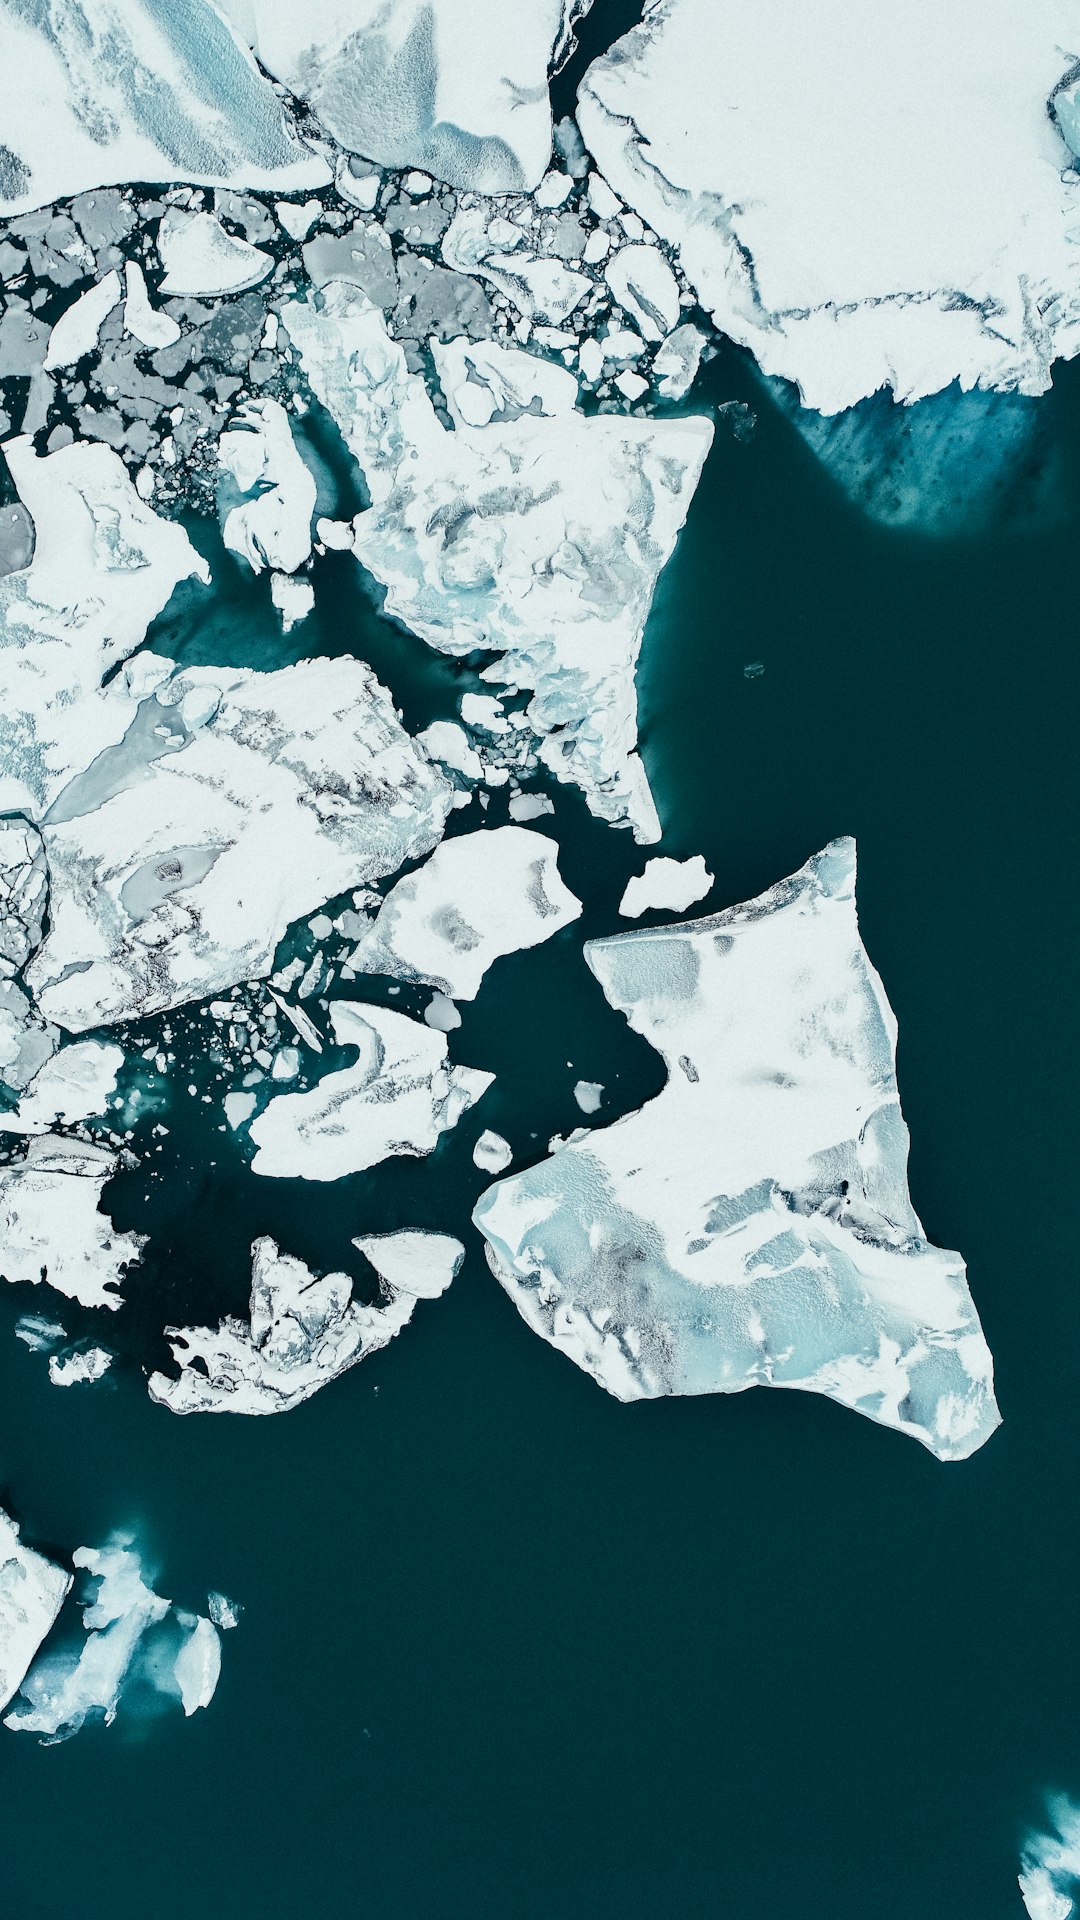
Shocking Reality of Greenland’s Ice Loss Revealed by Satellites
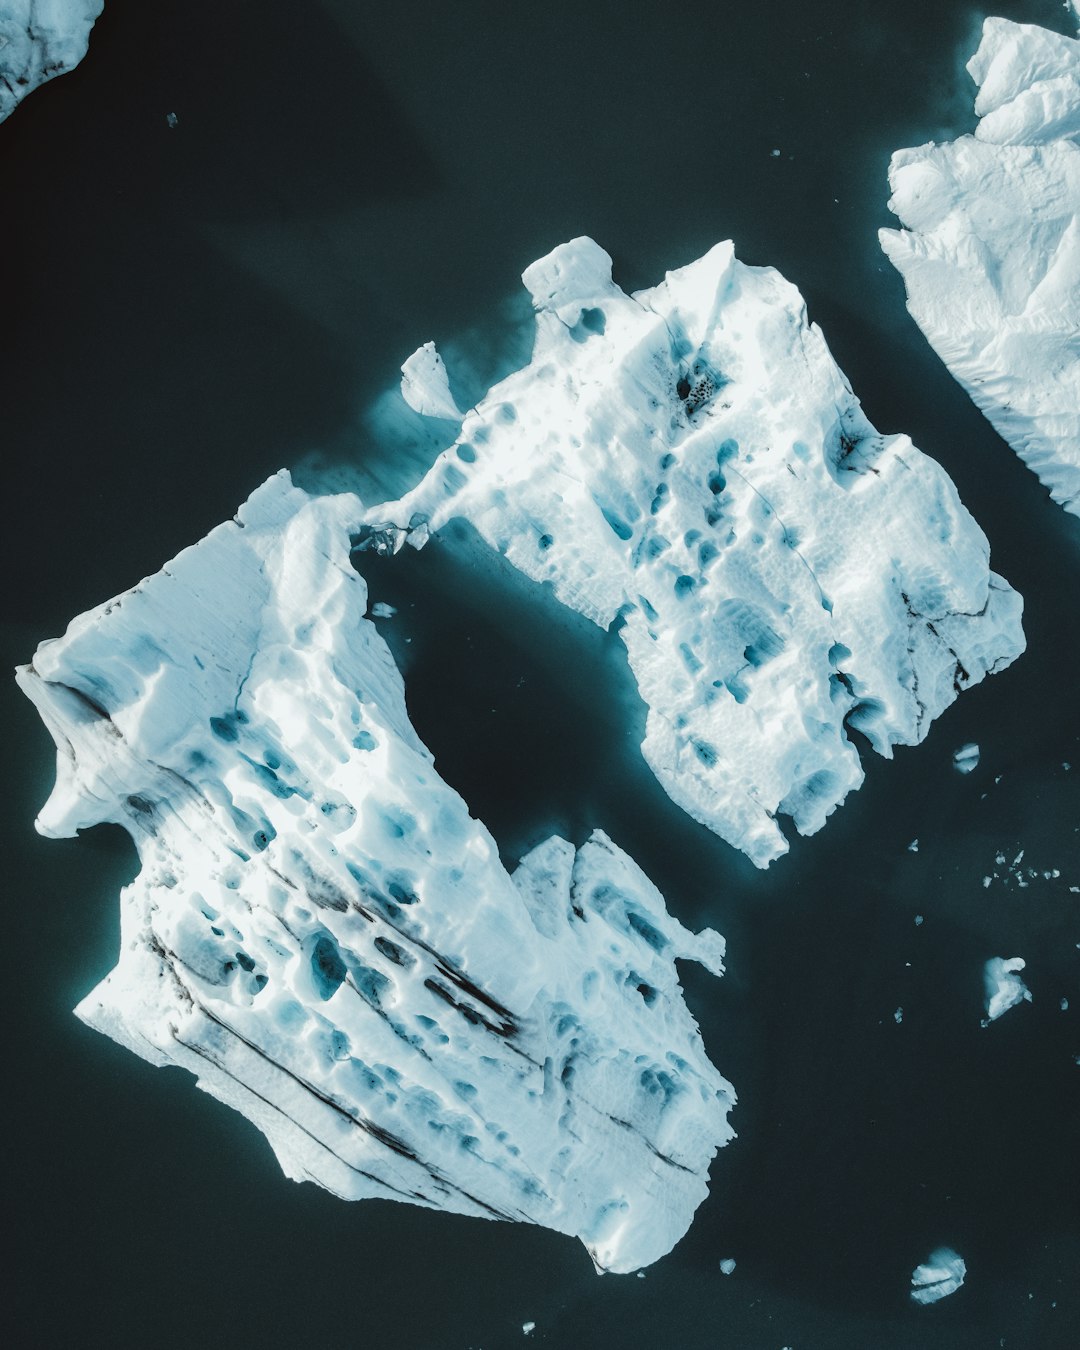
Between 2010 and 2023, the Greenland Ice Sheet thinned by 1.2 meters on average. However, thinning across the ice sheet’s margin (the ablation zone) was over five times larger, amounting to 6.4 meters on average. The most recent GRACE and GRACE-FO satellite data paint an alarming picture: between 2002 and 2023, Greenland shed approximately 280 gigatons of ice per year, causing global sea level to rise by 0.03 inches (0.8 millimeters) per year. What makes this loss particularly concerning is its acceleration – GRACE-FO data capture a record-high summer loss (600 Gt) in Greenland in 2019, representing an extraordinary single-year event that caught scientists off guard.
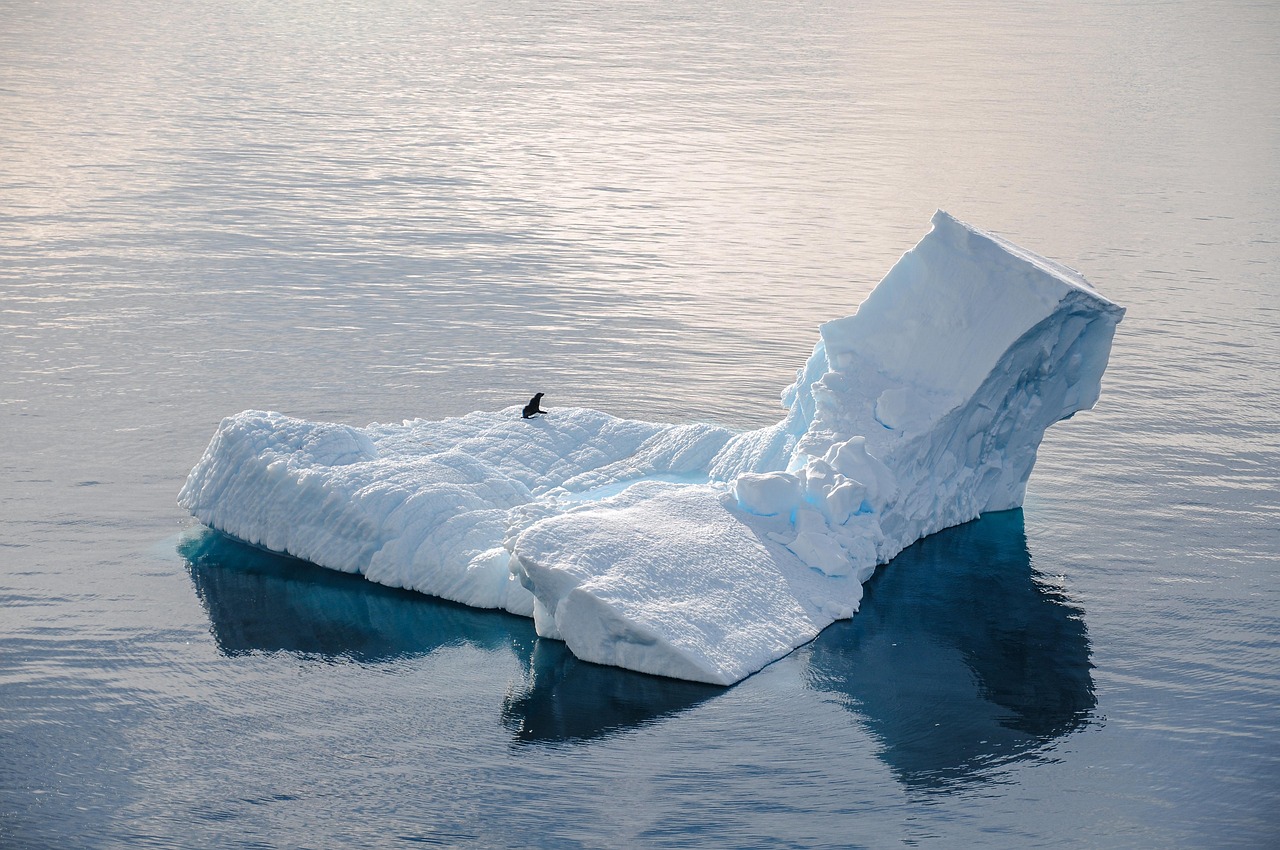
Antarctica’s Complex Ice Story Unfolds Through Satellite Eyes
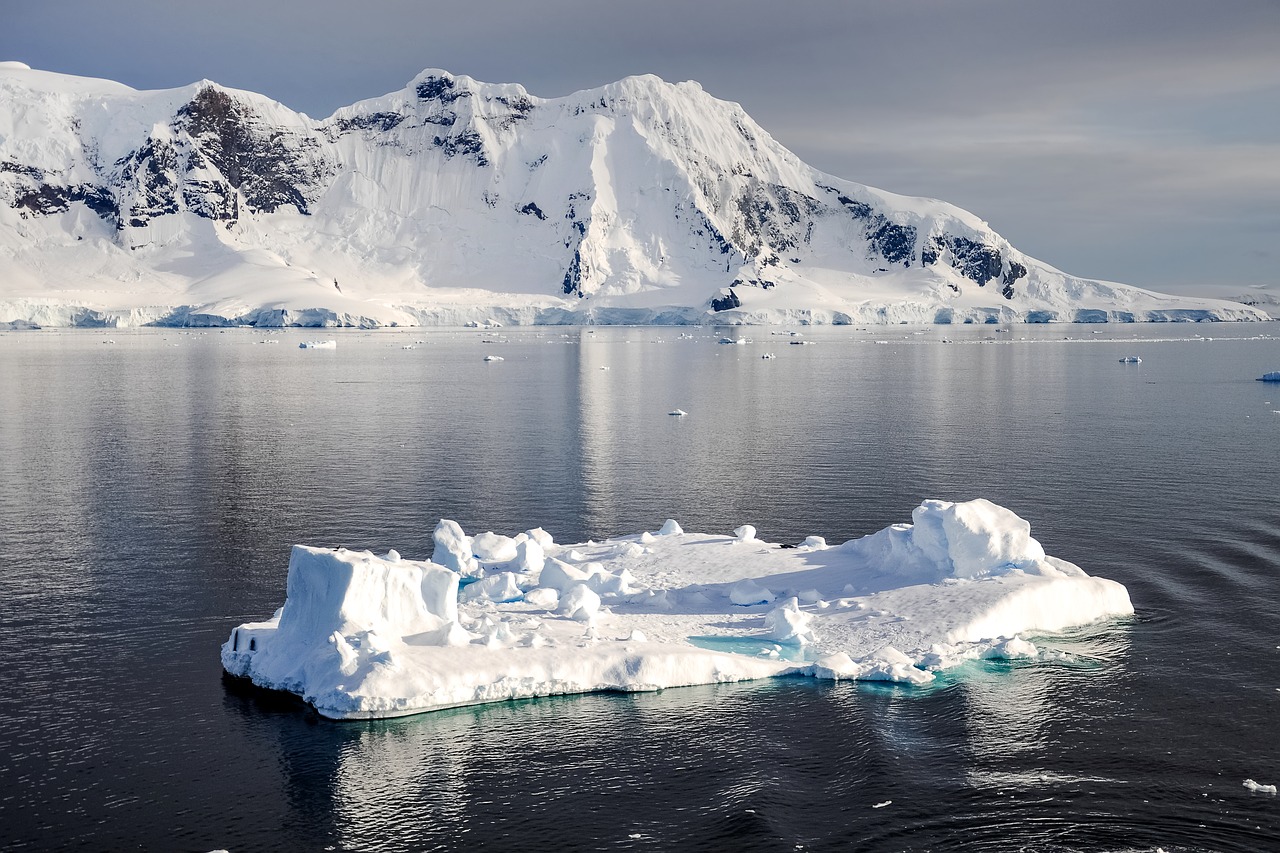
Antarctica presents a more complex narrative than Greenland’s straightforward decline. Between 2002 and 2023, Antarctica shed approximately 150 gigatons of ice per year, causing global sea level to rise by 0.4 millimeters per year. However, satellite data reveals fascinating regional variations: Areas in East Antarctica experienced modest amounts of mass gain due to increased snow accumulation. However, this gain is more than offset by significant ice mass loss on the West Antarctic Ice Sheet (dark red) over the 21-year period. Recent data from NASA satellites shows an unexpected twist – from 2021 to 2023, Antarctica gained some of that lost ice back, though this represents only a temporary reprieve in the continent’s overall decline.
How Gravity Satellites Actually “Weigh” Massive Ice Sheets
The GRACE satellite system operates on a remarkably elegant principle that seems almost magical in its simplicity. Measuring changes in the weight of the ice on Greenland and Antarctica, based on slight variations in the Earth’s gravitational field caused by changes in the density of the Earth’s crust and the amount of ice or water that may be piled on top of that crust. This technique uses a pair of satellites called the GRACE Mission, which launched in 2002. As water moves around the planet – flowing ocean currents, melting ice, falling rain and so on – it changes the gravitational pull ever so slightly. Scientists use the precise measurements of these variations to monitor Earth’s water reserves, including polar ice, global sea levels and groundwater availability.
Multiple Satellite Technologies Work Together for Complete Picture
Modern ice sheet monitoring relies on three primary satellite measurement techniques working in concert. Measuring the height of the ice sheet surface, relative to sea level. This technique is called altimetry and it typically uses radar or laser instruments. Scientists also use the “input-output” method, which combines various sources of information on ice accumulation (e.g., models of surface mass balance) and discharge into the ocean (e.g., based on radar, satellite images, and other data). The ICESat-2 instrumentation concept uses a low energy 532 nm (green) laser in conjunction with single-photon sensitive detectors to measure range. Combining ICESat-2 data with altimetry data collected since the start of the ICESat mission in 2003, such as Operation IceBridge and ESA’s CryoSat-2, will yield a 15 + year record of changes in ice sheet elevation and sea ice thickness.
Radar vs. Laser: Different Technologies Reveal Different Secrets
CryoSat-2 carries a radar system to determine the Earth’s surface height, while ICESat-2 has a laser system for the same task. Although radar signals can pass through clouds, they also penetrate into the ice sheet surface and have to be adjusted for this effect. Laser signals, on the other hand, reflect from the actual surface, but they cannot operate when clouds are present. This complementary relationship makes both technologies essential for comprehensive ice monitoring. The missions are therefore highly complementary, and combining their measurements has been a holy grail for polar science. The different penetration depths of radar and laser signals actually provide scientists with additional information about snow depth and ice properties that wouldn’t be available from either technology alone.
Satellite Data Reveals Alarming Acceleration in Ice Loss
The satellite record reveals a disturbing trend of accelerating ice loss that has surprised even seasoned glaciologists. The satellite data revealed that the sheet experienced a sustained period of ice loss between 2002 and 2020. The ice loss accelerated in the latter half of that period, increasing from an average loss of about 81 billion tons (74 billion metric tons) per year between 2002 and 2010, to a loss of about 157 billion tons (142 billion metric tons) between 2011 and 2020. For Greenland specifically, the smallest ice mass trends are for 1995–2000, 2000–2005, and 2015–2020 which are equal to +54.3, -15.5, and -75.9 Gt/year. The largest ice mass depletion periods took place in 2005–2010, 2010–2015, and recently in 2019–2021 with trends of -213.9, -287.2, and -276.1 Gt/year, respectively.
Stunning Visual Evidence from Space Shows Ice Sheet Changes
New time-lapse videos of Earth’s glaciers and ice sheets as seen from space – some spanning nearly 50 years – are providing scientists with new insights into how the planet’s frozen regions are changing. At a media briefing Dec. 9 at the annual meeting of the American Geophysical Union in San Francisco, scientists released new time series of images of Alaska, Greenland, and Antarctica using data from satellites including the NASA-U.S. Geological Survey Landsat missions. The visual evidence is striking: The Columbia Glacier, for example, was relatively stable when the first Landsat satellite launched 1972. But starting in the mid-1980s, the glacier’s front began retreating rapidly, and by 2019 was 12.4 miles (20 kilometers) upstream. These dramatic visual records provide compelling evidence of change that anyone can understand, transforming abstract data into tangible proof of our planet’s transformation.
Hidden Lakes Beneath Antarctic Ice Discovered by Satellites
Satellite technology has revealed surprising features hidden beneath Antarctica’s surface that were previously unknown to science. The Antarctic ice sheet experiences surface melt, but there are also lakes several meters below the surface, insulated by layers of snow. To see where these subsurface lakes are, Devon Dunmire of the University of Colorado, Boulder, used microwave radar images from the European Space Agency’s Sentinel-1 satellite. Snow and ice are basically invisible to microwave radiation, but liquid water strongly absorbs it. Dunmire’s new study, presented at the AGU meeting, found lakes dotting the George VI and Wilkins ice shelves near the Antarctic Peninsula – even a few that remained liquid throughout the winter months. These hidden lakes might be more common than scientists had thought, she said, noting that she is continuing to look for similar features across the continent’s ice shelves.
Satellite Missions Face Technical Challenges and Solar Storms
Even the most advanced satellite missions face unexpected challenges that can disrupt crucial climate monitoring. NASA’s ICESat-2 satellite resumed its science operations on June 21 after a period of inactivity due to solar storms in May that caused its height-measuring instrument, the Advanced Topographic Laser Altimeter System (ATLAS), to enter a safe hold. These storms generated unexpected drag on the spacecraft, prompting an automated response to protect the instrument, which resulted in the satellite drifting 3.7 miles (6 kilometers) down from its intended orbit. The GRACE mission also faced significant challenges – On 4 September, scientists lost contact with GRACE-2 after another of its battery cells stopped operating. Four days of feverish work followed, with scientists steeling themselves for the mission’s end. But finally, engineers bypassed the satellite’s flight software, successfully rebooting it.
Sea Level Rise Implications Measured From Orbit
The satellite measurements have profound implications for understanding future sea level rise, one of climate change’s most tangible threats to human civilization. Since 1992, Greenland and Antarctica have both lost ice overall, with Greenland losing an average of about 175 billion metric tons of ice per year and Antarctica losing more than 90 billion per year. The total amount of ice lost by Greenland and Antarctica from 1992 to 2020 was enough to raise sea level worldwide by an average of three-quarters of an inch or more. What’s particularly concerning is that meltwater coming from these ice sheets is responsible for about one-third of the global average rise in sea level since 1993. This means that satellite-monitored ice sheet changes are directly contributing to flooding threats faced by coastal communities worldwide.
Future of Satellite Ice Monitoring Looks Toward Enhanced Precision
The future of satellite-based ice sheet monitoring promises even greater precision and reliability through technological advances and international cooperation. This confirms that the satellites can be combined to produce a more reliable estimate of ice loss than either could achieve alone. It also means that if one mission were to fail, the other could be relied upon to maintain our record of polar ice change. Scientists are also developing new data processing techniques: Our new sea ice and lead classification approach shows great promise for improving sea surface height and sea ice freeboard retrievals from ICESat-2 and highlights the significant value of coincident satellite imagery for classification training and validation. The continuity of these measurements is crucial because ice sheets naturally fluctuate with seasonal variations in temperature, precipitation, and other factors. The NASA JPL data points show these types of seasonal patterns, particularly for Greenland.
Global Impact of Satellite-Measured Ice Changes
The satellite data reveals that ice sheet changes measured from space have far-reaching consequences beyond simple sea level rise. Melting ice sheets in Greenland and Antarctica are pouring water into the oceans and adding to sea level rise. But the lost ice also means lost gravity – and so sea levels in the immediate vicinity of the ice sheets actually drop, while ocean levels half a world away are goosed. The dynamic, called sea level fingerprints, had wide acceptance in the field, but GRACE provided the first direct confirmation that it was happening. This phenomenon means that ice loss measured by satellites in Greenland actually causes more dramatic sea level rise in places like Florida and Southeast Asia than in areas closer to the ice sheets themselves. The global nature of these impacts underscores why satellite monitoring from space is essential – only from orbit can we see the full planetary-scale consequences of ice sheet changes that affect every coastal region on Earth.