


Every year, IQAir releases its World Air Quality Report, and every year it delivers the kind of numbers that are hard to sit with. Released in March 2026, the 8th annual edition analyzed data from monitoring stations across 9,446 cities in 143 countries, regions, and territories, offering a comprehensive picture of global air pollution in 2025. The methodology is based on PM2.5, the fine particulate matter small enough to penetrate deep into the lungs and enter the bloodstream.
Air pollution worsened in 2025, with the share of cities globally that met the World Health Organisation’s guideline of safe air quality falling to 14% from 17% the previous year. Comparing this year’s report to the previous year, 54 countries experienced increases in annual average PM2.5, 75 saw declines, two remained unchanged, and 12 were newly represented in this year’s dataset. The picture is uneven and, in many places, bleak.
1. Pakistan: The World’s Most Polluted Country in 2025
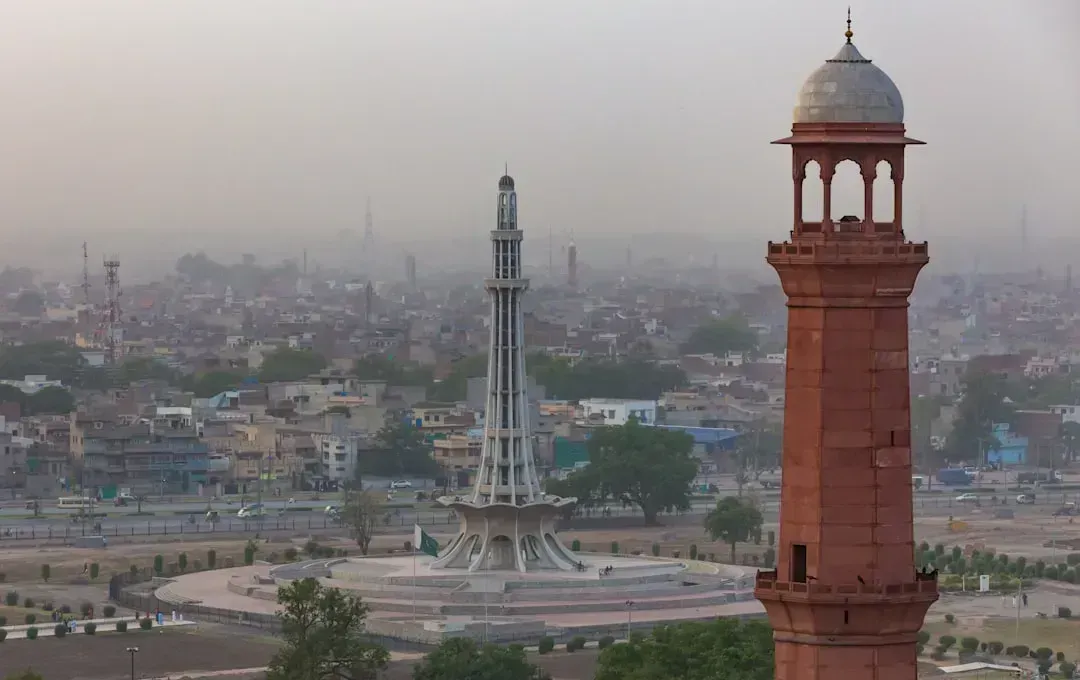
Pakistan was ranked the world’s smoggiest country in 2025, with concentrations of hazardous small particles known as PM2.5 up to 13 times higher than the recommended World Health Organization level. Pakistan recorded an annual average of 67.3 µg/m³, a year-over-year decline of 6.4 points, though that modest improvement does nothing to change the fact that the air remains profoundly dangerous for the tens of millions who breathe it daily.
Winter temperature inversions, industrial emissions, traffic congestion, brick kilns, and agricultural residue burning significantly elevated PM2.5 concentrations. Air quality remained poor for extended periods, particularly in densely populated urban centres, placing Pakistan firmly in the high-risk exposure category in 2025. In Lahore alone, 14 million residents regularly experience thick smog due to seasonal crop burning in Punjab Province, heavy vehicular emissions, and widespread pollution from brick kilns.
2. Bangladesh: Dense Urbanization and Relentless Smog
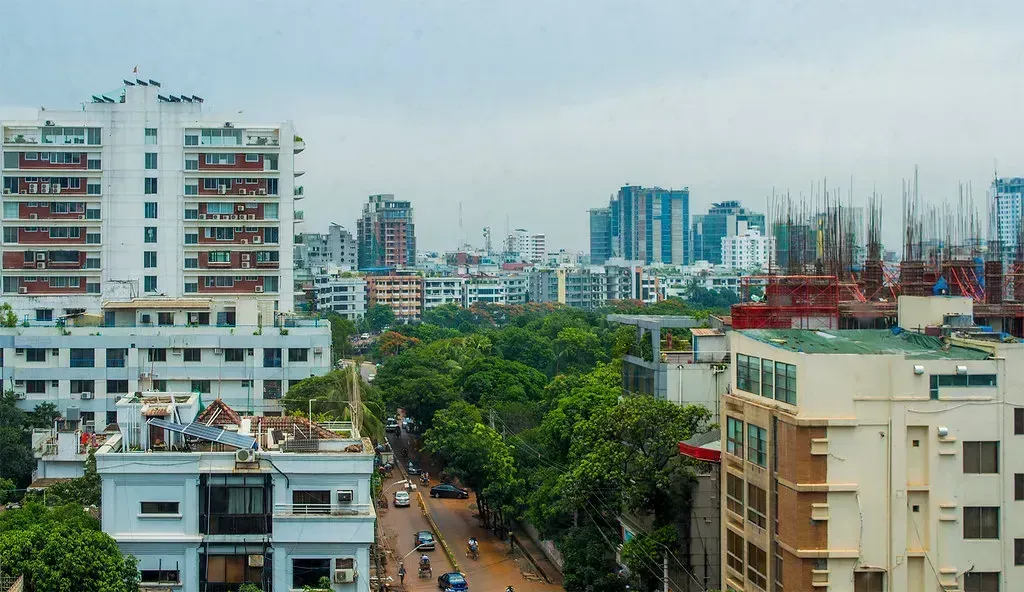
Bangladesh followed closely at 66.1 µg/m³, reflecting severe air quality conditions across the region. Bangladesh’s air quality remained consistently unhealthy, with dense urbanisation, brick kilns, vehicular emissions, construction dust, and transboundary pollution contributing to elevated PM2.5 levels. Despite being a slight improvement over the previous year’s figure, the annual average still places Bangladesh more than thirteen times above the WHO safe threshold.
South Asia remains the world’s most polluted region. Not only are Pakistan, Bangladesh, and India ranked 1st, 2nd, and 6th as countries, but 83 cities from these three countries as well as Nepal are among the 100 most polluted cities in the world. The concentration of pollution across this subregion reflects shared structural problems: rapid urbanization, inadequate waste infrastructure, and a heavy reliance on biomass burning for domestic energy.
3. Tajikistan: Central Asia’s Air Crisis in the Spotlight
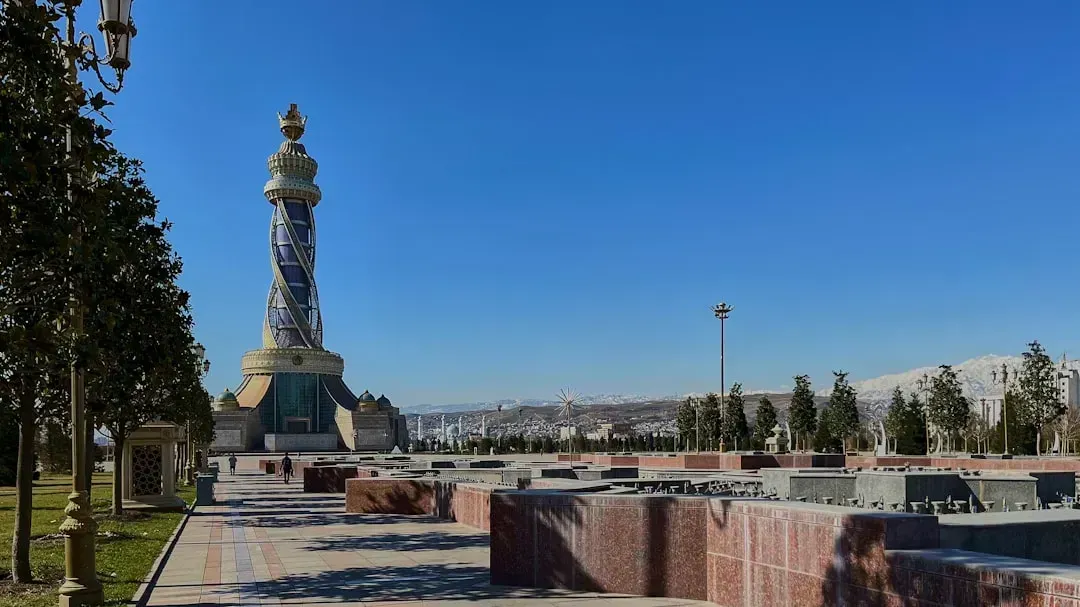
Tajikistan ranked third, with an annual average PM2.5 of 57.3 µg/m³. That figure represents an increase of 11.0 µg/m³ year over year, making Tajikistan one of the countries where air quality actually deteriorated significantly in 2025 rather than improved. The capital Dushanbe sits in a valley surrounded by mountains, a topography that traps pollutants close to ground level during cold months.
Home-heating reliance on coal and wood during the harsh Central Asian winters drives a large portion of the particulate burden. Central and South Asia continued to dominate the rankings of the most polluted regions, with Pakistan, Bangladesh, and India recording hazardous annual averages, and Tajikistan’s sharp rise into third place signals that the crisis is spreading westward through Central Asia as well. Monitoring coverage in this part of the world remains limited, so the true picture may be even more serious.
4. Chad: A Saharan Dust Belt and a Monitoring Data Gap
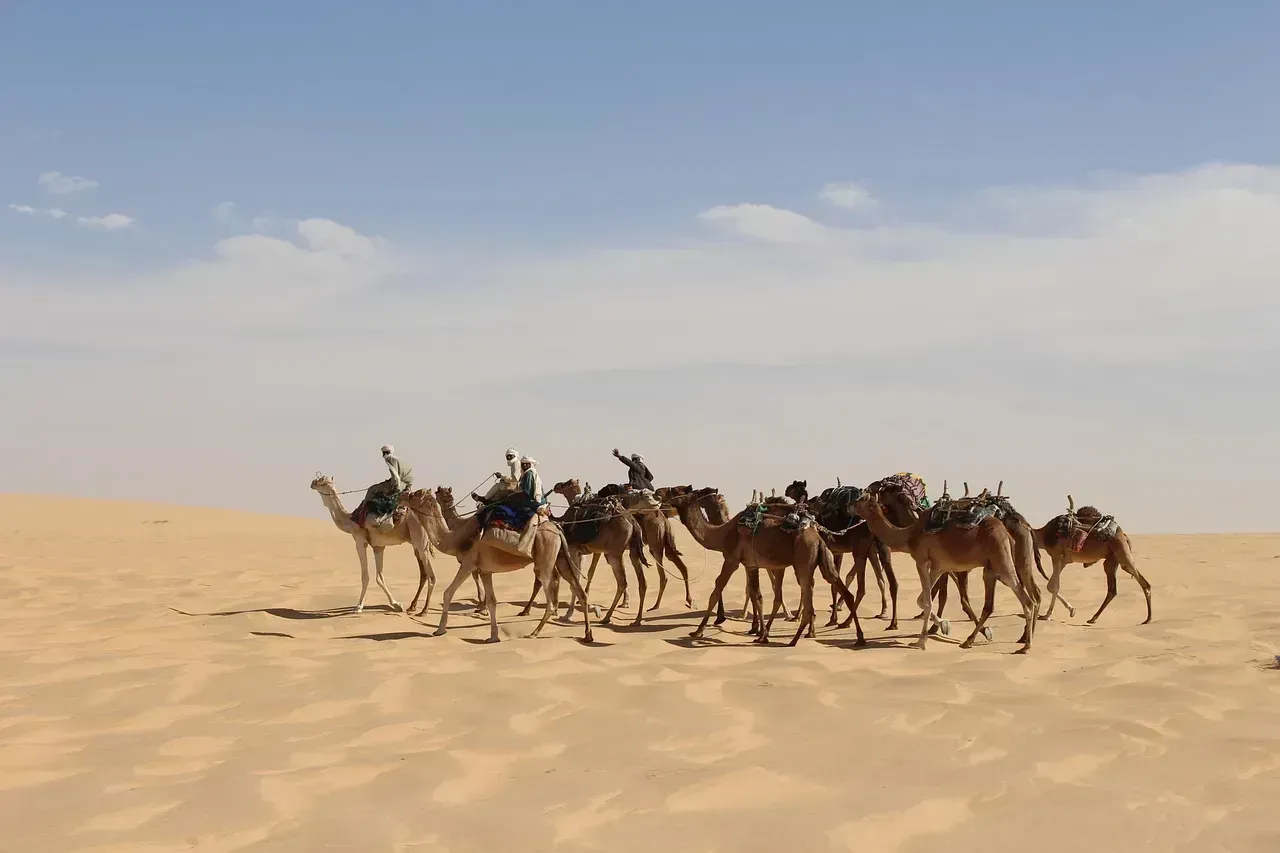
Chad recorded an annual average PM2.5 of 53.6 µg/m³, ranking it fourth among the world’s most polluted countries in 2025. That number actually represents a dramatic drop from the previous year, when Chad had topped the global rankings. Chad, statistically the smoggiest country of 2024, ranked fourth in 2025, but the decline in PM2.5 concentrations is likely to be the result of data gaps rather than genuine improvement.
The largest improvements in average annual air pollution between 2024 and 2025 were recorded in African countries, with Chad dropping by 38.2 points to 53.6 µg/m³, a change so large it raises more questions than it answers. Natural dust from the Sahara and Sahel is a primary driver of particulate pollution in the region, compounding the effects of open burning, deforestation, and minimal industrial regulation. Data coverage in Africa expanded significantly in 2025, with Chad and DR Congo remaining among the most polluted.
5. Democratic Republic of the Congo: Biomass Burning and Forest Fires
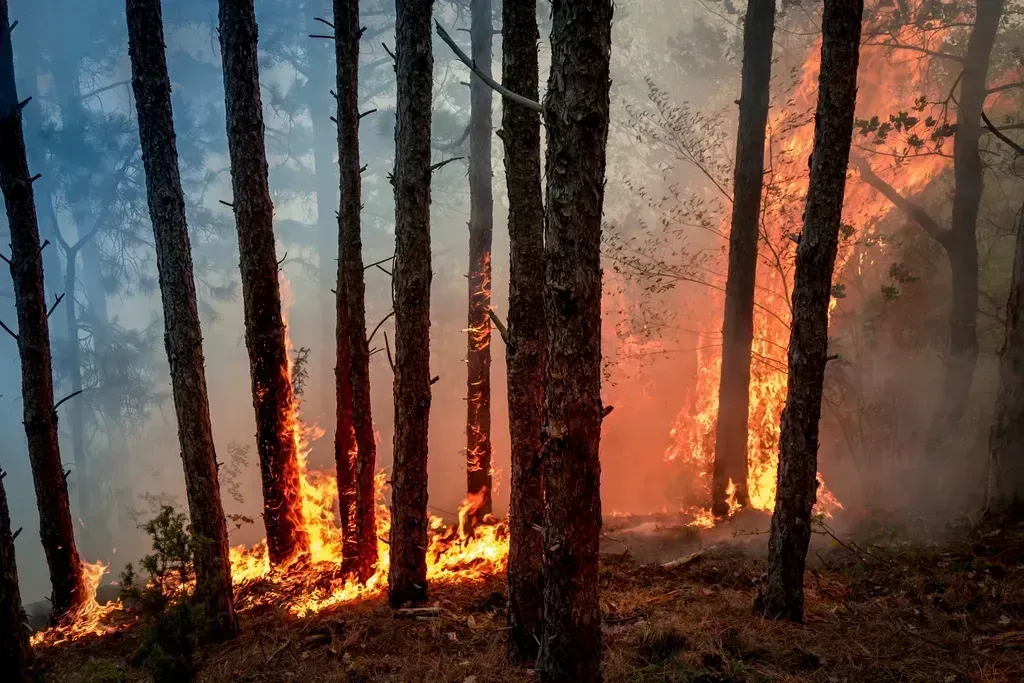
The Democratic Republic of the Congo recorded an annual average PM2.5 of 50.2 µg/m³, placing it fifth on the global ranking. Known air pollution sources include indoor cooking with wood and charcoal, forest fires, and regional agricultural and industrial activities. With a population of nearly 100 million spread across a vast country and limited monitoring infrastructure, the DRC’s pollution burden is almost certainly underestimated.
As is too often the case throughout much of the continent, both Chad and the DRC lack comprehensive air quality monitoring. While some monitoring exists in the DRC, many more reliable and consistently operating stations are needed to help measure poor air quality affecting millions of people in the vast nation. The IQAir report consistently flags this monitoring gap as a structural challenge across sub-Saharan Africa, where the absence of data does not mean the absence of pollution.
6. India: Sixth Place, Still a Staggering Crisis
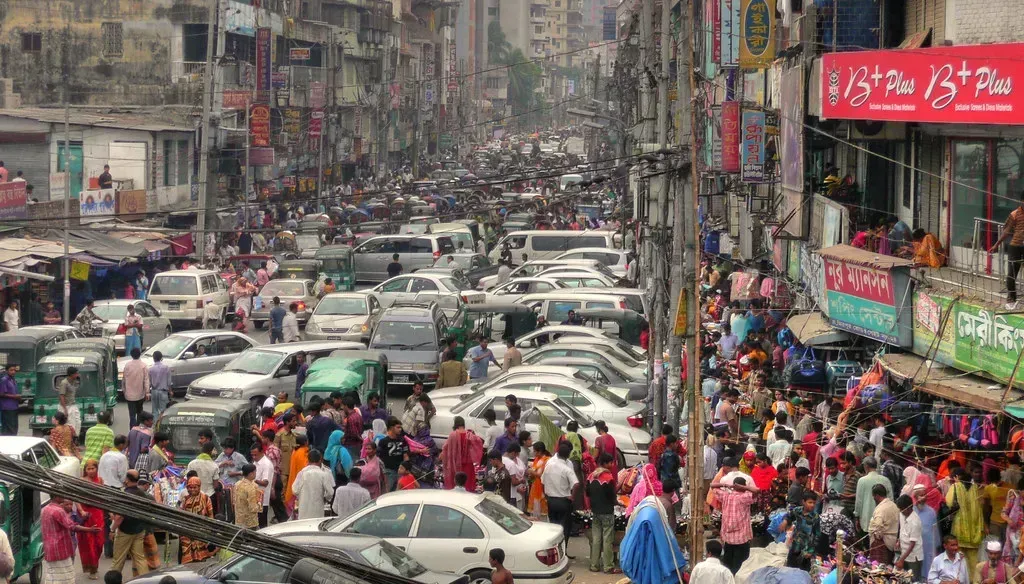
India dropped out of the top five for the first time since the rankings began eight years ago. Its average PM2.5 level dipped by 3% to below 50 µg/m³ as an annual average across the country, still nearly 10 times the WHO’s recommended annual average. India’s average PM2.5 concentration in 2025 was 48.9 µg/m³, equivalent to an AQI of 134, classified as “unhealthy for sensitive groups.”
Delhi, home to over 30 million people, remains the world’s most polluted capital. Its average PM2.5 was 99.6 micrograms, 20 times the WHO’s safe guideline of 5. India’s capital saw rare public protests in November 2025 when the daily average pollution peaked near 460 micrograms of PM2.5, fueled by seasonal crop burning, vehicular emissions, and stagnant winter air, with the poor air quality corresponding to a rise in hospital patients dealing with asthma, cardiac issues, and difficulty breathing.
7. Kuwait: Desert Dust and a Sharp Deterioration
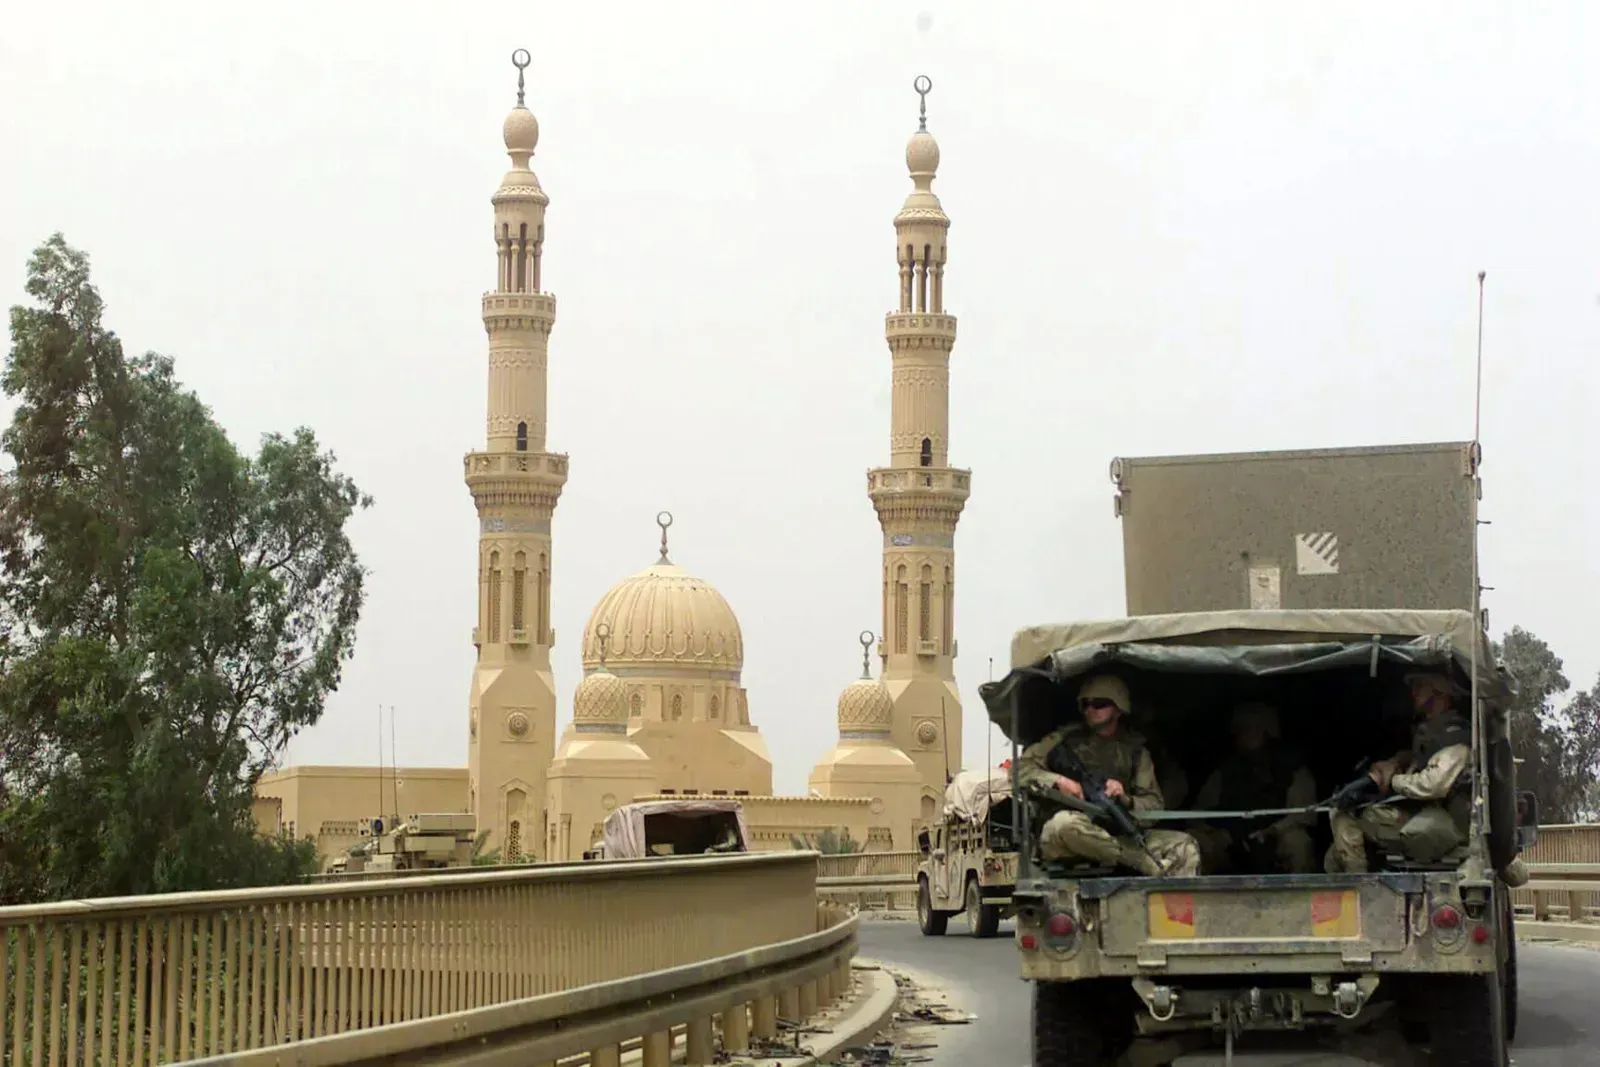
Kuwait recorded one of the sharpest deteriorations in air quality in 2025, with PM2.5 rising by 15.5 points to reach 45.7 µg/m³. That increase placed Kuwait among the countries with the fastest-worsening air in the world over a single year. Dust is a major component of fine particulate matter in arid regions, meaning that countries like Kuwait routinely exceed air quality standards even without accounting for industrial output.
Bahrain recorded unhealthy air quality throughout much of the year, largely influenced by industrial emissions, oil-related activities, traffic density, and regional dust events. Limited urban dispersion due to climatic conditions further intensified pollution levels, resulting in one of the highest average AQI values in the Middle East in 2025. Kuwait faces a similar set of compounding factors, with oil industry operations, heavy vehicle traffic, and frequent sandstorms all contributing to the region’s deteriorating air.
8. Uzbekistan: A Rising Central Asian Concern
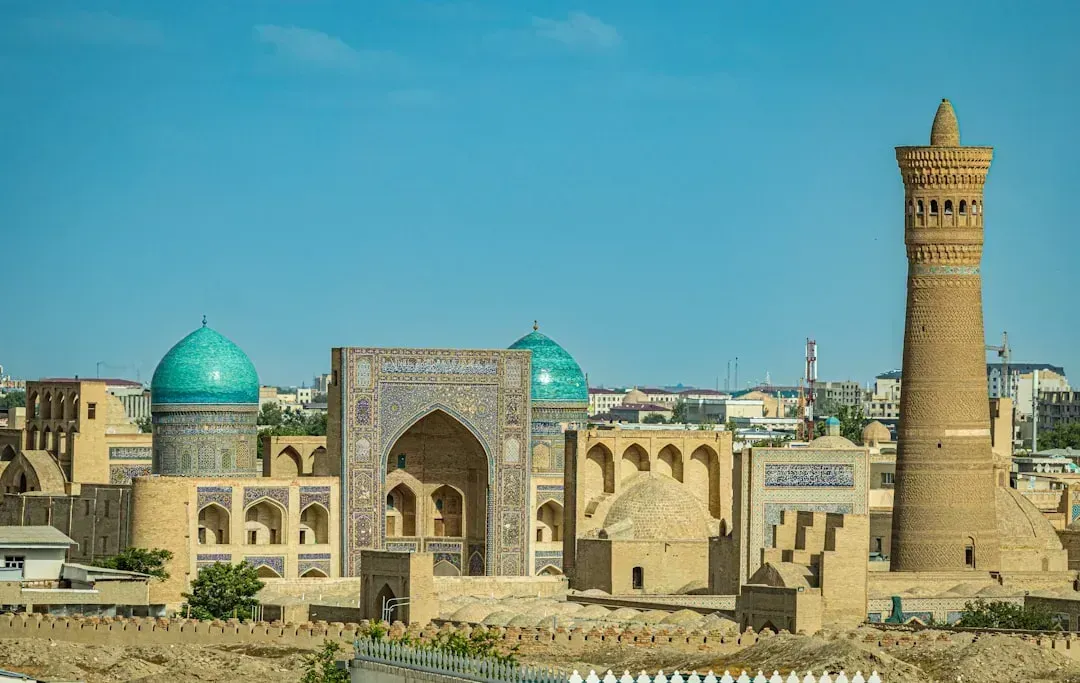
Uzbekistan saw its PM2.5 rise by 6.7 points in 2025, reaching 38.1 µg/m³. The country sits in one of the most landlocked parts of the world, a geography that limits natural wind dispersal of pollutants. Rapid urban growth in cities like Tashkent, combined with aging vehicle fleets and widespread coal use for heating, has created a steadily worsening air quality trend that the 2025 data now reflects clearly.
The broader Central Asian region, which includes Tajikistan and neighboring Kyrgyzstan, is emerging as a new pollution hotspot in global rankings. Kyrgyzstan also recorded a significant deterioration, with PM2.5 rising by 8.6 points to 29.7 µg/m³. Limited regulatory enforcement, a cold climate that encourages heavy fuel combustion, and minimal green energy infrastructure all point to a problem that is likely to deepen before it improves.
9. China: Westward Shift and Persistent Urban Pollution
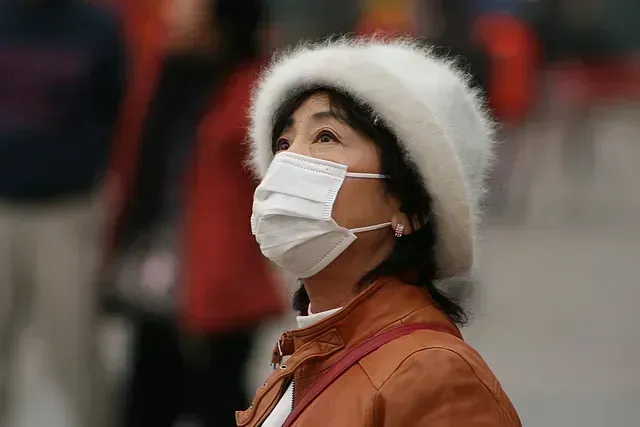
China saw a slight decline in its national PM2.5 average to 29.6 µg/m³, but a geographic shift is pushing pollution west due to industrial relocation. 2025 marked the second consecutive year in which no cities in East Asia met WHO PM2.5 guidelines. While China’s headline average has improved compared to its peak years, the internal redistribution of heavy industry toward less-monitored western provinces is complicating the picture.
The world’s 25 most polluted cities were all located in India, Pakistan, and China, with India home to three of the four most polluted. China’s ongoing reliance on coal for electricity generation and its enormous industrial base mean the country still contributes a significant portion of global PM2.5 output, even as coastal megacities like Beijing and Shanghai have shown some measured improvement in recent years.
10. Canada: Wildfires Rewrote the Map in North America
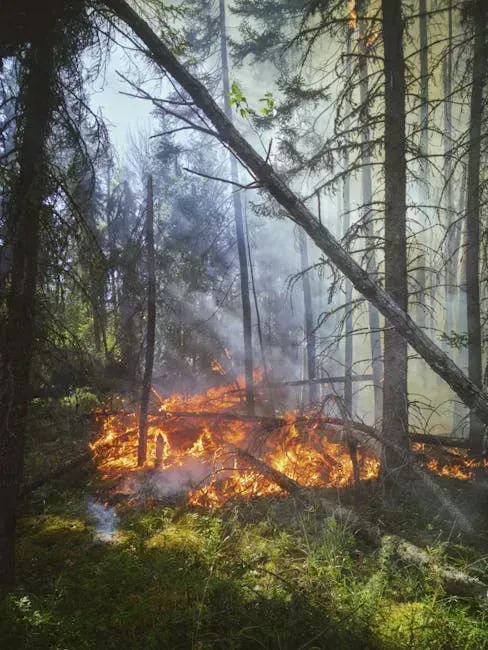
Canada was the most polluted country in Northern America for just the second time in this report’s eight-year history, as its second-worst wildfire season on record affected air quality across Canada, the United States, and parts of Europe. This is not pollution in the traditional industrial sense. Canada’s average PM2.5 is nowhere near the levels seen in South Asia, but 2025 demonstrated how wildfire smoke can rapidly and dramatically degrade air quality across entire continents.
Wildfires, intensified by climate change, played a major role in degrading global air quality in 2025. Record biomass emissions from Europe and Canada contributed to approximately 1,380 megatons of carbon. In the United States, annual average PM2.5 levels increased to 7.3 µg/m³. Smoke from wildfires in both Canada and the U.S. raised averages across parts of the Great Lakes states in the summer and in the Pacific Northwest in the fall.
11. Vietnam: A Southeast Asian City Trending the Wrong Way
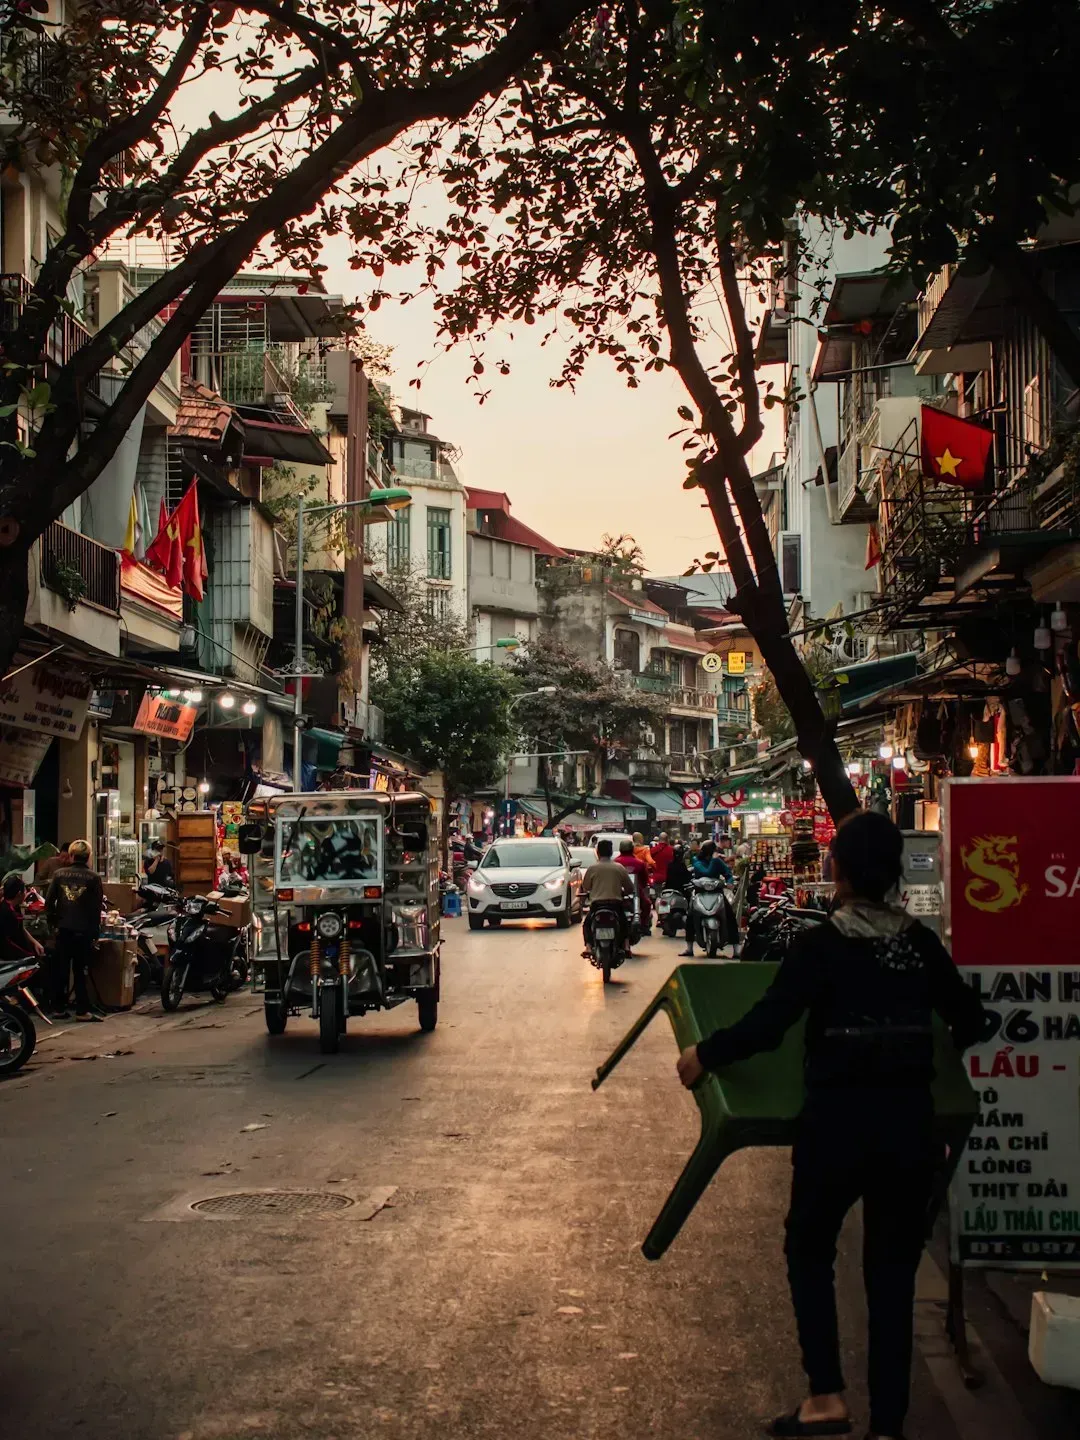
Vietnam continued to deteriorate in 2025, with Hanoi recording its sixth consecutive year of rising pollution. While Vietnam’s national average does not yet place it at the very top of global rankings, the consistent year-over-year worsening of its air quality stands out as a warning sign in a region where several neighboring countries have begun to see improvements. Rapid industrialization, a surge in private vehicle ownership, and coal-fired power plants are the primary drivers.
Indonesia had the highest regional average in Southeast Asia at 30 µg/m³ but saw a 16% improvement in 2025. Vietnam’s trajectory stands in contrast to that trend. Thailand passed the Clean Air Act in 2025, introducing a “polluter pays” principle, a policy signal that the region is beginning to move, even if unevenly, toward accountability for emissions. Vietnam, for now, has yet to close the gap.
