
The 1970s were not, at first glance, a glamorous decade for science. There were no moonshots, no headline-grabbing robot landings on distant planets. Instead, the most consequential scientific work of that era happened in quiet labs, in the bitter cold of Antarctica, and on a remote Hawaiian volcano – places most people would never visit or even think about. The discoveries made in those locations changed our understanding of the planet in ways we’re still reckoning with today.
What makes this era remarkable is how scattered the work was. No single institution had a monopoly. In the 1960s and 1970s, worries about climate change helped push diverse scientific fields into contact, and scientists interested in climate change kept their identification with different disciplines but developed ways to communicate across the boundaries. The result was a decade of breakthroughs that emerged from a loosely connected web of laboratories, ice sheets, and monitoring stations spanning both hemispheres.
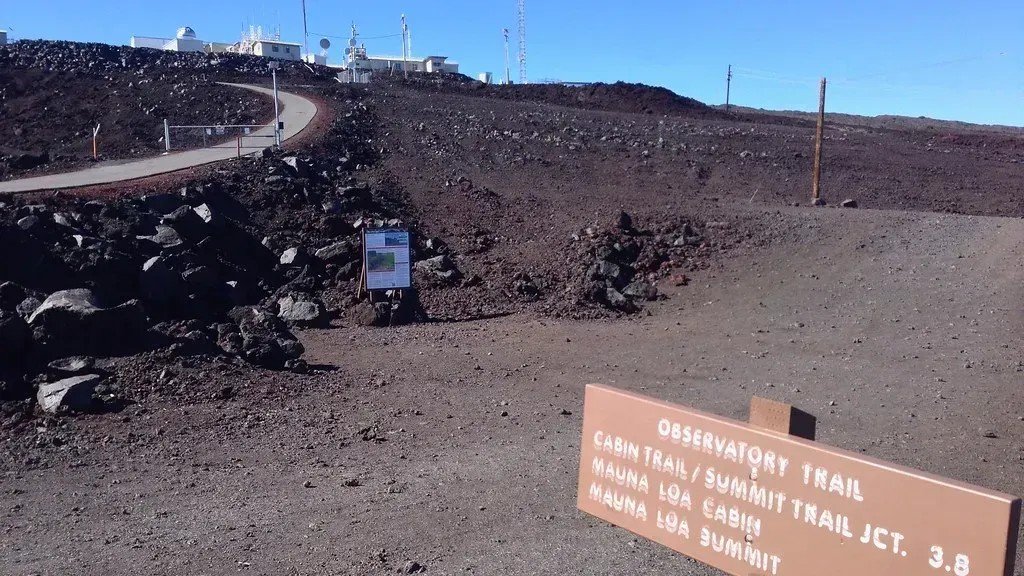
Mauna Loa Observatory, Hawaii: The Mountain That Proved CO2 Was Rising
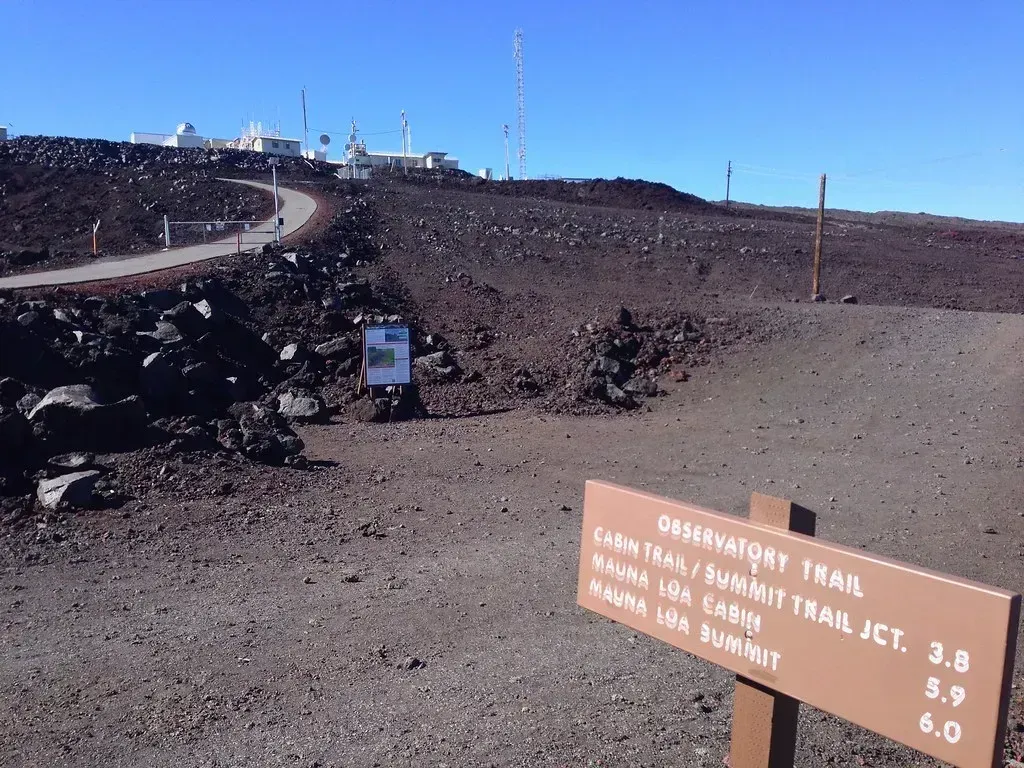
The Mauna Loa Record is a significant and continuous measure of atmospheric CO2 levels, collected since 1958 at the Mauna Loa Observatory in Hawaii. This record is crucial for understanding climate change, as CO2 levels are a primary factor influencing global temperatures. By the 1970s, the data stream coming off that Hawaiian volcano had become indispensable. By the 1970s, it was well established that the increase of atmospheric carbon dioxide was ongoing and due to anthropogenic emissions.
Mauna Loa was chosen as a long-term monitoring site due to its remote location far from continents and its lack of vegetation. Keeling and his collaborators measured the incoming ocean breeze above the thermal inversion layer to minimize local contamination from volcanic vents. The site’s isolation was a feature, not a flaw. Measurements were started by C. David Keeling of the Scripps Institution of Oceanography in March of 1958, and NOAA started its own CO2 measurements in May of 1974, running in parallel with those made by Scripps since then. That redundancy meant the data could withstand scrutiny from all directions.
NOAA’s Geophysical Fluid Dynamics Laboratory, Princeton, New Jersey: Where Numbers Became Climate
Princeton’s history with climate modeling started more than half a century ago, with a remarkable partnership between the university and a national lab housed on Princeton’s Forrestal Campus. The Geophysical Fluid Dynamics Laboratory formed a collaboration with Princeton University in 1967 and moved to New Jersey in 1968 to take advantage of the university’s leadership in early computing and the proximity of the Institute for Advanced Study. The proximity to Princeton proved decisive. The computing power and intellectual infrastructure available there allowed scientists to run simulations that simply weren’t possible elsewhere.
By the 1970s, general circulation models emerged as a central tool in climate research. Dr. Manabe and Dick Wetherald later used the original model to simulate the first three-dimensional experiment to test the notion of global warming, and their groundbreaking results were published in 1975. Princeton-GFDL luminary Syukuro Manabe produced a series of studies widely attributed with launching the long-term study of global climate warming and quantitatively linking the warming of Earth’s climate with increasing carbon dioxide emissions. These weren’t theoretical exercises. They were the first credible numbers anyone had ever put to the problem.
University of California, Irvine: The Lab That Saved the Ozone Layer
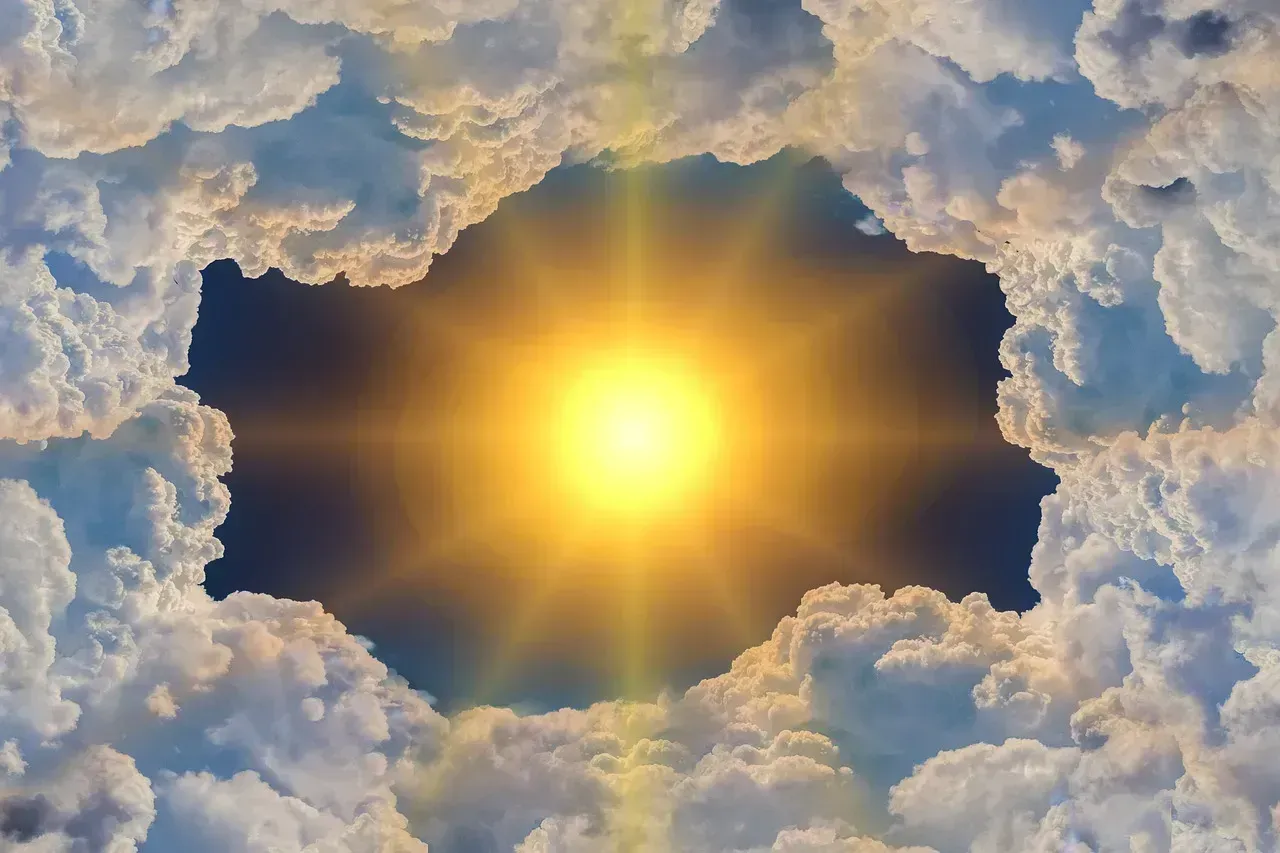
It was research conducted at the University of California, Irvine in the 1970s that made the eventual recovery of the ozone layer possible. Chemistry professor F. Sherwood Rowland and postdoctoral student Mario Molina made a shocking discovery: a single chlorine atom byproduct from aerosol hairsprays, deodorants, and other popular consumer products could destroy 100,000 ozone atoms in the stratosphere. The stratospheric ozone layer, 12 to 30 miles above Earth, protects life on the planet from harsh solar radiation.
The next leap in the understanding of ozone chemistry came in 1974, when Mario Molina and Sherwood Rowland published their widely noted Nature article on the threat to the ozone layer from chlorofluorocarbon gases – “freons” – used in spray bottles, as the cooling medium in refrigerators and elsewhere, and in plastic foams. The industry response was fierce. In 1976, the United States National Academy of Sciences released a report concluding that the ozone depletion hypothesis was strongly supported by the scientific evidence, and scientists calculated that if CFC production continued to increase at the going rate, CFCs would cause a global ozone loss of 5 to 7 percent by 1995 and a 30 to 50 percent loss by 2050.
Vostok Station, East Antarctica: Ice as a Time Machine
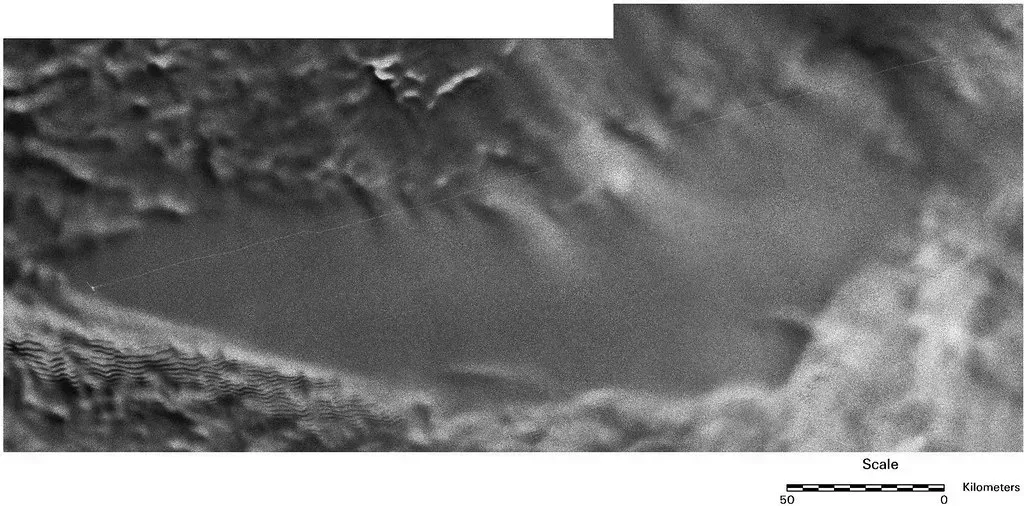
The Vostok ice core project is a collaborative effort between Russian, French, and American scientists that began in the 1970s. The project aimed to extract ice cores from the Vostok Station, which is one of the coldest and most remote locations on Earth. Vostok sits at roughly 78 degrees south, deep in the East Antarctic interior, where average temperatures hover around minus 55 degrees Celsius. Working there was – and still is – a logistical feat of the highest order.
Drilling in the Antarctic focused mostly on Mirny and Vostok, with a series of deep holes at Vostok begun in 1970. The first deep hole at Vostok reached 506.9 meters in April 1970; by 1973 a depth of 952 meters had been reached. A subsequent hole, Vostok 2, drilled from 1971 to 1976, reached 450 meters. Every meter of ice retrieved was a page of planetary history, preserving ancient air bubbles that carried a direct record of past atmospheric composition. Atmospheric concentrations of carbon dioxide and methane correlate well with Antarctic air temperature throughout the record, and present-day atmospheric burdens of these two important greenhouse gases seem to have been unprecedented during the past 420,000 years.
Greenland Ice Sheet: A Second Frozen Archive Opens Up
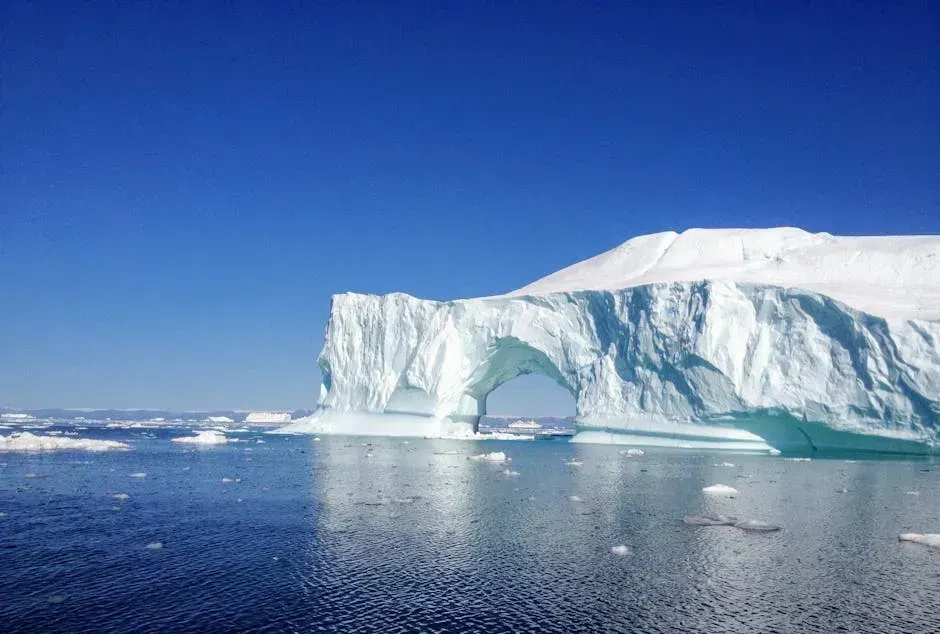
In 1970, scientific discussions began that resulted in the Greenland Ice Sheet Project, a multinational investigation into the Greenland ice sheet that lasted until 1981. Years of field work were required to determine the ideal location for a deep core, including several intermediate-depth cores at Dye 3, Milcent, and Crete, among others. What Greenland offered was something Antarctica couldn’t: a Northern Hemisphere perspective on how climate had shifted during periods when human civilizations were actually forming and growing.
To pry climate clues out of the ice, scientists began to drill long cores out of the ice sheets in Greenland and Antarctica in the late 1960s. The data emerging from Greenland in the 1970s dovetailed with what Soviet and French teams were pulling from the south, creating a two-hemisphere picture that no single site could provide on its own. New evidence from ice and sediment cores showed that the idea of only slow climate change was wrong. Earth’s climate had indeed changed rapidly in the past, in some cases within mere decades, and understanding that climate could change in human lifetimes made it a much more compelling research topic.
Woods Hole, Massachusetts: Where Scientists Agreed on What the Numbers Meant
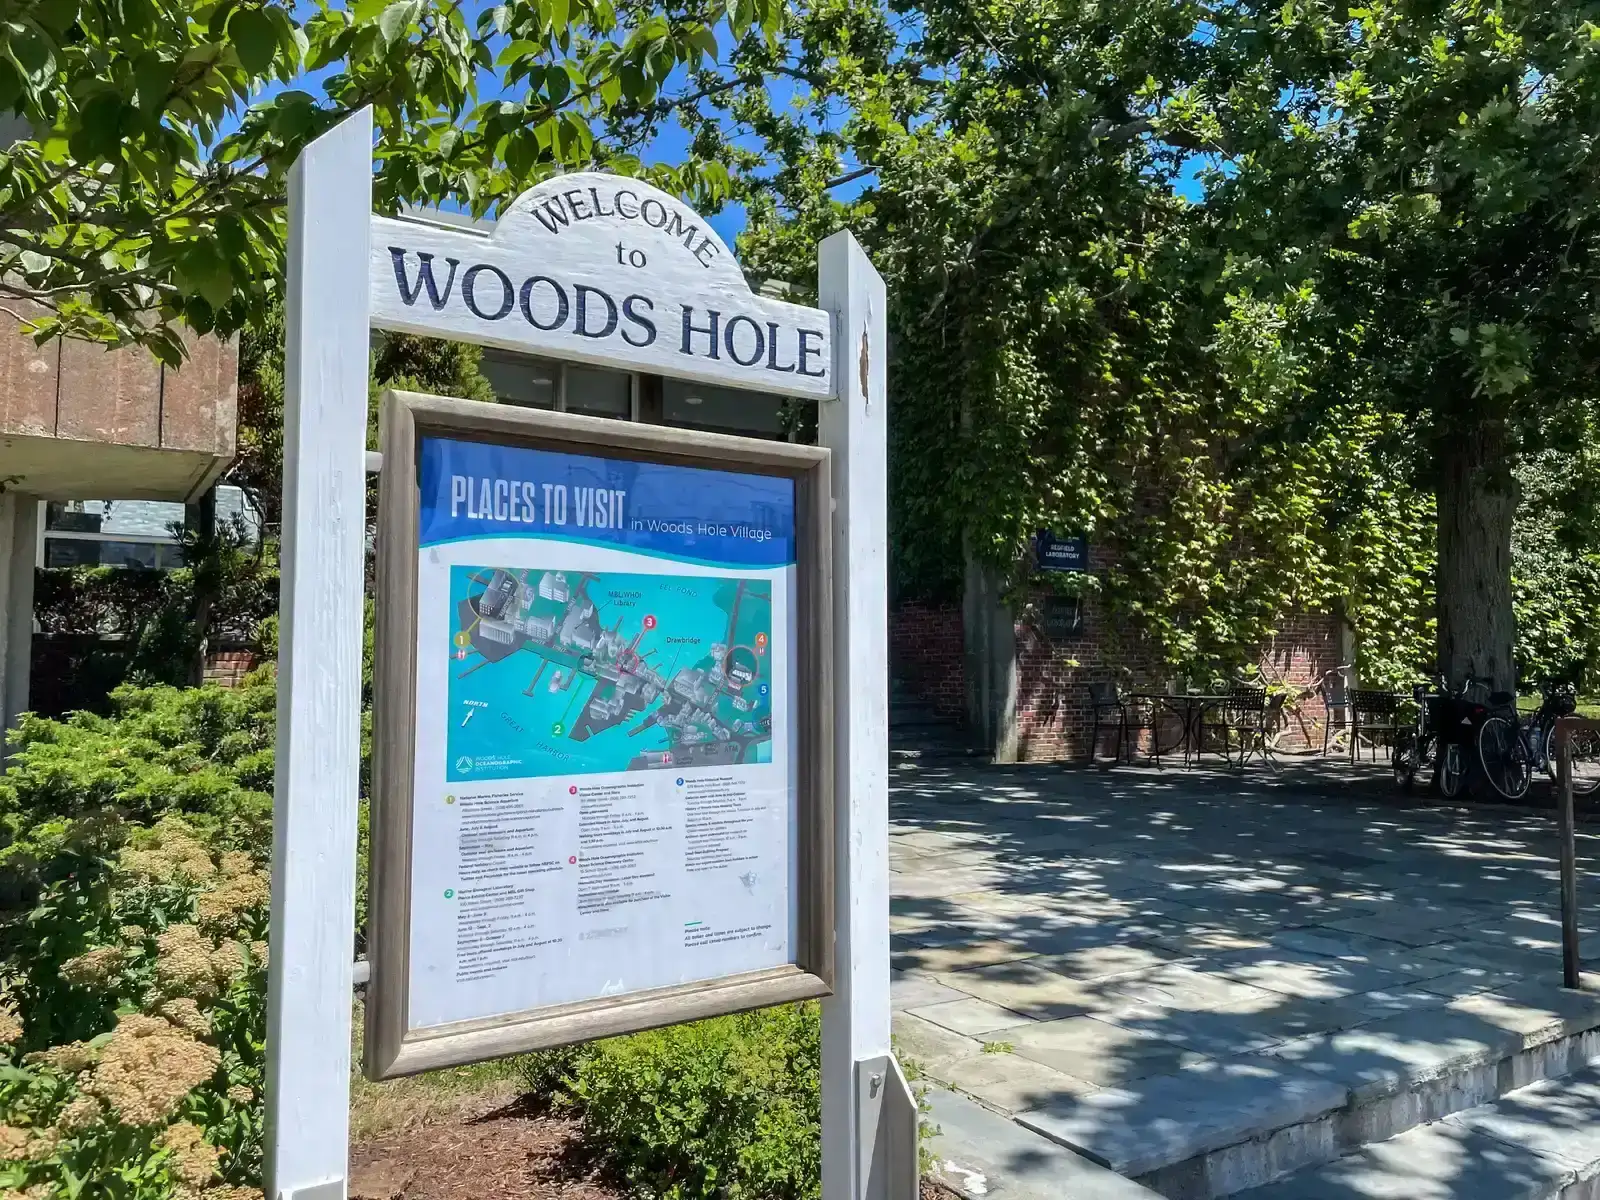
On July 23, 1979, nine scientists met in Woods Hole on the Massachusetts coast, where the National Academy of Sciences has a conference center. Also present as observers were members of various federal agencies and staff of the National Research Council. After working together from July 23 to July 27 and continuing to exchange ideas in the following weeks, the group produced a 22-page report entitled Carbon Dioxide and Climate: A Scientific Assessment. The location was practical – a small conference center on Cape Cod – but the conversation that happened there was anything but ordinary.
Jule Charney decided to evaluate not only the JASON committee’s model but also the more advanced three-dimensional general circulation models of Syukuro Manabe from NOAA’s Geophysical Fluid Dynamics Laboratory and James E. Hansen from NASA’s Goddard Institute for Space Studies. The first model estimated equilibrium climate sensitivity between 2 and 3 degrees Celsius, while the second model estimated values close to 4 degrees Celsius. Despite advances in scientific knowledge, their estimated equilibrium climate sensitivity of 3 degrees Celsius has remained largely unchallenged, with only minor refinements, over the ensuing forty years. That’s a remarkable durability for any scientific estimate.
Scripps Institution of Oceanography, La Jolla, California: Expanding the Network
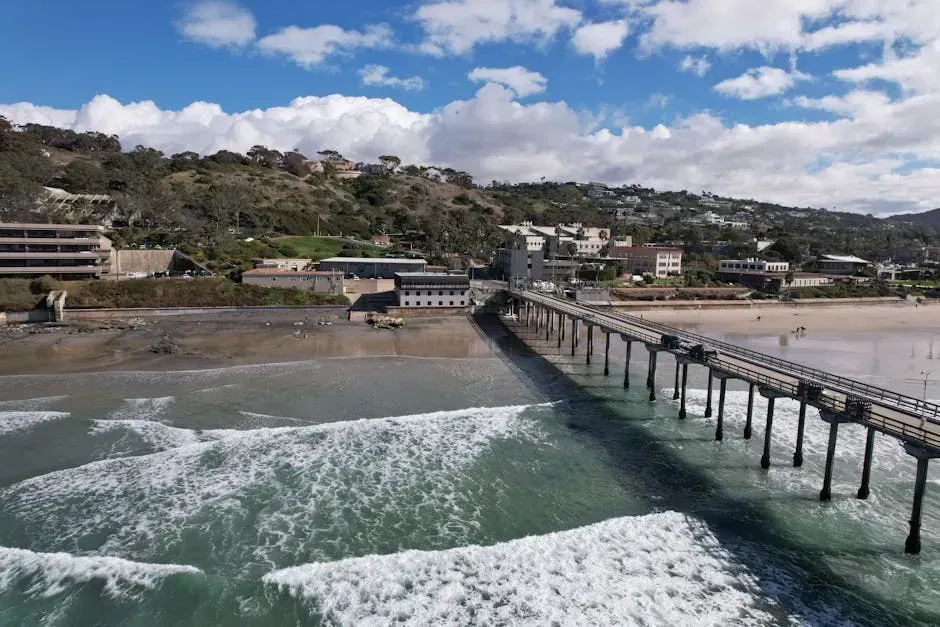
Measurements of atmospheric CO2 concentration in the Scripps program began in 1957 at La Jolla, California and at the South Pole, and in 1958 at Mauna Loa Observatory. These measurements were gradually extended during the 1960s and 1970s to comprise sampling at an array of stations from the Arctic to Antarctica. La Jolla, perched on the Pacific coast north of San Diego, was the analytical nerve center for much of this expanding effort. Samples collected at far-flung stations around the globe came back here for rigorous laboratory analysis.
Isotopic measurements on flask samples of the carbon-13 to carbon-12 and oxygen-18 to oxygen-16 ratios of CO2, which Scripps began in 1978, were gradually expanded to include all stations where CO2 concentration was measured. This isotopic work was a quiet revolution of its own, allowing scientists to distinguish between CO2 produced by fossil fuel burning and that released by natural processes. Due in part to the significance of Keeling’s findings, NOAA began monitoring CO2 levels worldwide in the 1970s. Today, atmospheric CO2 levels are monitored at about 100 sites around the globe through the Global Greenhouse Gas Reference Network.
Miami Beach, Florida: Where Researchers Organized the Science

In 1976, William Elliott and his colleagues thought it would be best to host a conference to establish the scientific themes that a federal anthropogenic climate change research program would explore. They selected sunny Miami Beach, Florida, as the venue for this important conference. The choice was deliberately practical – researchers were more likely to attend a meeting in Florida in late summer than in, say, a windswept government building in Washington. The strategy worked.
The conference organizers agreed on a list of invitees that included the most renowned names in climate science at the time. Among those invited was Bert Bolin, a Professor of Meteorology at the Arrhenius Laboratory of the University of Stockholm. Bolin would later serve as the inaugural chair of the Intergovernmental Panel on Climate Change from 1988 to 1997, firmly establishing his stature as one of the leading climate scientists of the twentieth century. The Miami gathering was one of the early moments where the scattered strands of 1970s climate research were woven together into a shared, organized agenda. Despite only operating from 1978 to 1981, the resulting federal research program was a noteworthy undertaking – one of the first dedicated to the fairly narrow question of anthropogenic climate change funded and operated by the federal government, and it revealed the close relationship between climate science and climate politics in the United States.
NASA’s Goddard Institute for Space Studies, New York City: Bringing Space Science Down to Earth
During the 1970s, Congress wanted NASA to do more research to meet national needs, which included energy efficiency, pollution, ozone depletion, and climate change. In 1976, Congress revised the Space Act, authorizing NASA to research the stratospheric ozone layer, and this formalized the agency’s movement into Earth sciences. The Goddard Institute for Space Studies, tucked above a burger restaurant on Broadway in Manhattan, may seem like an unlikely home for planetary-scale science. Yet it became one of the most productive climate research centers of the era.
Jule Charney evaluated the advanced three-dimensional general circulation model of James E. Hansen from NASA’s Goddard Institute for Space Studies as part of the landmark 1979 Charney Report. Hansen’s work at GISS through the late 1970s laid the groundwork for what became one of the most influential research programs in the history of climate science. The year 1979 is considered a landmark in the history of knowledge about human-caused climate change because of the publication of the Charney Report and the simultaneous organization of the first World Climate Conference by the World Meteorological Organization. By the end of that decade, the pieces were no longer scattered. A coherent, cross-institutional scientific understanding of the climate crisis had taken shape – assembled, improbably, across a mountain in Hawaii, an Antarctic ice sheet, a New Jersey university campus, a Southern California lab, and a Broadway office building in New York.
- 11 Winter Weather Mistakes People Keep Making - May 9, 2026
- Where the World’s Most Important Climate Discoveries of the 1970s Happened - May 8, 2026
- The 9 Strangest Weather Records Set in the Last 5 Years - May 8, 2026