

Climate risk isn’t evenly distributed across the United States. Walk the Gulf Coast, and that reality becomes visceral. Stand in parts of Mississippi or Louisiana and the question isn’t whether climate change is coming – it’s how much worse things are about to get.
In such a large and environmentally diverse landmass as the United States, the effects of climate change vary considerably across the country, with some regions likely to experience far worse impacts from global warming than others. To make sense of which states face the steepest climb, researchers have developed several scoring frameworks, including the U.S. Climate Vulnerability Index, the Commonwealth Fund State Scorecard, and the SafeHome Climate Change Risk Index. The picture that emerges from all of them is striking, and uncomfortably consistent.
How Climate Risk Scores Actually Work
The U.S. Climate Vulnerability Index is based on 184 indicators across environmental, social, economic, and infrastructure metrics, looking at both pre-existing vulnerabilities and future risks from climate change. That breadth matters. A state can face catastrophic flood risk while also lacking the economic foundations to recover. Both factors drag down the score.
To calculate a Climate Change Risk Index, researchers compare data to determine things like how many people are at risk of dangerously high temperatures, wildfires, or flooding, and how climate change will extend periods like mosquito season or high wildfire risk days. Each state is ranked in each category from best to worst, and those figures are added together to create a total in which higher numbers equate to greater risk. The result is a composite picture rather than a single-issue ranking.
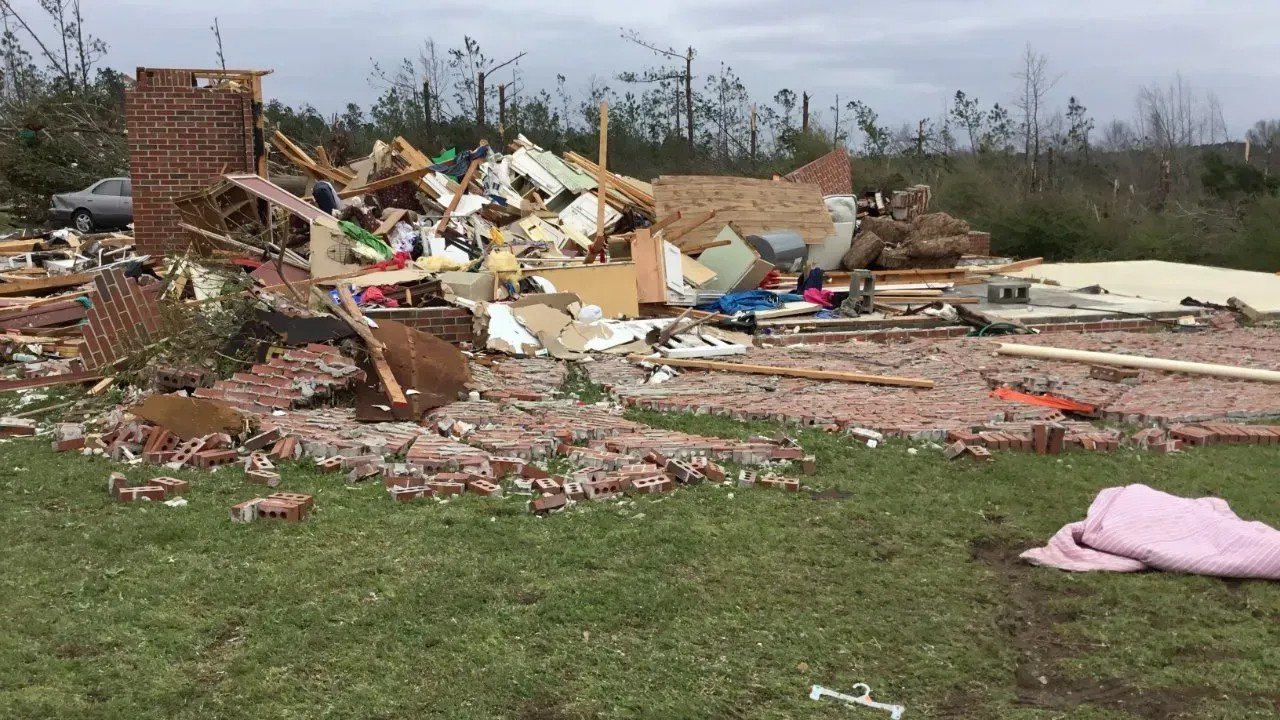
Mississippi: The Worst Overall Score in the Nation

Mississippi ranked lowest in one major analysis due to the combined weight of climate vulnerability, economic instability, and limited market resilience. According to the U.S. Climate Vulnerability Index, it holds the worst overall score in the nation, driven by factors like flooding, heat stress, poor infrastructure, and low socioeconomic resilience. That combination is particularly punishing – the threats arrive quickly, and the recovery capacity is thin.
Mississippi has the worst ranking nationwide on a number of metrics, including child and maternal health, transportation sources, and food insecurity. While Mississippi is largely shielded from wildfires and earthquakes, it is increasingly susceptible to extreme heat, hurricanes, and inland flooding. These risks have already contributed to multiple federally declared disasters, and the state also faces serious challenges in housing quality, with older homes often less equipped to handle climate stressors.
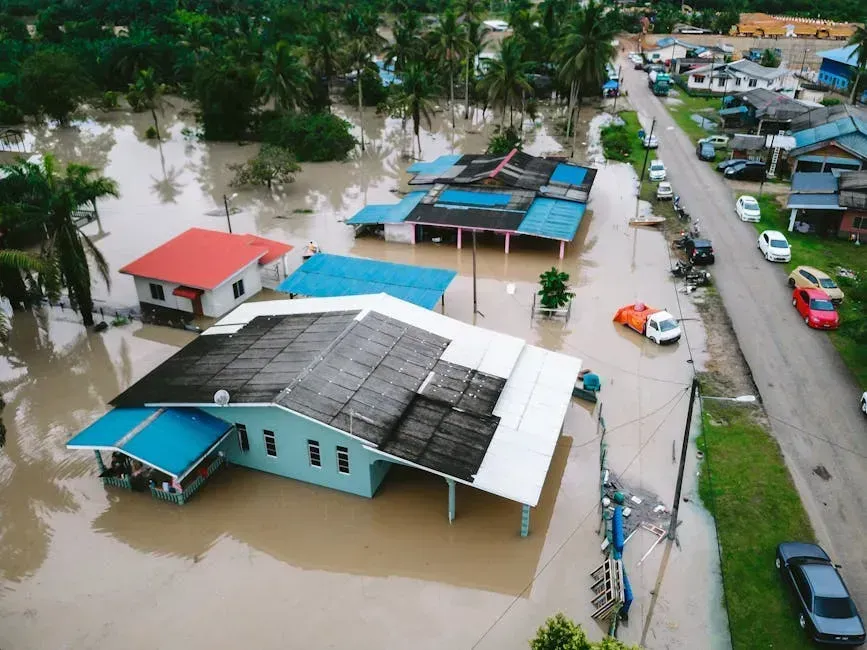
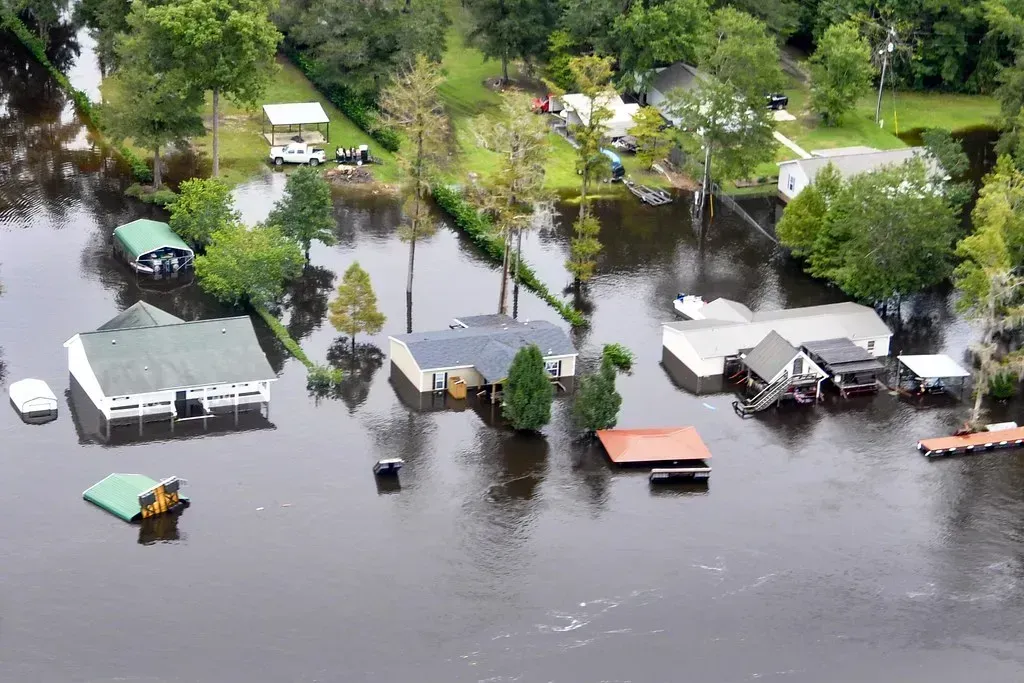
Louisiana: A Football Field of Land Lost Every 100 Minutes
Hurricane risk dominates Louisiana’s climate profile. With 79 federally declared disasters since 1953, the state has repeatedly borne the brunt of powerful storms. Cities like New Orleans and Lake Charles have faced catastrophic damage from hurricanes such as Katrina in 2005 and Laura in 2020. The record is long and grim.
Sea level rise and ongoing coastal erosion are making matters worse. Louisiana loses about a football field of land every 100 minutes, leaving low-lying areas even more exposed. According to FEMA data, Louisiana is expected to lose $556 per resident to environmental damages per year – more than roughly a fifth higher than second-place South Dakota. Most of Louisiana’s projected damages are due to riverine flooding, coastal flooding, and hurricanes.
West Virginia: Last in the Commonwealth Fund Rankings
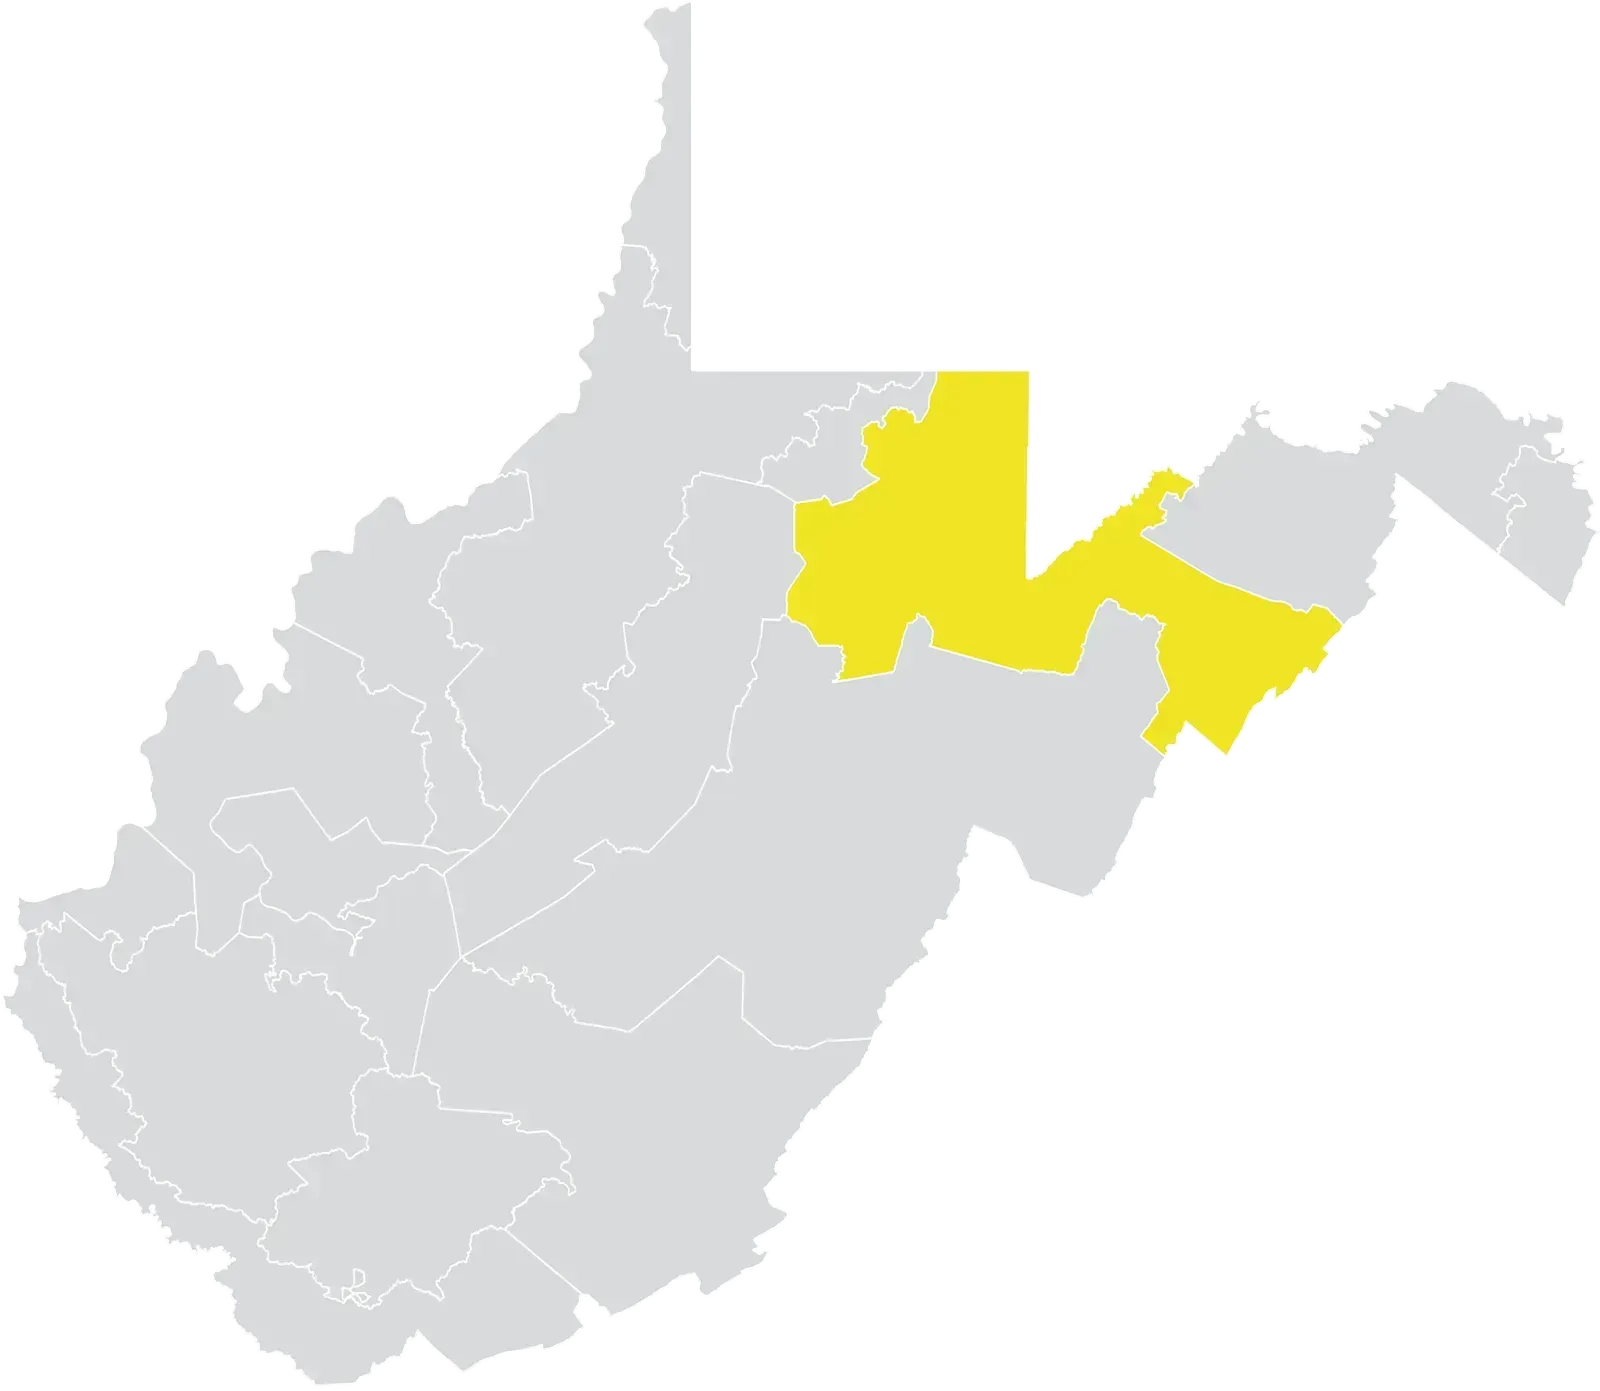
In the Commonwealth Fund’s comprehensive state scorecard, West Virginia ranked dead last – 51st out of 50 states and Washington D.C. These states face more frequent and intense hazards and don’t have supportive energy and environmental policies, per the report. West Virginia’s issues are less about coastal storms and more about systemic vulnerability baked into its infrastructure and energy economy.
West Virginia, Wyoming, and North Dakota had the highest per-capita greenhouse gas emissions from the health care sector in 2020. That year, West Virginia’s health care sector emitted 2,570 kilograms of carbon dioxide equivalent per capita. That figure speaks to the state’s deep structural reliance on fossil fuels, which compounds its exposure to the health consequences of a warming climate.
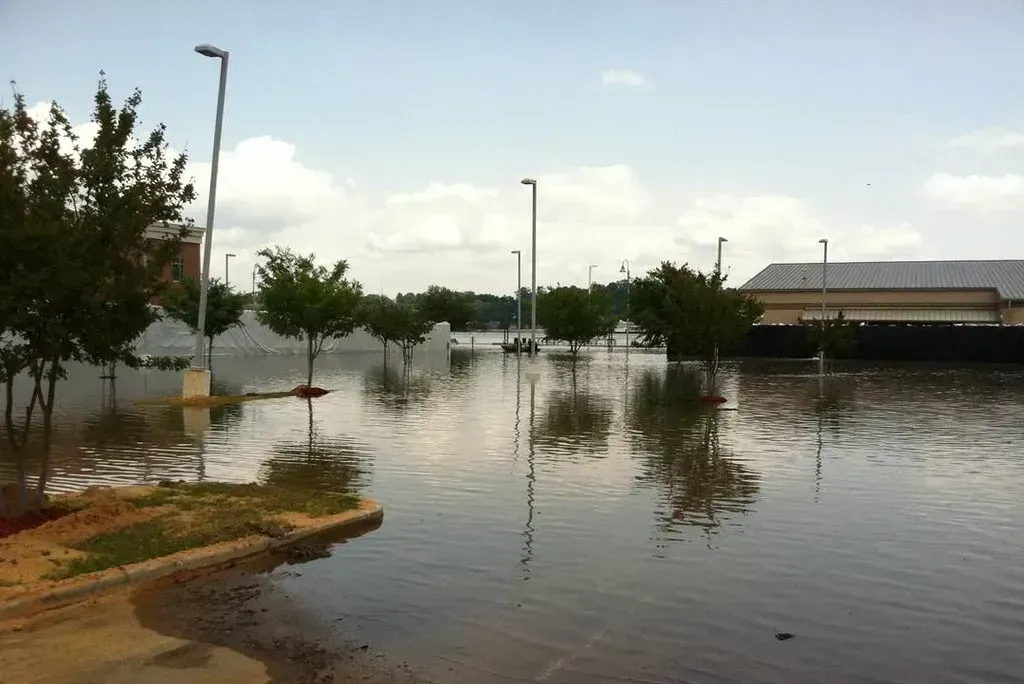
Florida: America’s Ground Zero for Sea Level Rise
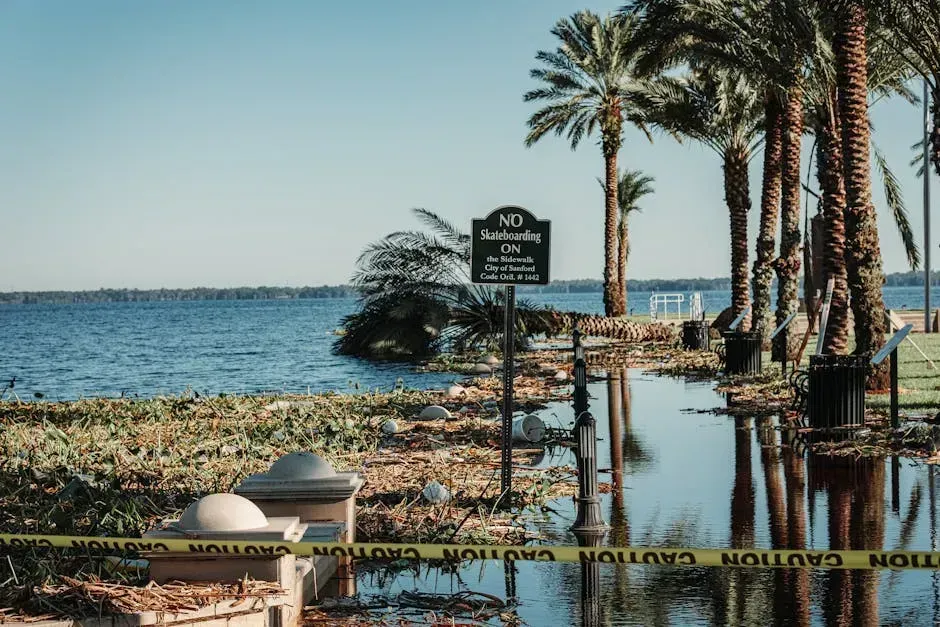
Due to its low elevation and the fact that it is the U.S. state with the largest number and percentage of its population living in coastal areas, Florida is at significant risk from flooding. South Florida is especially vulnerable to sea level rise, with 590,000 people facing high or extreme risk. Of those, an estimated 55,000 are medically vulnerable and 125,000 are socially vulnerable.
From 1980 to 2024, there were 94 confirmed weather and climate disaster events with losses exceeding $1 billion each affecting Florida. Florida also has the nation’s highest percentage of hospital beds – nearly 15 percent – located in high-hazard flood zones. That means the infrastructure people depend on during a crisis is itself in the crosshairs.
Alabama and Kentucky: Consistently in the Danger Zone
Mississippi, Louisiana, and Alabama are the states with the highest level of vulnerability to the impacts of climate change according to the U.S. Climate Vulnerability Index. Alabama’s coastal position along the Gulf keeps it persistently exposed to hurricane risk, and its inland regions face worsening heat and flooding. The entire coastline of the Carolinas, much of Florida, and the Louisiana and Alabama coastlines are deemed red flags for hurricane and flood risk.
Kentucky falls into the “highest vulnerability” category, notable for its poor score on air pollution-related deaths. The Commonwealth Fund’s scorecard placed it among the lowest-ranked states, alongside West Virginia and Louisiana. High-ranked states have lower environmental risk and vulnerability as well as stronger decarbonization and clean energy policies – precisely the areas where Kentucky continues to lag.
Texas: Every Kind of Risk, No Statewide Strategy
Texas continues to rank as one of the most climate-challenged states in the country. From Category 3 and 4 hurricanes along the Gulf Coast to widespread drought and record-setting heat waves, the state faces a broad spectrum of environmental risks. Power grid instability has also become a growing concern, particularly during extreme temperature events that strain energy infrastructure.
Unlike many states, Texas has not developed a comprehensive statewide strategy to deal with climate risks, according to the Climate Center at Georgetown University. The Texas power grid, which is not part of a larger interconnect unlike other states, has already proven vulnerable to outages. When it comes to hurricanes alone, Florida anticipates the most projected damage, but Texas and the Gulf region collectively bear enormous exposure.
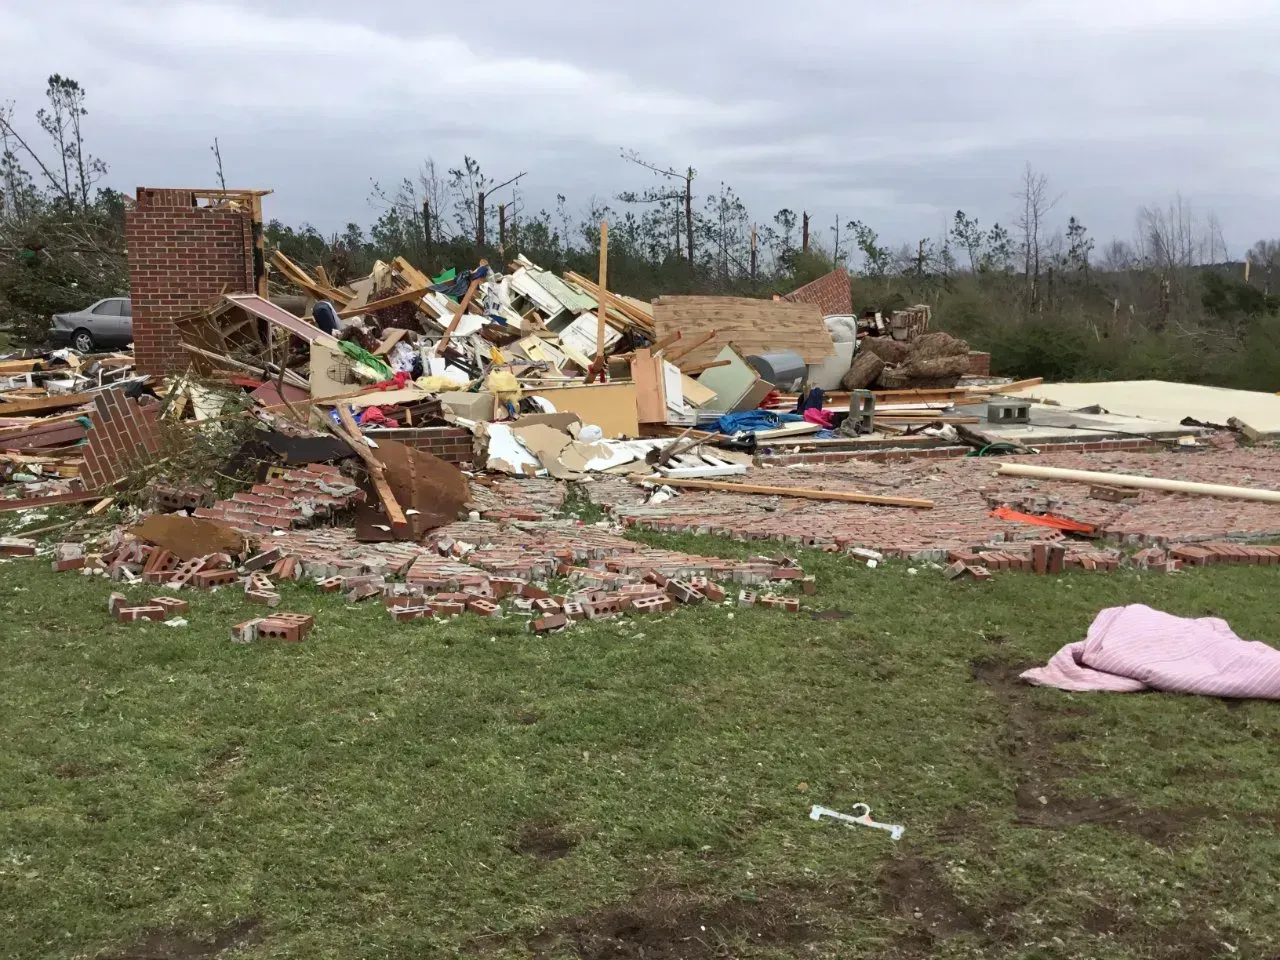
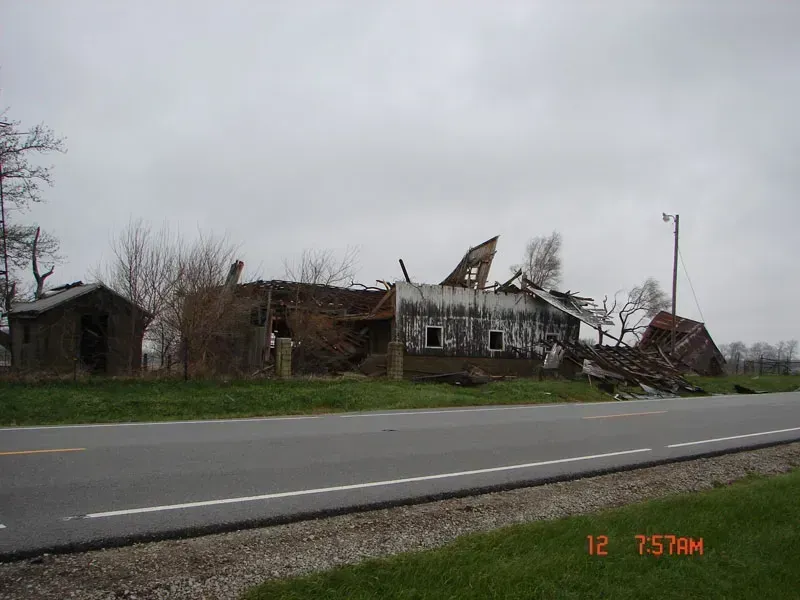
Oklahoma: Tornado Alley Meets Rising Wildfire Risk
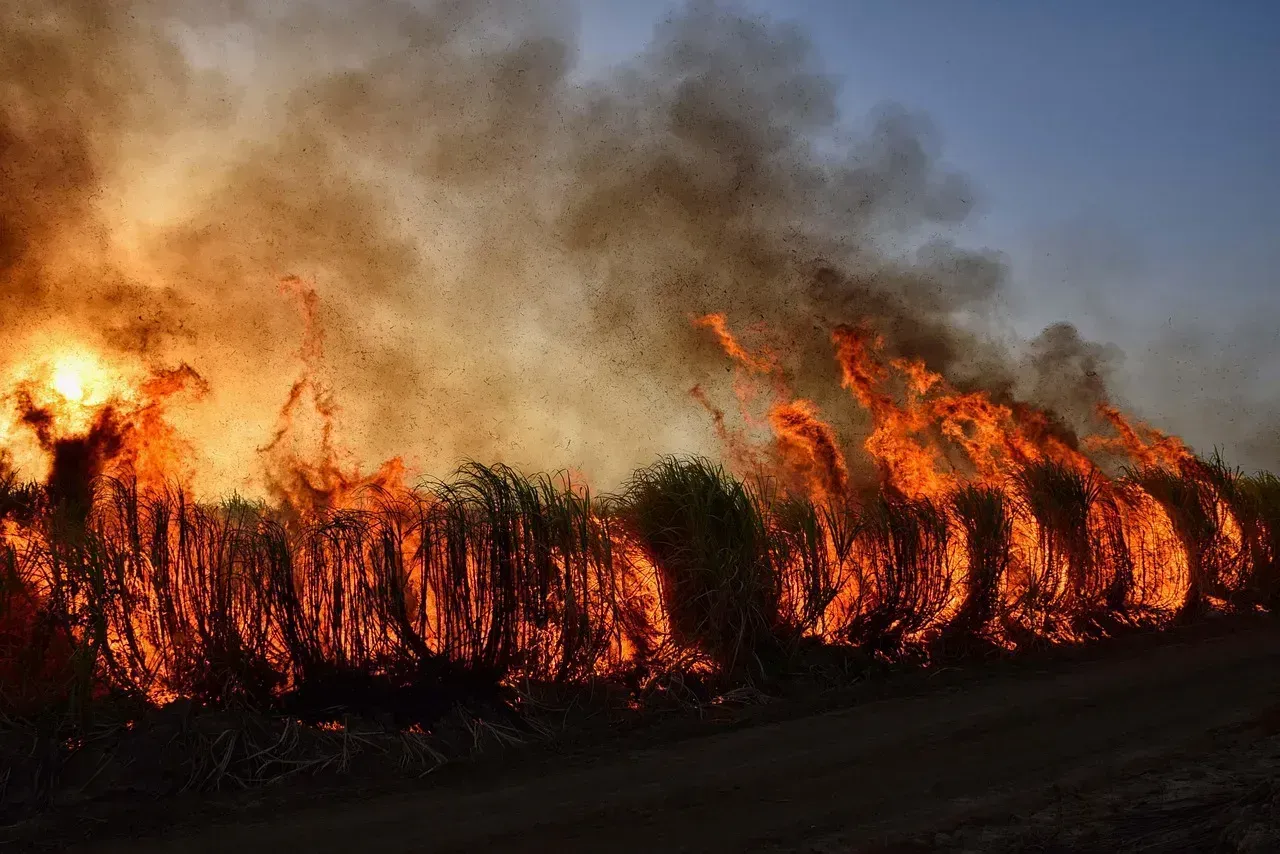
Oklahoma ranks among the country’s least climate-resilient states, largely due to its frequent exposure to severe weather and extreme temperatures. The state sits in the heart of Tornado Alley, experiencing high tornado volumes compared to other parts of the U.S. Residents also face high wildfire potential, persistent drought conditions, and intense temperature fluctuations.
These risks translate directly into higher costs for homeowners. In 2024, Oklahoma residents paid an average of $5,858 per year for home insurance, one of the highest rates in the nation. Beyond insurance, 23 rural hospitals in Oklahoma are currently at risk of closing, putting some communities in an even more precarious position when disaster strikes.
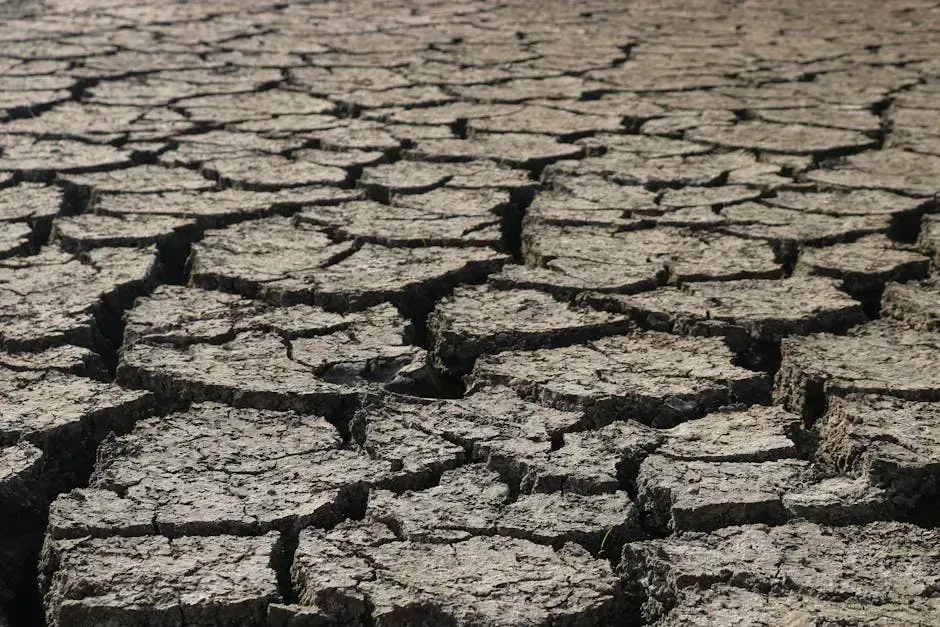
Arizona and the Southwest: The Extreme Heat Frontier
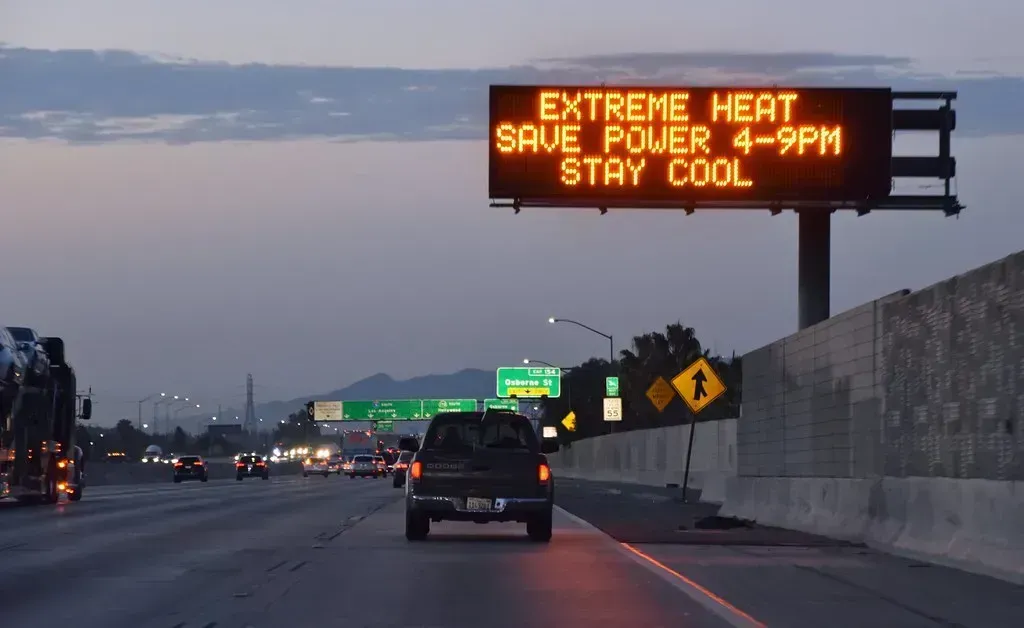
Nevada, New Mexico, and Arizona face the greatest health risks from extreme heat – the deadliest weather-related hazard in the U.S. When looking at average annual air quality, Arizona performs the worst among all states, followed by California. The combination of brutal heat and degraded air quality creates a compounding health burden that affects millions of residents year-round.
An average of two heatwaves per year was observed in the U.S. during the 1960s. The number increased steadily and currently sits at around six heatwaves yearly. For Arizona, that national trend is amplified. In a typical year around 1990, people in Miami experienced about 7 days above 92.6 degrees Fahrenheit. By 2050, Arizonan and Gulf-region cities are projected to see dramatic increases in extreme-heat days annually. The Southwest is living through what the rest of the country will eventually face.
South Carolina: Coastal Flooding and Climbing Risk Scores
Florida and South Carolina are most at risk from climate change, facing extreme heat, drought, and flooding. Coastal states like Florida and South Carolina top the risk rankings among all states analyzed. South Carolina’s long and relatively low-lying Atlantic coastline leaves major population centers exposed to storm surge and tidal flooding, threats that are intensifying as sea levels climb.
South Carolina anticipated $291 in hurricane damages per person – ranking it third highest in the nation, behind only Florida and Louisiana. South Carolina also records some of the highest emissions related to commuting by health care workers, adding another layer of systemic climate stress. Its scores across multiple risk categories place it firmly among the worst-performing states on nearly every measure that researchers track.
What the Numbers Actually Tell Us
Nine out of ten states predicted to experience the worst impacts from the climate crisis are in the American South, many of them coastal. The Northeast is seen as the safest zone, with Vermont, New Hampshire, and Massachusetts among the lowest-risk states – though nowhere escapes all climate change impacts. The geographic pattern is one of the most consistent findings across every major scoring system.
In 2024 alone, NOAA reported 27 weather and climate disasters with damage topping $1 billion each. These disasters resulted in 568 direct or indirect deaths, making 2024 the eighth-highest fatality year in the last 45 years. The scores in these rankings aren’t abstract numbers. They map onto real losses, real displacement, and a growing insurance crisis that is quietly reshaping where Americans can afford to live. The gap between the states at the top and those at the bottom is widening, and the data makes it hard to look away.