

- Phantom Energy Sucking Power 24/7 – 7 Home Electronics Quietly Inflating Utility Bills - November 14, 2026
- A Million-Mile Storm Raging for Centuries – 6 Violent Weather Wonders in Our System - November 14, 2026
- Animals Flee Hours Before the Tremor – 7 Natural Warnings Before Disasters Strike - November 14, 2026
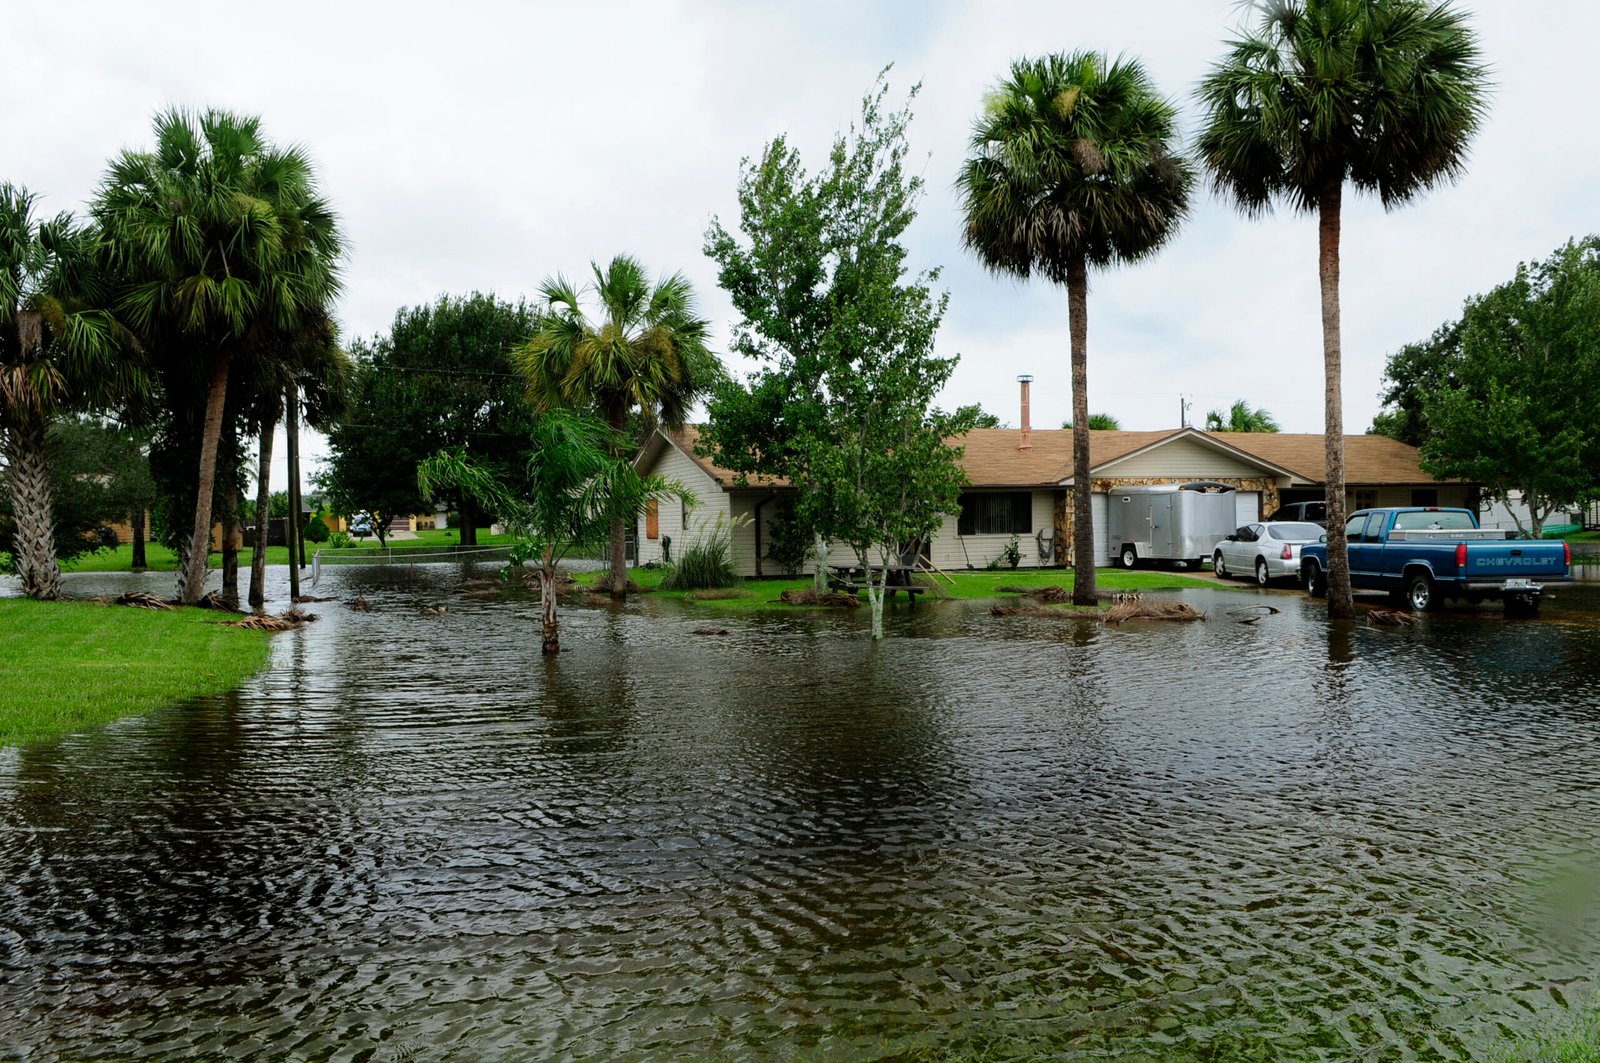
Ten feet does not sound like much until you picture it as the line between a dry living room and a flooded one. Across the American coastline, that modest number has become one of the most consulted thresholds in climate planning, and updated mapping tools are now showing, block by block, who sits above it and who does not.
The maps themselves are not new inventions. What has changed recently is the resolution, the underlying elevation data, and in some cases the tidal calculations feeding into them, all of which sharpen the picture for homeowners, insurers, and city planners trying to understand real exposure rather than abstract risk.
What the updated maps are actually built on
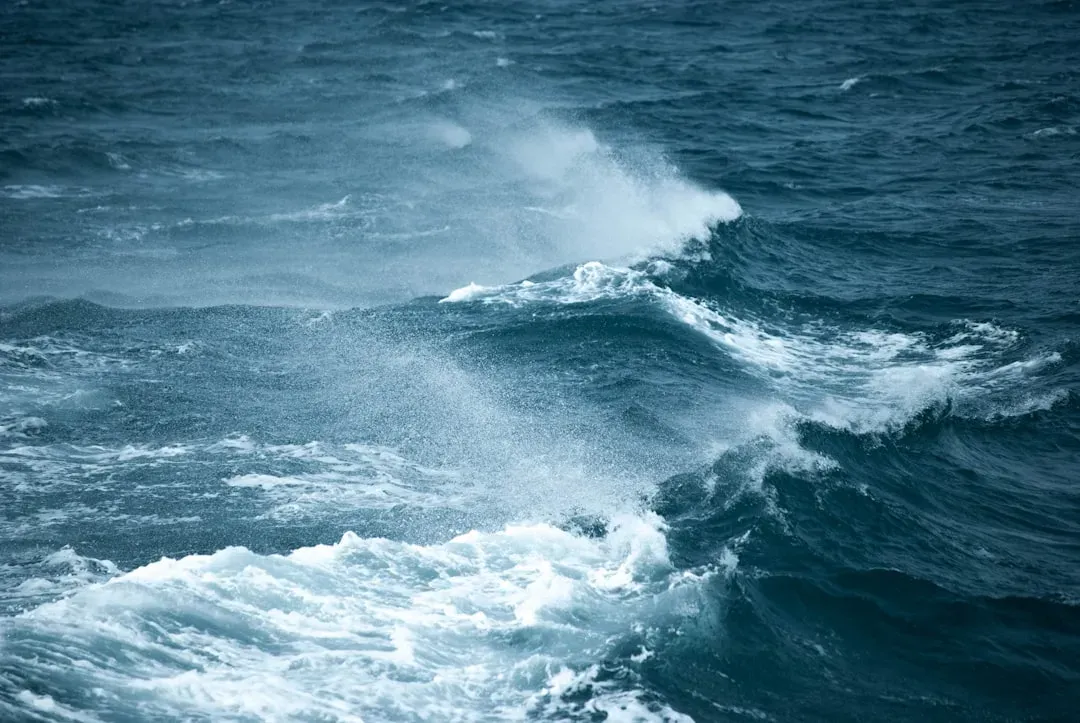
The tool most people encounter is NOAA’s Sea Level Rise Viewer, maintained by the agency’s Office for Coastal Management. It lets users visualize community-level impacts from coastal flooding or sea level rise up to 10 feet above average high tides, sliding a bar to see how water creeps inland at each incremental foot.
What makes the current version notable is the underlying elevation work. The maps are produced using detailed elevation maps with local and regional tidal variability, and several regions have recently been rebuilt with fresh data. Eastern and southern Puget Sound counties were remapped with new elevation data, with new digital elevation models now available, and similar refreshes have rolled out for parts of Louisiana, Mississippi, Hawaii, and Guam.
Why ten feet became the standard cutoff
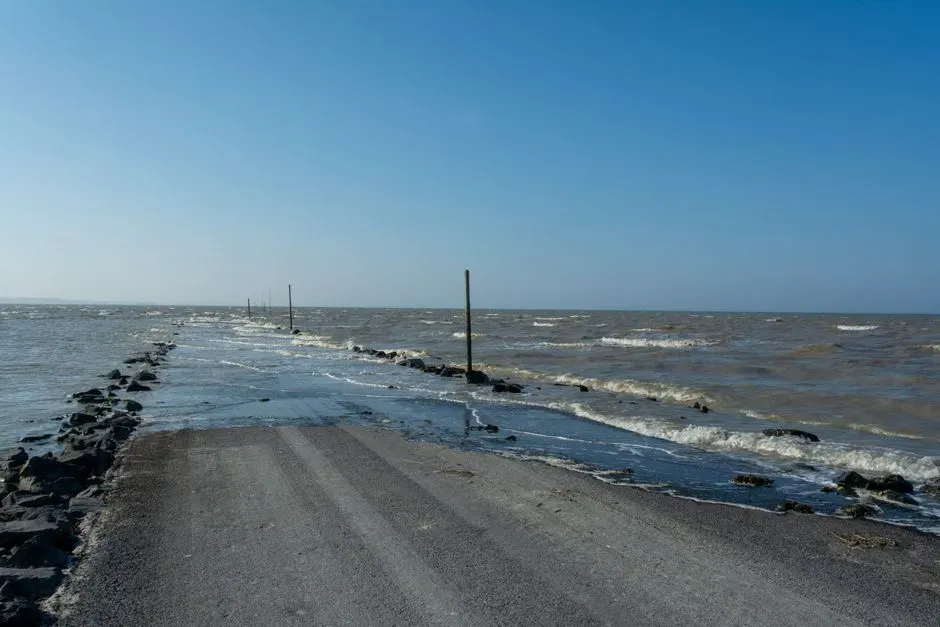
Ten feet is not an arbitrary round number. It roughly represents the upper bound of what climate scientists consider a plausible, if severe, long-term sea-level rise scenario when storm surge and tidal extremes are layered on top of gradual ocean rise.
Climate Central’s Surging Seas tool uses a similar ceiling, applying what researchers call a bathtub method to elevation data. As the methodology explains, areas below a selected water level that are not connected to the ocean at that level are shown differently from areas that are directly connected, which matters because a low patch of land cut off from the tide by a ridge is a very different risk than one that floods every high tide.
New York City’s uneven exposure
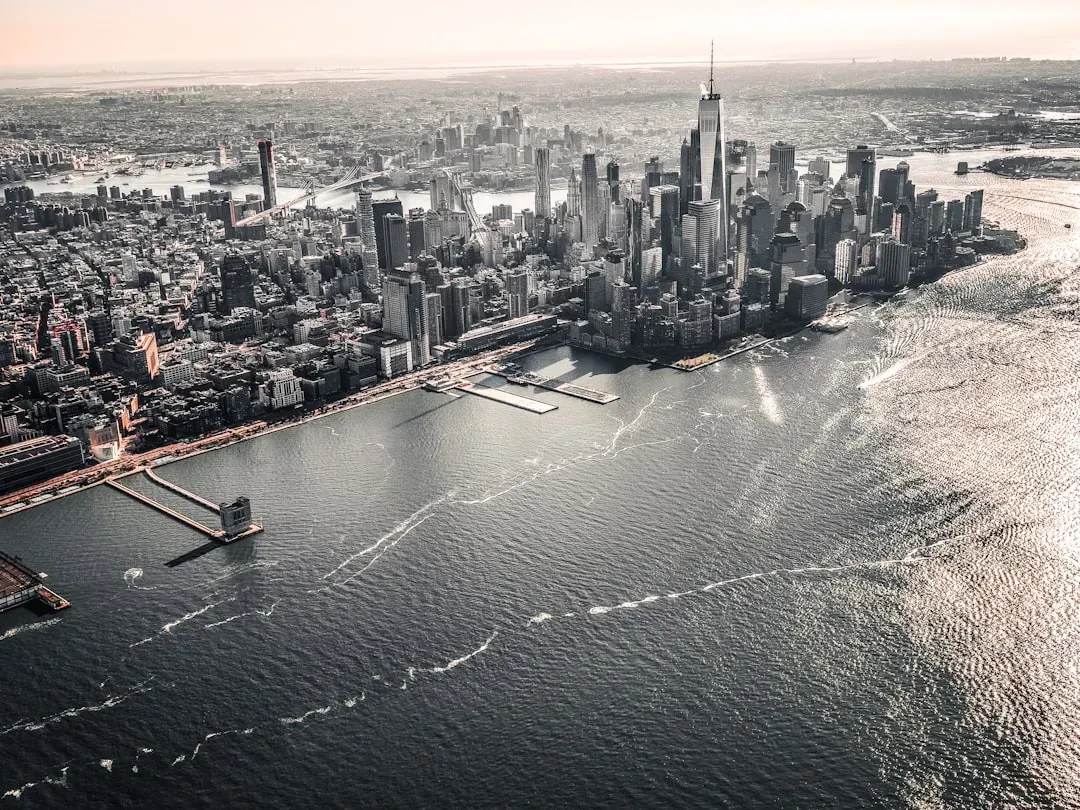
New York is often used as the poster child for ten-foot risk, and the numbers back that up. Earlier Climate Central research pegged the city’s low-lying population, meaning residents on land less than 10 feet above the high tide line, at more than 700,000 people, making it the most threatened city in the country by that measure.
What the newer, higher-resolution maps add is nuance about which parts of the city are actually vulnerable. At a five-foot rise scenario, mapping shows both LaGuardia and Newark airports would be affected, while JFK fares better with no intrusion onto the tarmac. That kind of block-level detail, rather than a citywide average, is exactly what the new generation of tools is designed to reveal.
Florida’s disproportionate share of the risk
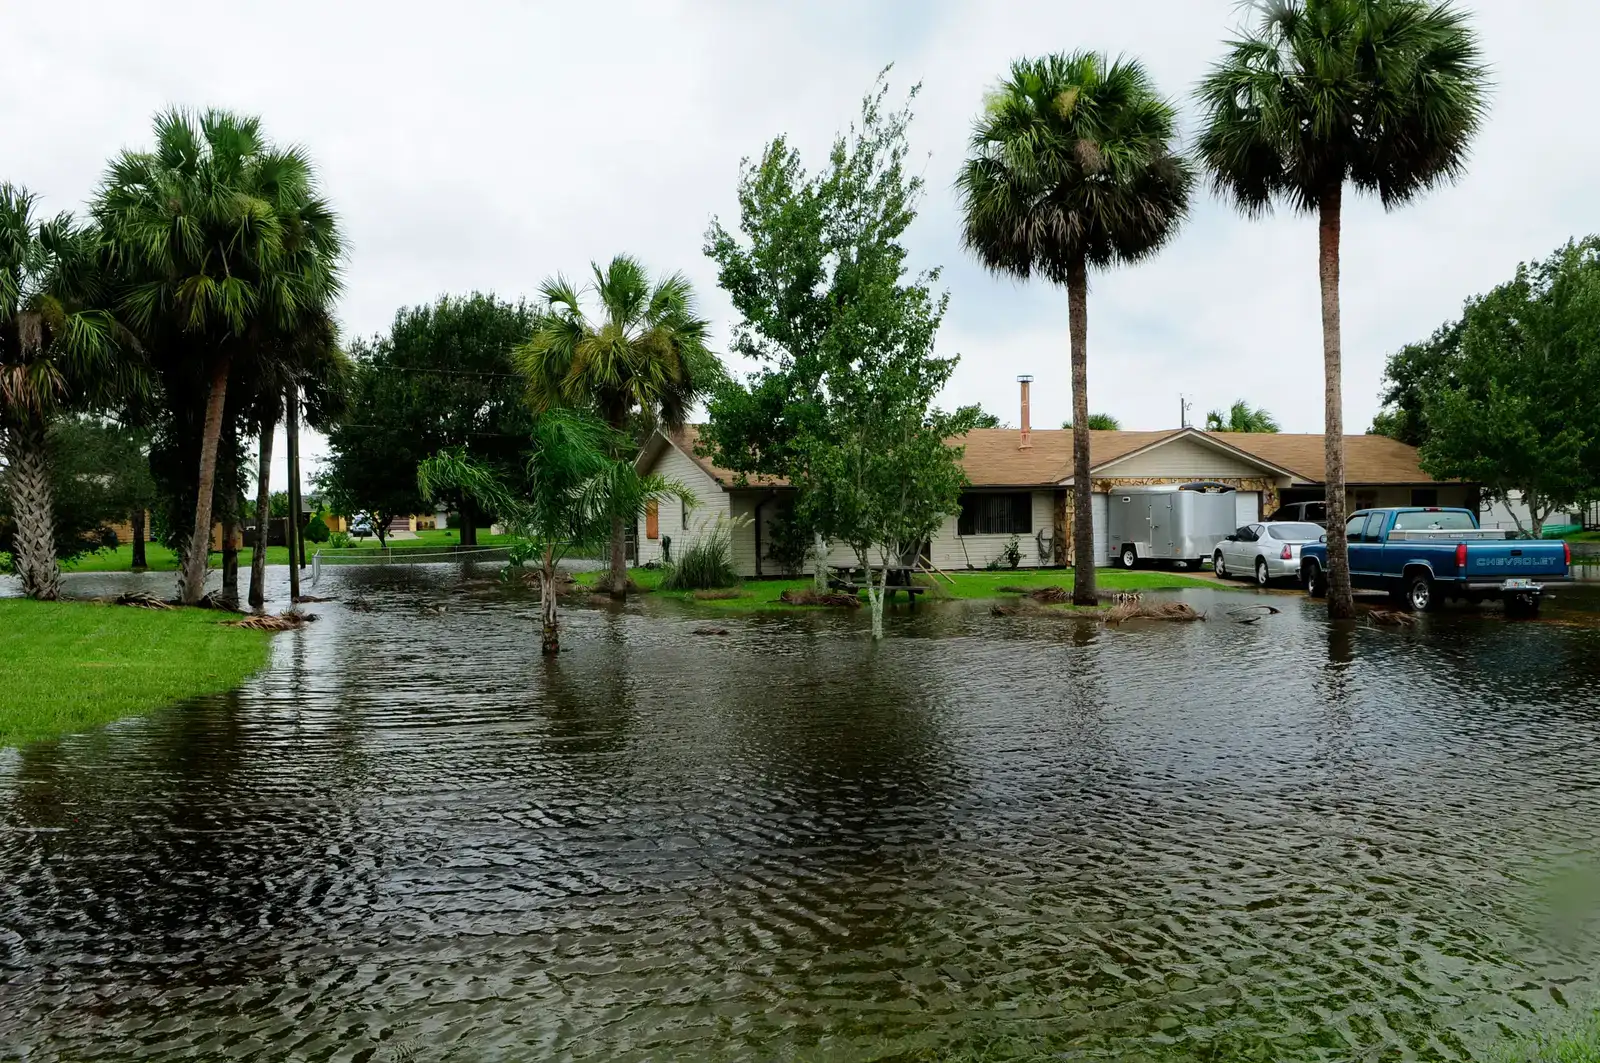
No state shows up more often in ten-foot flood mapping than Florida, and the reasons are structural rather than incidental. Older Climate Central analysis found that twenty-seven of the forty most exposed U.S. cities are in Florida, where one third of all current housing sits below the critical ten-foot line, including 85 percent in Miami-Dade and Broward counties.
Newer coverage of updated NOAA projections confirms the pattern holds. Recent mapping shows Florida cities including Jacksonville, Fort Lauderdale, Tampa, St. Petersburg, and Panama City would face the threat of severe flooding under a ten-foot sea level surge. The state’s flat topography, extensive barrier islands, and dense coastal development combine to put more people and property in the flood zone than almost anywhere else in the country.
The Gulf Coast is rising faster than the rest of the country
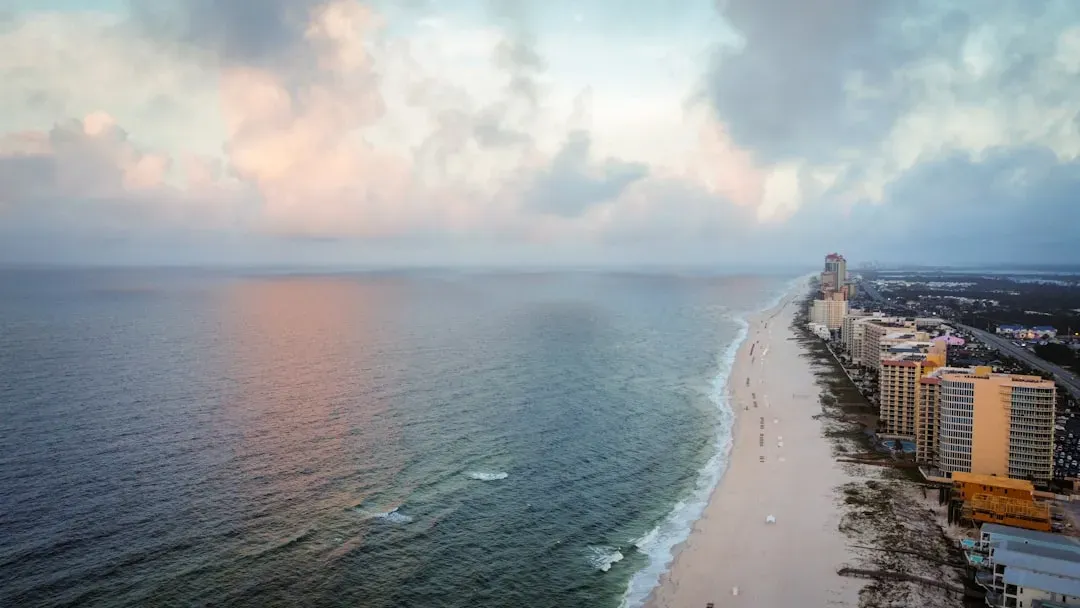
If the East Coast is the headline case, the Gulf Coast is quietly the more urgent one. Federal projections show sea level rise in the western Gulf of America is likely to be about 16 to 18 inches higher than 2020 levels by 2050, almost half a foot above the national average.
That faster pace shows up clearly on updated maps of Texas and Louisiana. Recent mapping identifies coastal Texas cities including Galveston Bay, Freeport, Surfside Beach, and communities near New Orleans as vulnerable to encroaching waters. Land subsidence, driven partly by groundwater and oil and gas extraction, compounds the ocean’s rise in ways that make this stretch of coastline especially difficult to plan around.
High-tide flooding is no longer a future problem
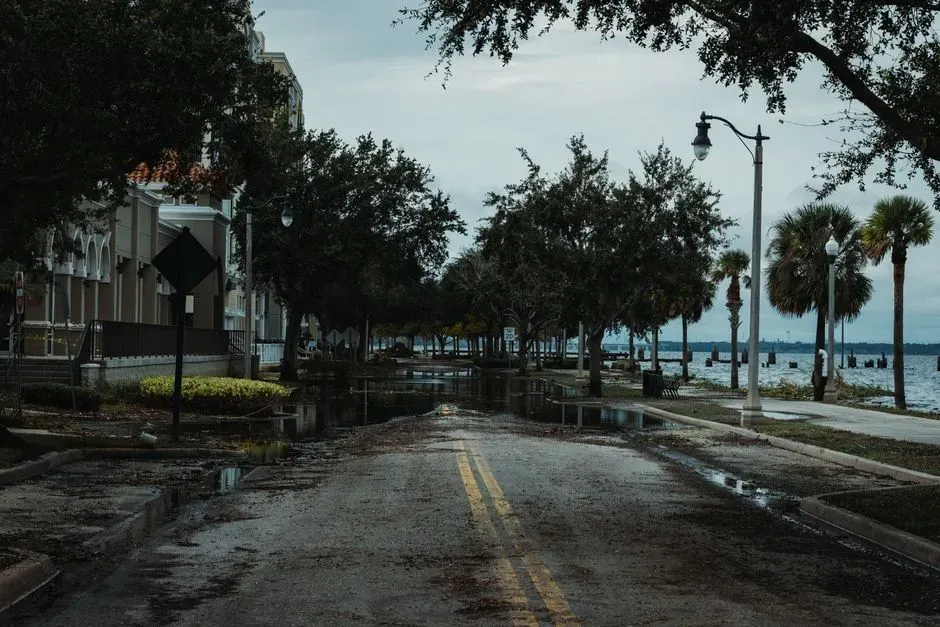
One of the more sobering aspects of the new mapping is how much it emphasizes flooding that is already happening, not just projected. NOAA’s own materials note that high tide flooding, meaning flooding that leads to public inconveniences such as road closures, is increasingly common as coastal sea levels rise.
The scale of that increase is stark. Nationally, high-tide flooding is now 300 percent to more than 900 percent more frequent than it was fifty years ago, and federal scientists project that by 2050, moderate flooding that is typically disruptive by today’s standards is expected to occur more than ten times as often as it does now. That trajectory is a big part of why the ten-foot maps matter now rather than decades from now.
The global picture below ten meters
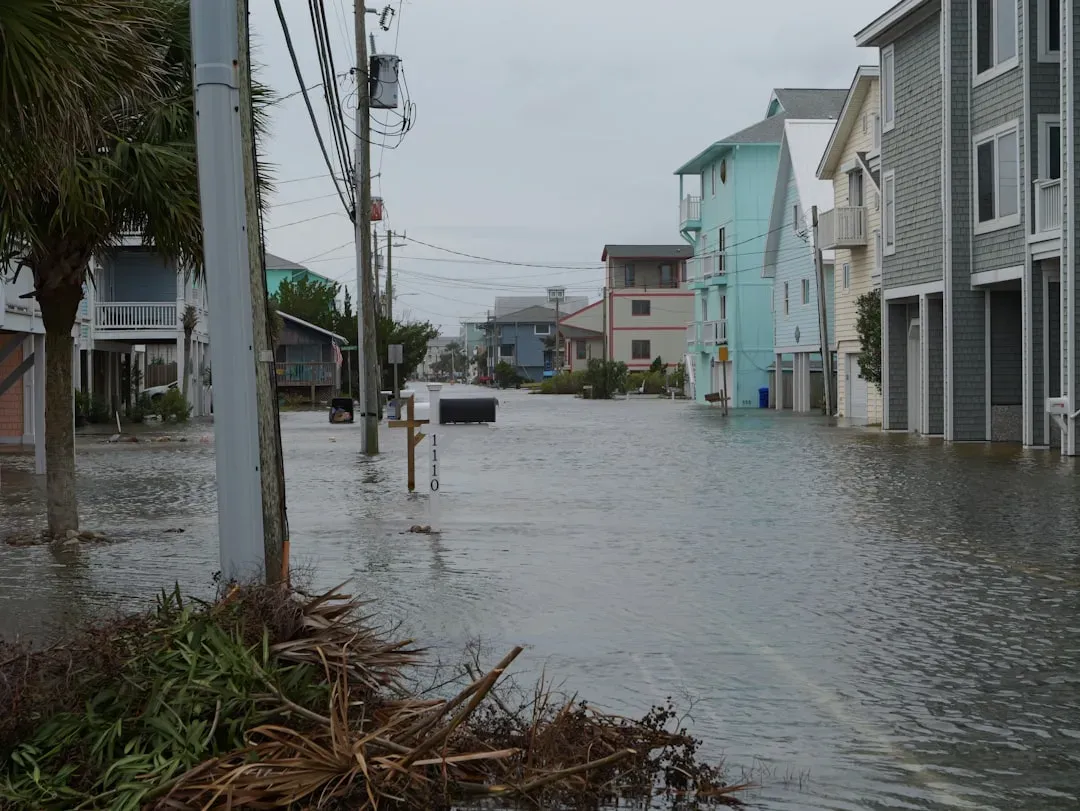
Scale the ten-foot question up to a global level and it becomes a story about roughly a third of humanity’s living arrangements. Research on population and elevation found that as of the mid-1990s, an estimated 1.88 billion people, or 33.5 percent of the world’s population, lived within 100 vertical meters of sea level, even though only 15.6 percent of inhabited land lies below that elevation.
More recent, narrower analysis focused specifically on the ten-meter band tells a similarly lopsided story. A study cited by the Global Center on Adaptation found that roughly 710 million people, or one in ten of us, now live less than 10 meters above sea level, with more than three quarters of them in Asia. Coastal living has always concentrated economic activity near the water, but that same geography is now the source of concentrated risk.
Louisiana’s delta shows what accelerated timelines look like

Louisiana offers a preview of what other regions may eventually face, because parts of it are already below sea level and only protected by engineered levees. As NOAA’s mapping notes explain, the base elevation data used to map Louisiana on the sea level rise viewer comes from the USGS’s Topobathymetric Elevation Model of the northern Gulf, developed with input from the state’s Coastal Protection and Restoration Authority.
That level of technical care exists because the margin for error is so thin there. Older but still relevant Climate Central figures found New Orleans among sixteen cities with more than 100,000 people below the ten-foot line, a city where much of the metro area sits below sea level already and is protected only by existing levees. Louisiana is essentially a live demonstration of managed risk under conditions much of the rest of the coast is only beginning to approach.
Where the maps fall short
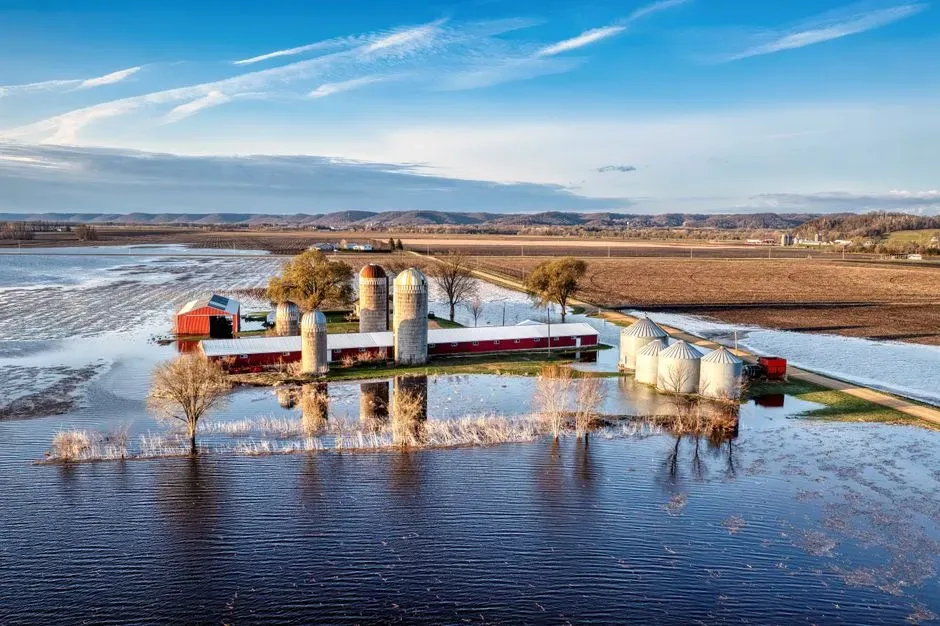
For all their improvements, these tools come with built-in caveats that are easy to overlook amid all the colorful flood overlays. NOAA is explicit about this, stating that the data and maps illustrate the scale of potential flooding, not the exact location, and do not account for erosion, subsidence, or future construction.
There are also regional data quality issues worth knowing about. In parts of Louisiana and Mississippi, for instance, mapping notes flag that transformation uncertainties in the regional model have been found to range from 20 to 50 centimeters in particular locations. That is a meaningful margin when the difference between flooded and dry can be measured in inches, which is exactly why NOAA describes the viewer as a planning reference tool rather than something suited for legal or engineering decisions.
