


- NASA invites students to design a moon base in $1 million challenge - November 11, 2026
- Why Some People Can Feel a Storm in Their Joints, According to Experts - November 11, 2026
- 7 Foods That Taste Better on a Rainy Day, According to Chefs - November 11, 2026
People often mix up the terms climate and weather in everyday conversation, yet the two describe very different things. Weather captures what is happening in the atmosphere right now or over the next few days, while climate looks at patterns that emerge across many decades. Understanding the difference helps explain why a single cold snap does not disprove global warming and why long-term records matter more than one stormy afternoon.
Scientists rely on clear definitions, consistent data collection, and statistical methods to separate short bursts of activity from enduring shifts. This careful approach supports better forecasts, smarter planning, and clearer public communication. The distinction also shapes how governments and communities prepare for everything from heat waves to rising sea levels.
The Short-Term Nature of Weather
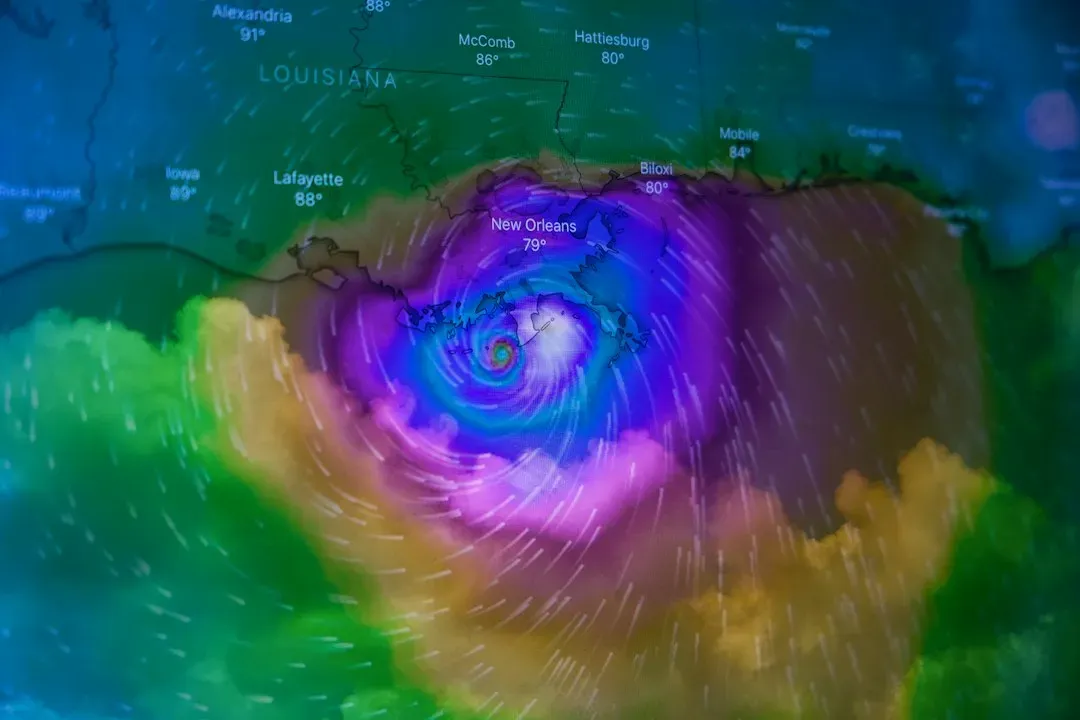
Weather refers to the state of the atmosphere at a specific place and time. It includes temperature, humidity, wind, precipitation, and cloud cover that can change within hours. Forecasters use satellites, radar, and surface stations to track these conditions and issue predictions that typically extend only a few days ahead.
Because weather fluctuates so quickly, it reflects immediate atmospheric dynamics rather than broader patterns. A sunny morning can turn into an afternoon thunderstorm without any contradiction in the data. These rapid shifts make weather the focus of daily planning, from what to wear to whether flights will be delayed.
Climate as Long-Term Patterns
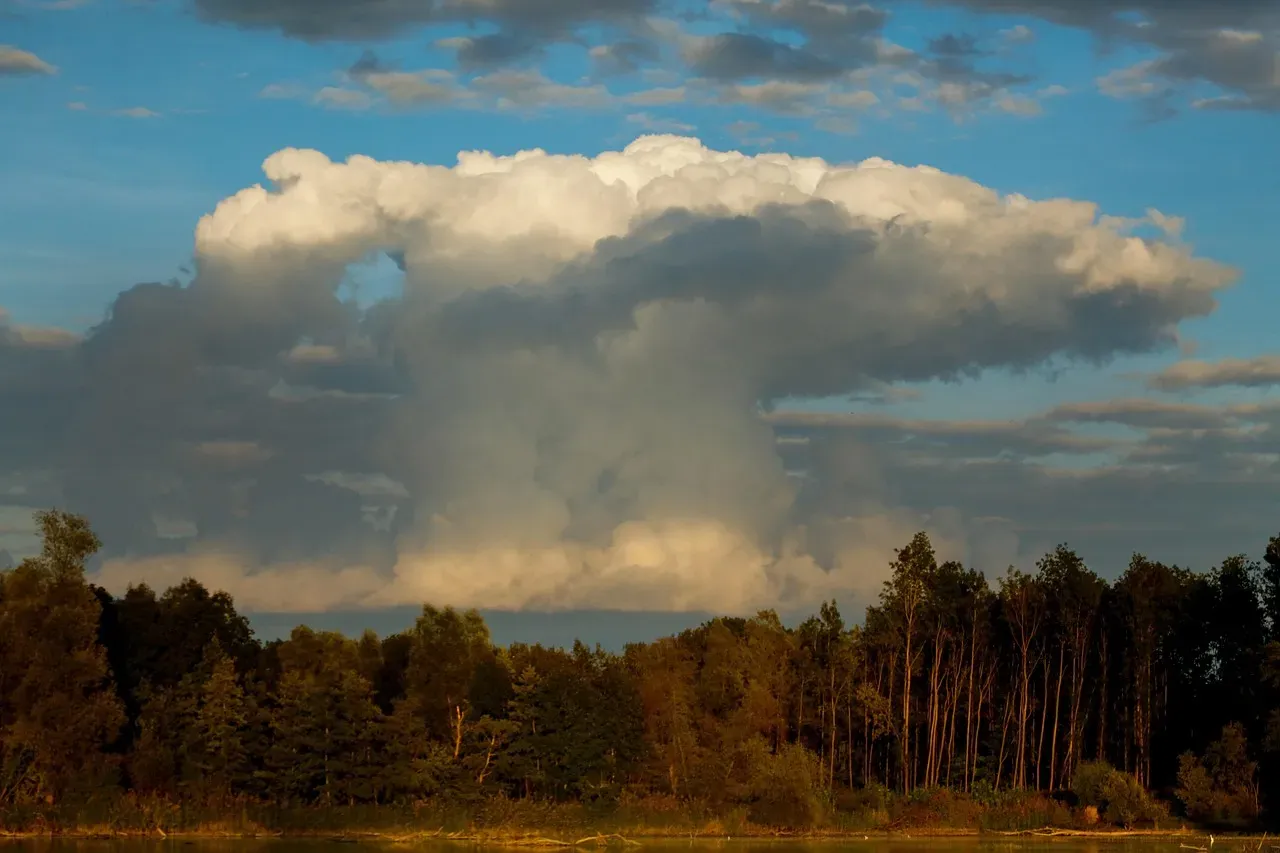
Climate describes the average weather conditions in a region over a period of at least thirty years, according to standards set by the World Meteorological Organization. It incorporates not just averages but also the range of expected extremes and how often they occur. This longer view reveals whether a place is becoming drier, wetter, or more variable overall.
Researchers calculate climate normals by compiling decades of observations and then compare newer data against those baselines. The resulting picture shows trends that individual weather events cannot reveal on their own. Climate therefore serves as the backdrop against which daily conditions are judged.
Measuring Time Scales: Days Versus Decades
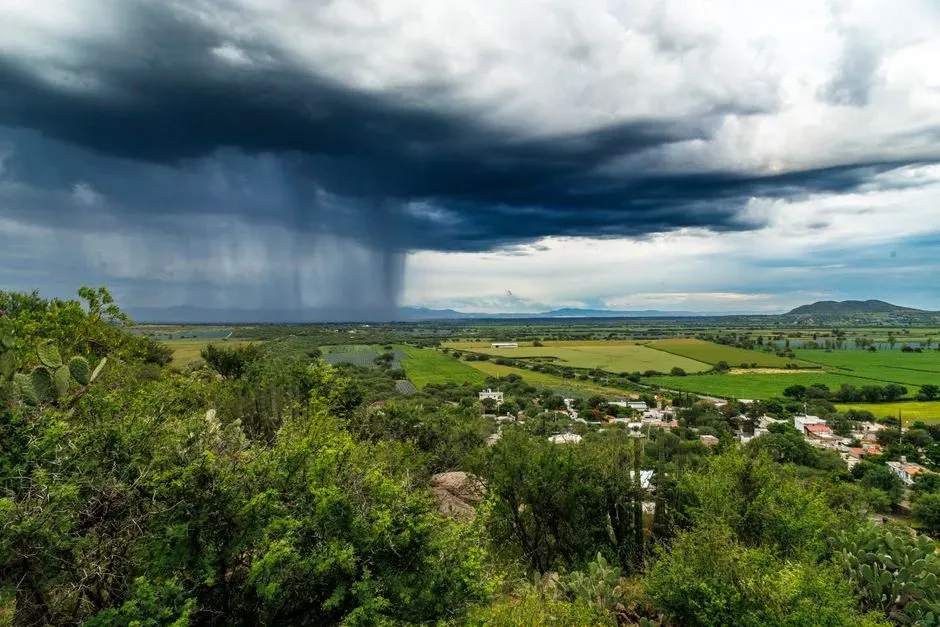
Weather operates on time scales measured in hours to weeks, driven by immediate factors such as pressure systems and fronts. Climate, by contrast, requires observations spanning thirty years or more to smooth out natural variability. This difference in duration is fundamental to how each concept is defined and studied.
Shorter records can mislead if taken in isolation, while multi-decade datasets highlight whether changes fall within historical ranges or signal something new. Scientists therefore insist on long observational periods before declaring a shift in climate. The extended timeline filters out noise and exposes underlying signals.
Tools Scientists Use for Observation
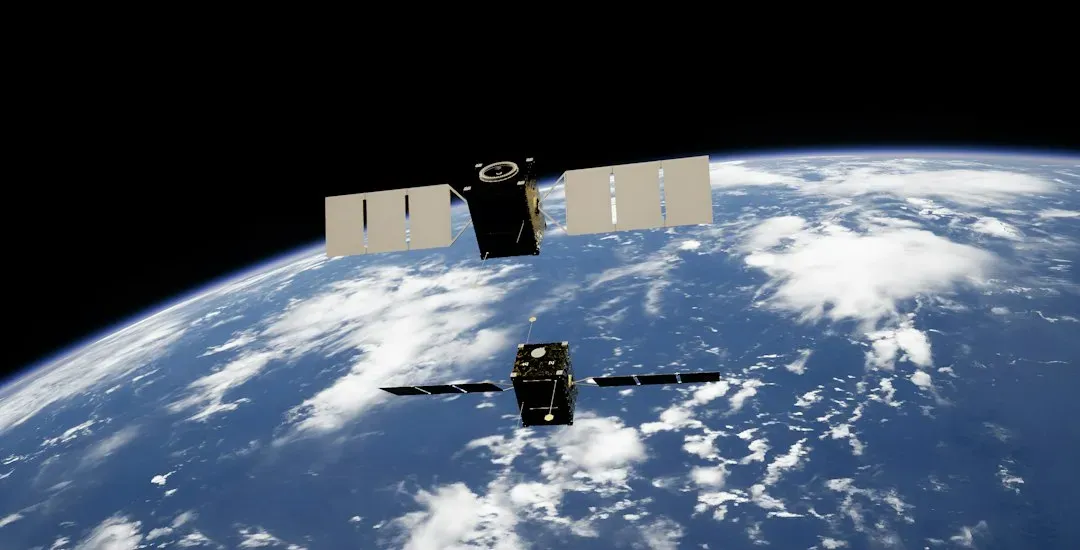
Modern weather monitoring relies on dense networks of automated stations, weather balloons, aircraft reports, and geostationary satellites that provide near-real-time images. These tools capture the fast-moving details needed for accurate short-term forecasts. Data flow continuously into numerical models that simulate the atmosphere hour by hour.
Climate research draws on the same instruments but emphasizes consistent, long-term records from stable sites and reanalysis projects that blend past observations into uniform datasets. Ice cores, tree rings, and ocean sediment samples extend the record further back in time. Together these sources allow comparison across centuries rather than days.
Statistical Analysis in Climate Science
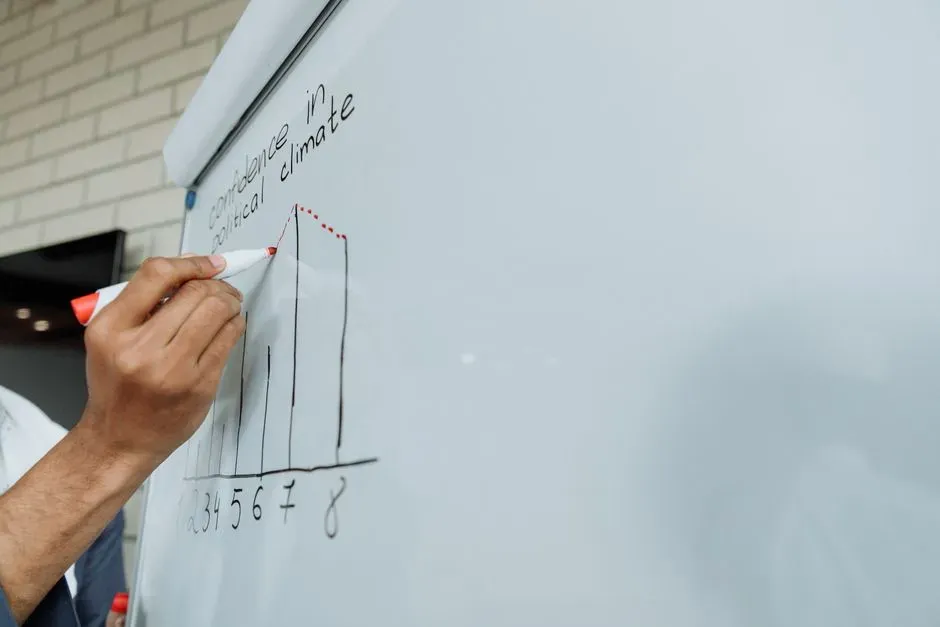
Climate scientists apply statistical techniques to separate random fluctuations from systematic changes. They calculate means, standard deviations, and trends while accounting for natural cycles such as El Niño. This process reveals whether recent warmth or rainfall falls outside the range seen in earlier decades.
Attribution studies go further by running climate models with and without human influences to test how much a particular event or trend can be linked to greenhouse gases. The methods require large ensembles of simulations to build confidence in the results. Rigorous statistics keep conclusions grounded in evidence rather than single observations.
Distinguishing Trends from Variability
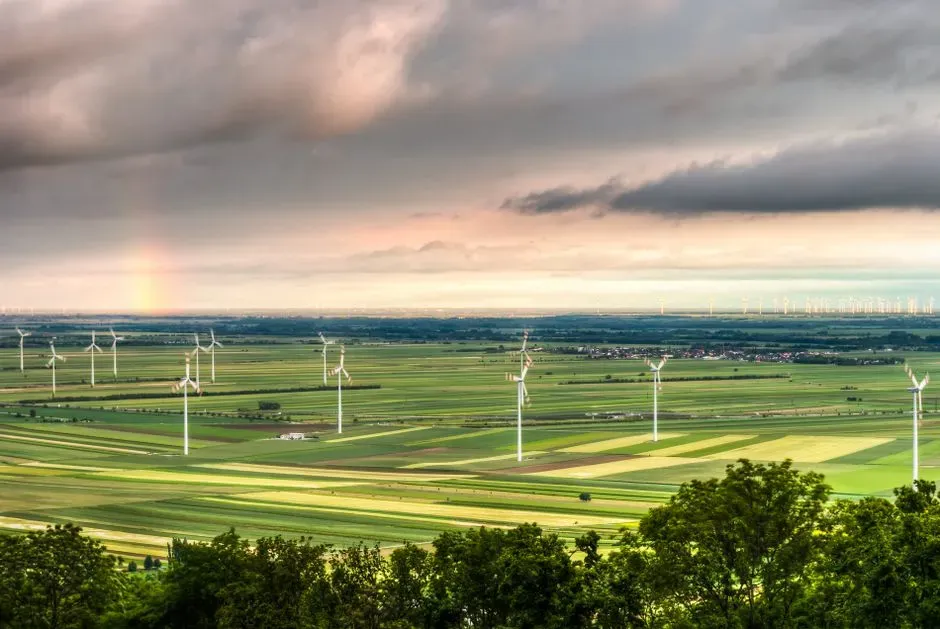
Natural variability produces stretches of unusually warm or cool years even within a stable climate. Scientists therefore examine whether a run of hot summers exceeds what historical variability would predict. Only when the pattern persists across multiple decades do they classify it as a climate trend.
Variability also includes regional differences and seasonal cycles that must be removed before trends become visible. Sophisticated filtering techniques help isolate the longer signal. This step prevents overinterpreting temporary departures as permanent shifts.
Real-World Examples from Recent Years

Record-breaking heat in parts of Europe and North America during 2024 and 2025 illustrated how daily extremes can occur within a warming climate. Individual heat waves still fit the definition of weather, yet their increasing frequency and intensity align with longer-term temperature rises documented in global datasets. The distinction keeps the conversation precise.
Similarly, a single heavy rainfall event does not prove a change in climate, but rising totals in certain regions over thirty years do. Researchers compare these events against historical distributions to determine whether the odds have shifted. Such comparisons rely on the extended record rather than any one storm.
Why the Distinction Matters for Society
Clear separation between weather and climate guides decisions about infrastructure, agriculture, and emergency preparedness. Cities design drainage systems for expected rainfall ranges based on climate data, not yesterday’s downpour. Farmers choose crops suited to projected averages and variability rather than one season’s conditions.
Public communication also improves when the difference is explained plainly. People understand that cold days remain possible even as average temperatures climb. This framing reduces confusion and supports more effective responses to both immediate hazards and gradual changes.
