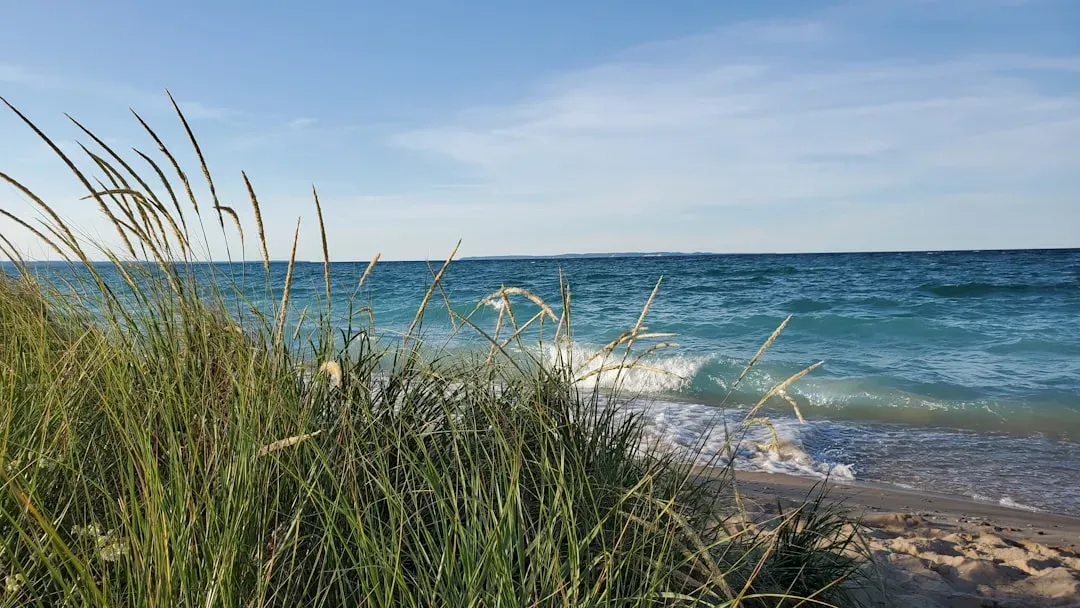


576.02 feet: the record low that kicked off an era of extremes
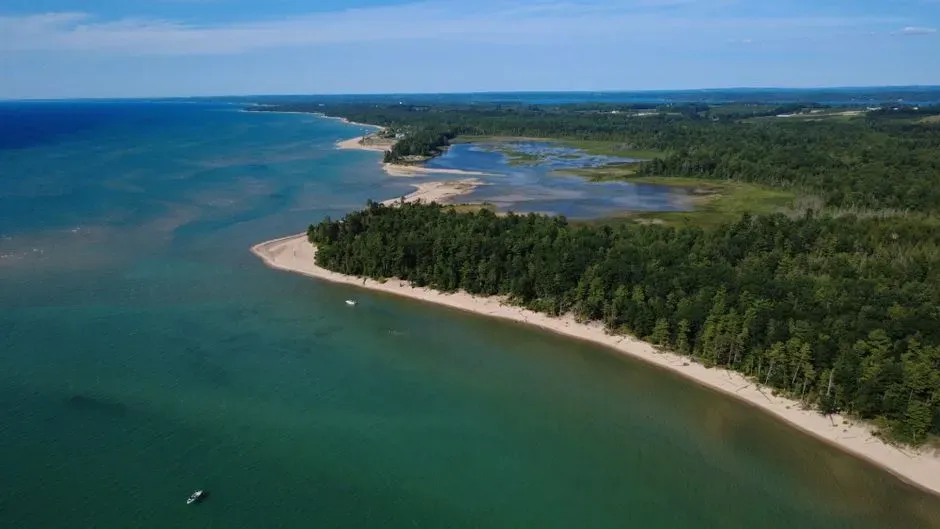
In January 2013, Lake Michigan and Lake Huron, which are hydrologically one body of water, hit their lowest monthly average water level ever recorded, a mark of 576.02 feet, the lowest value on record, which dates back to 1918. That number alone would be notable, but what happened next made it historic. Water levels then climbed with startling speed, and by the summer of 2020 several lakes had set record highs of their own, a swing that reshaped shorelines within a single decade.
That volatility has not settled down. By the end of 2025, Great Lakes water levels had dropped below their long term average for the first time in over a decade, according to the U.S. Army Corps of Engineers, with four out of five of the Great Lakes below average for early January, with Lake Superior at 601 feet, Lakes Michigan and Huron at 577 feet, Lake Erie at 570 feet and Ontario at 244 feet. The lakes still follow their normal seasonal rhythm, but researchers are watching to see whether this pace of change is simply part of the historical pattern or something new.
25 percent: how much ice cover has vanished since the 1970s
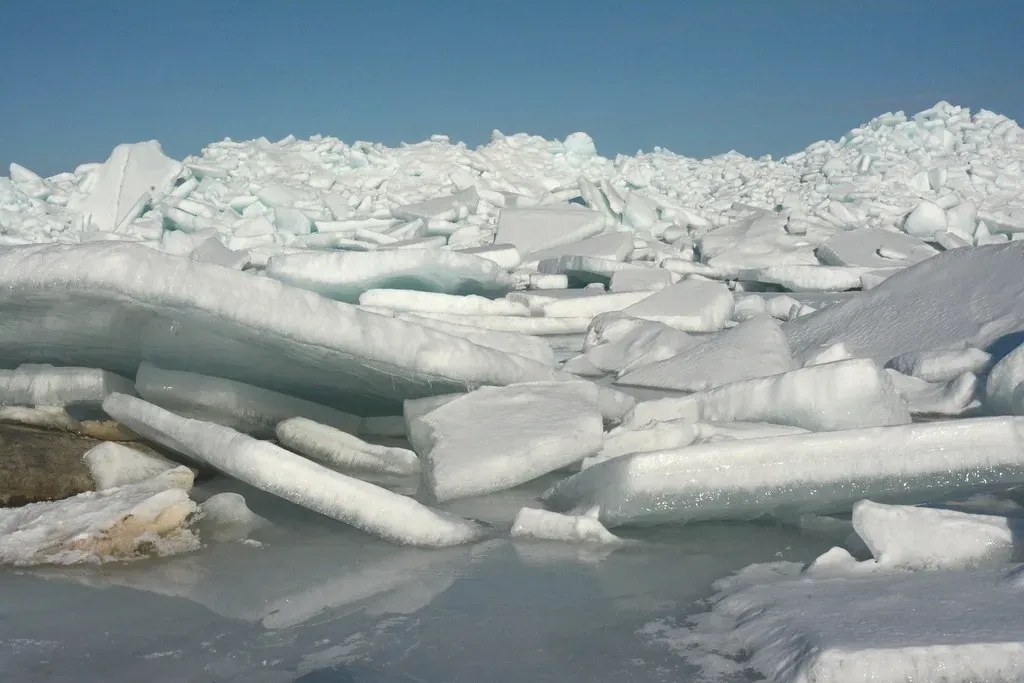
Great Lakes ice tells its own quiet story of change. Over the last half century, ice cover has decreased a total of 25 percent between 1973 and 2023 and the length of the Great Lakes ice season has decreased by almost a month over that same time frame. NOAA scientists have described the trend as a decline of roughly five percent per decade, a figure that sounds modest until it compounds year after year.
The shift is especially visible when comparing the years before and after the 1990s. Researchers at the University of Michigan have found that the lakes have experienced less ice cover on average during the last 20 to 30 years compared to earlier years, prior to the 1990s. Some winters still bring heavy ice, since year to year variability remains real, but the baseline itself has clearly shifted lower.
10,000 per square meter: the mussels that took over the lake floor

Few changes in the Great Lakes over the past three decades have been as thorough as the invasion of quagga mussels. The U.S. Geological Survey has documented that these mussels have largely pushed zebra mussels out of the deeper waters of all five lakes, and in Lakes Michigan, Huron, and Ontario, quagga mussel densities exceed 10,000 individuals per square metre on hard substrates in many locations. A documentary on the invasion put the scale in blunt terms, noting that not millions, not billions, but quadrillions of quagga mussels now populate all of the lower Great Lakes.
What makes this different from earlier invasions is persistence. Zebra mussels arrived first and spread fast, but quagga mussels, which do not need a hard surface to reproduce, have proven tougher and now dominate by sheer numbers. The shift from a mixed population to one almost entirely made up of quagga mussels has unfolded largely within the last three decades, changing the basic chemistry of the lakes along the way.
From about 5 to 12 meters: the water got oddly clear
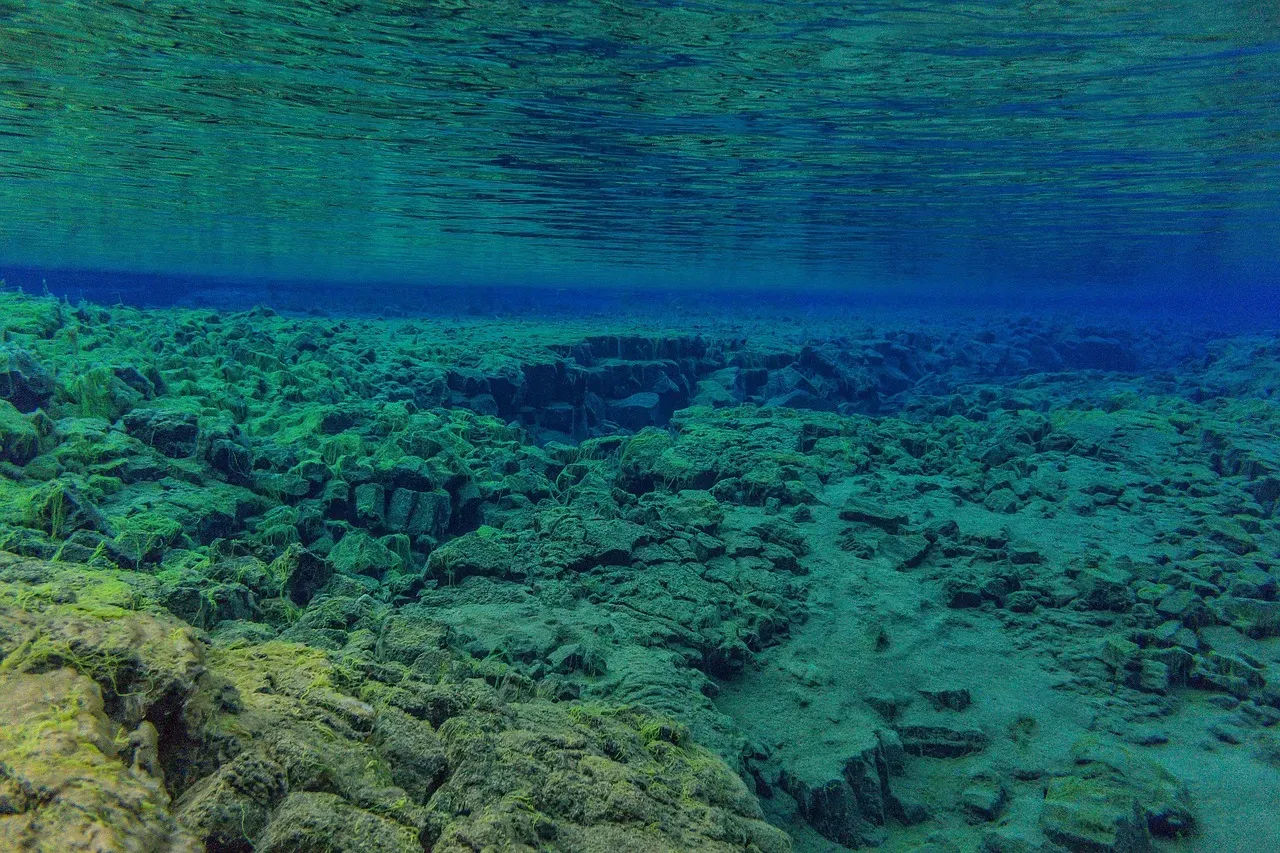
One of the strangest side effects of the mussel invasion is water clarity. In Lake Michigan, Secchi disk transparency measurements have more than doubled since the mid 1990s, from approximately 5 metres to over 12 metres in some offshore areas. That is a dramatic jump for any large lake to experience within a single generation.
The clarity comes at a cost, though. Those same filter feeding mussels strip out the phytoplankton that once fed the base of the food web, and one account of the change put it plainly: there are so many mussels and they are such efficient filter feeders that fewer than every two weeks the entire volume of Lake Michigan is filtered by them, resulting in clear, blue water that’s beautiful but inhospitable for many lake species. Clearer water sounds like good news until you realize it signals a food web quietly being rewired.
23 percent versus 40 percent: the phosphorus cleanup that fell short
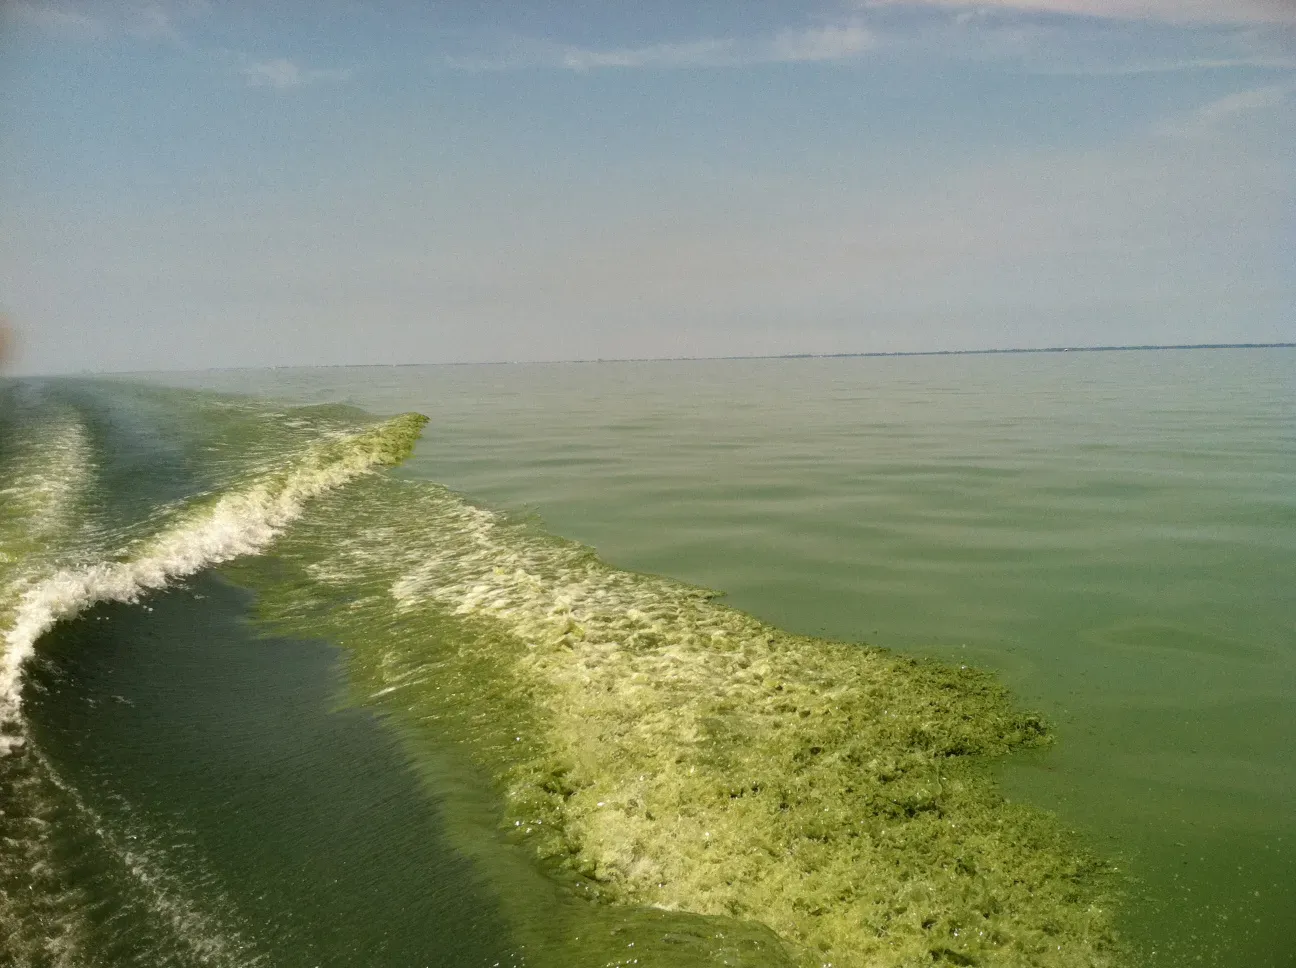
Lake Erie’s chronic algae problem has always come down to phosphorus running off farm fields and lawns. A decade ago, Ohio and Michigan set a goal of cutting phosphorus loads into the western basin by 40 percent from 2008 levels, aiming for progress by 2025. Michigan’s environmental agency reported real gains, noting that total phosphorus loads in the basin are down by nearly 23 percent, exceeding a 20 percent aspirational goal for the basin.
Twenty three percent is meaningful progress, but it still falls well short of the original 40 percent target. Advocacy groups tracking the effort have pointed out that relying mainly on voluntary measures has limited how far the numbers could move, and that the original 2025 deadline came and went without the goal being met. The gap between 23 and 40 percent is, in a sense, the gap between good intentions and what actually gets funded and enforced.
From 10.5 to 2.4: the wild swings in Lake Erie’s algae blooms
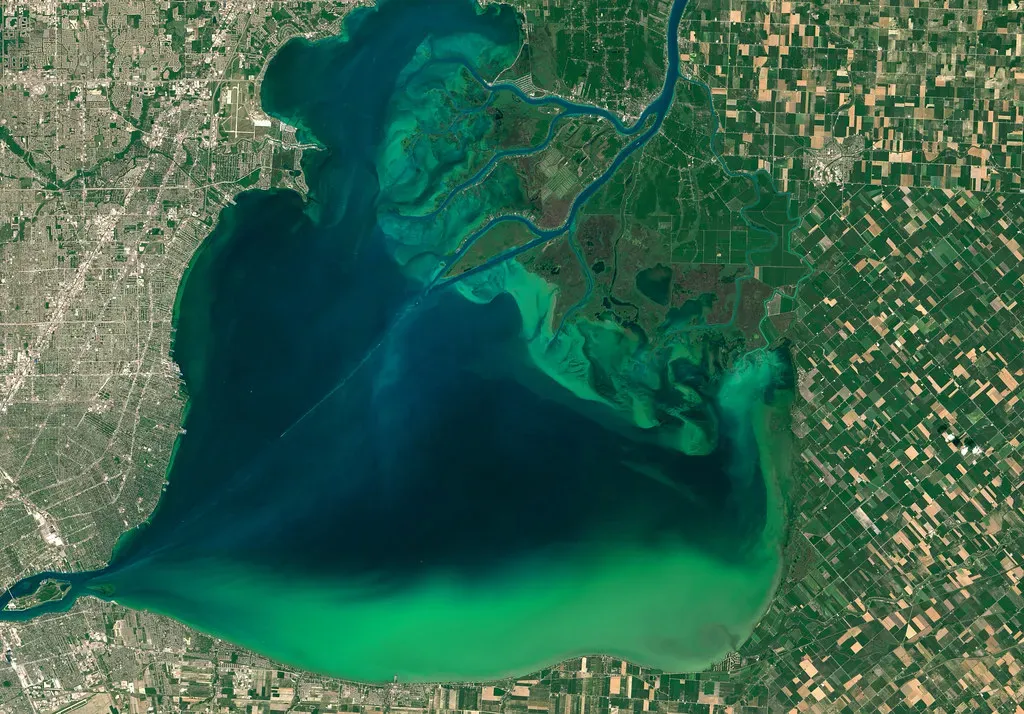
Harmful algal blooms in western Lake Erie are now tracked using a severity index, and the range over the past 15 years has been striking. The two worst blooms on record hit in 2011 and 2015, when NOAA measured the largest blooms occurred in 2011, with a severity index of 10, and 2015, with a severity index of 10.5. Those scores describe blooms with extensive scum and toxin producing cyanobacteria stretching across much of the western basin.
More recent years have looked calmer by comparison, though hardly reassuring. The 2025 season came in far milder, with NOAA reporting that the 2025 western Lake Erie cyanobacterial bloom had a severity index of 2.4, which is considered a mild bloom, and less intense than 2024, which had a severity index of 4.2. Scientists are careful to note that a mild year does not mean the underlying phosphorus problem has been solved, only that weather conditions happened to cooperate.
More than double: extreme heat and cold events on the rise
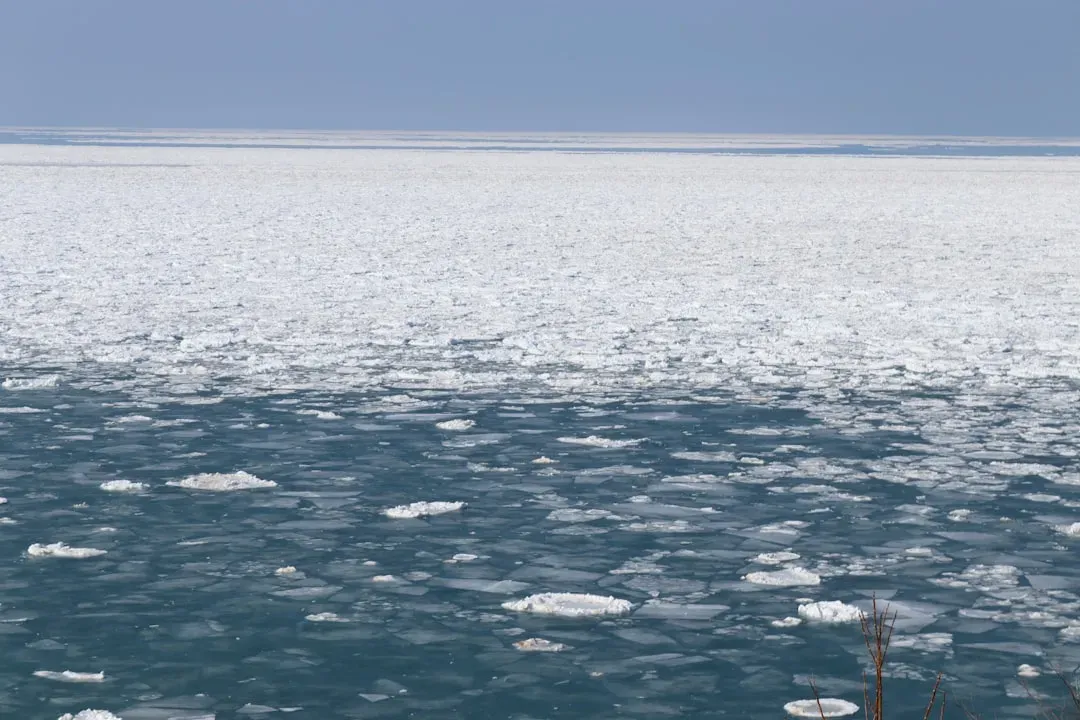
It is not just averages that have shifted, it is the extremes. A University of Michigan study that reconstructed lake surface temperatures back to 1940 found that extreme heat waves and cold spells on the Great Lakes have more than doubled since the late 1990s, coinciding with a major El Niño event. That tipping point in the late 1990s appears to have changed how the lakes respond to weather patterns ever since.
The researchers behind the study were careful to frame this as a genuine break from the past, not just noisy year to year variation. As one of the study’s authors put it, the pattern of heat waves and cold spells today is true today in a fundamentally different way than it was even 30 years ago. For an ecosystem built around fairly predictable seasonal cycles, that kind of instability has ripple effects on fish spawning, ice formation, and water quality alike.
4.5 degrees Fahrenheit: Lake Superior’s outlier warming
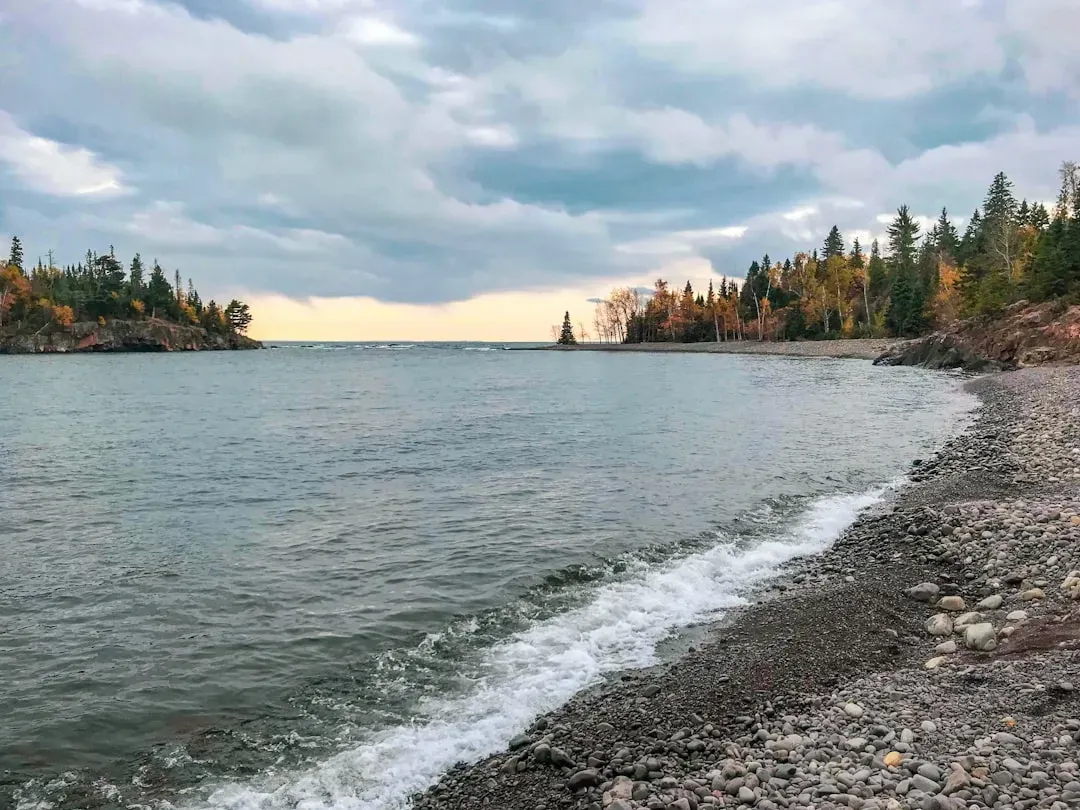
Of all five lakes, Superior has warmed the fastest, which is somewhat counterintuitive given how cold and deep it is. Between 1979 and 2006, Lake Superior summer surface water temperatures increased approximately 4.5 degrees Fahrenheit, a significantly faster rate than regional atmospheric warming. Scientists attribute much of that jump to declining winter ice cover, since less ice means more open water is exposed to sunlight earlier each spring.
The other lakes have followed a gentler but still measurable path. Federal data going back three decades show that since 1995, average surface water temperatures have increased slightly for each of the Great Lakes. It is a smaller number on paper than Superior’s jump, but across five lakes holding roughly one fifth of the world’s surface fresh water, even a slight average increase adds up to an enormous amount of extra heat stored in the system.
What the numbers add up to