Hawaii
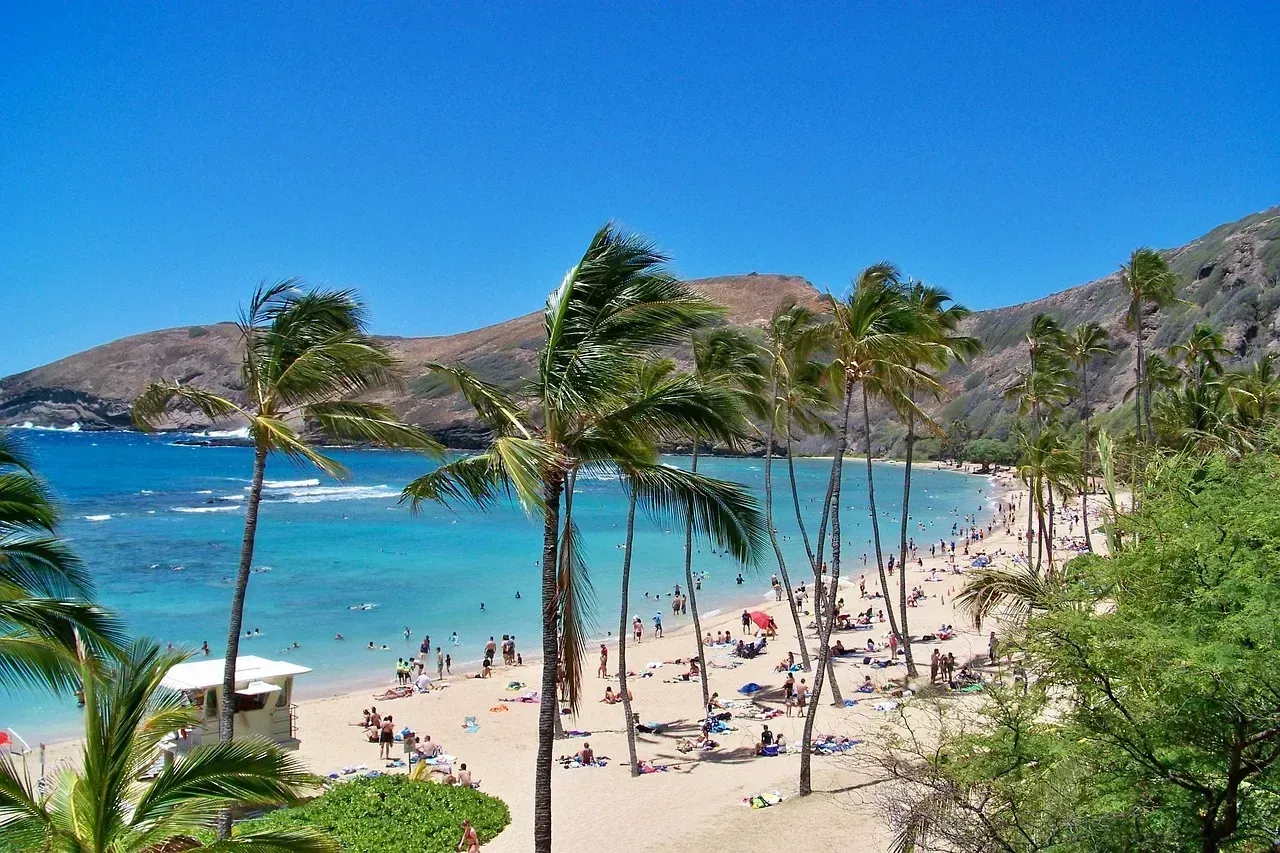
Hawaii sits at the top of the list, and by a wide margin. Hawaii recorded the cleanest tap water with 156.42 water quality violations per 100,000 residents, the best performance across all states. That figure becomes even more striking when you consider how it compares to the bottom of the list.
Alaska’s water systems registered 21,239.63 violations per 100,000 residents, the worst in America and 136 times higher than Hawaii. Hawaii’s isolated water sources, drawn heavily from volcanic aquifers, combined with strict monitoring protocols, appear to give the state a real advantage over mainland systems that deal with more varied and often older infrastructure.
California

California might surprise some readers given its size and the sheer number of water systems it operates, but the state performs remarkably well in the EPA’s violation data. California claimed second place with 179.58 violations per 100,000 people. For a state with tens of millions of residents and thousands of individual water systems, that is a notable achievement.
Much of California’s progress traces back to years of regulatory pressure following high profile contamination cases in smaller communities. The state has invested heavily in monitoring technology and enforcement, which seems to be paying off in the aggregate numbers even though pockets of trouble remain in rural areas.
Minnesota
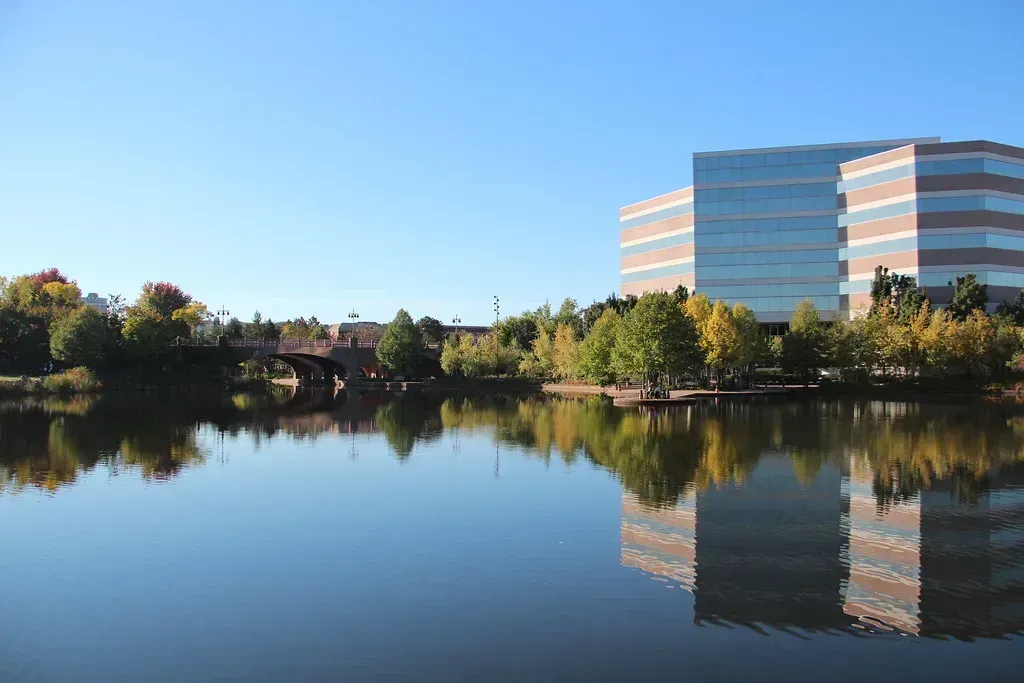
Minnesota rounds out the top three, and its geography plays an obvious role. Minnesota secured third with 184.18 violations per 100,000 residents. The state benefits from an unusual abundance of clean freshwater sources.
Minnesota has a unique mix of lakes, rivers, and large aquifers. That natural advantage, paired with consistent state-level oversight of treatment plants, helps explain why Minnesota keeps showing up near the top of national water quality comparisons year after year.
Tennessee
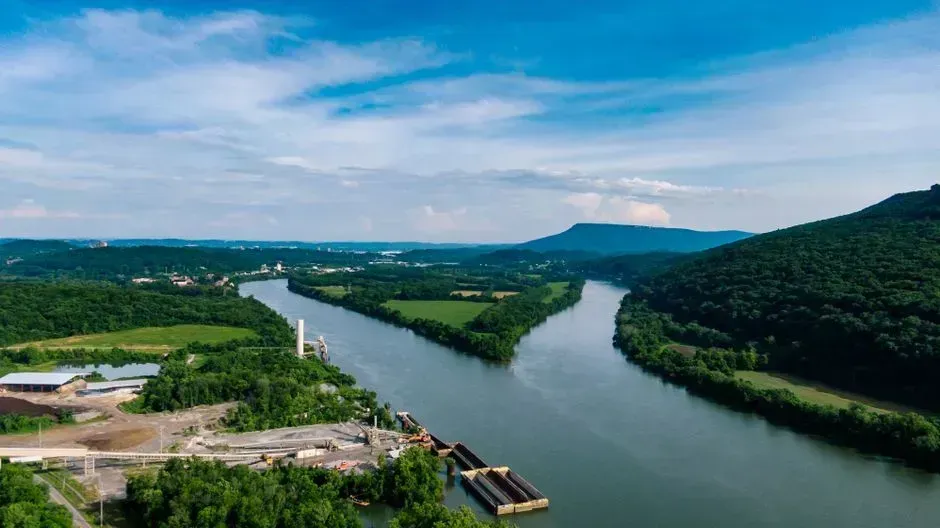
Tennessee’s fourth place finish is a bit less intuitive given the state’s mix of urban and rural water systems, but the numbers hold up. Tennessee ranked fourth with 187.33 violations per 100,000 residents. That places it just behind Minnesota and well ahead of the national middle tier.
Tennessee’s rivers and reservoirs give utilities a reasonably stable source of raw water to treat, and the state’s larger metro systems, particularly around Nashville and Memphis, have made steady investments in treatment upgrades over the past several years. Rural systems still lag in some counties, but they have not been enough to drag down the statewide average.
Delaware
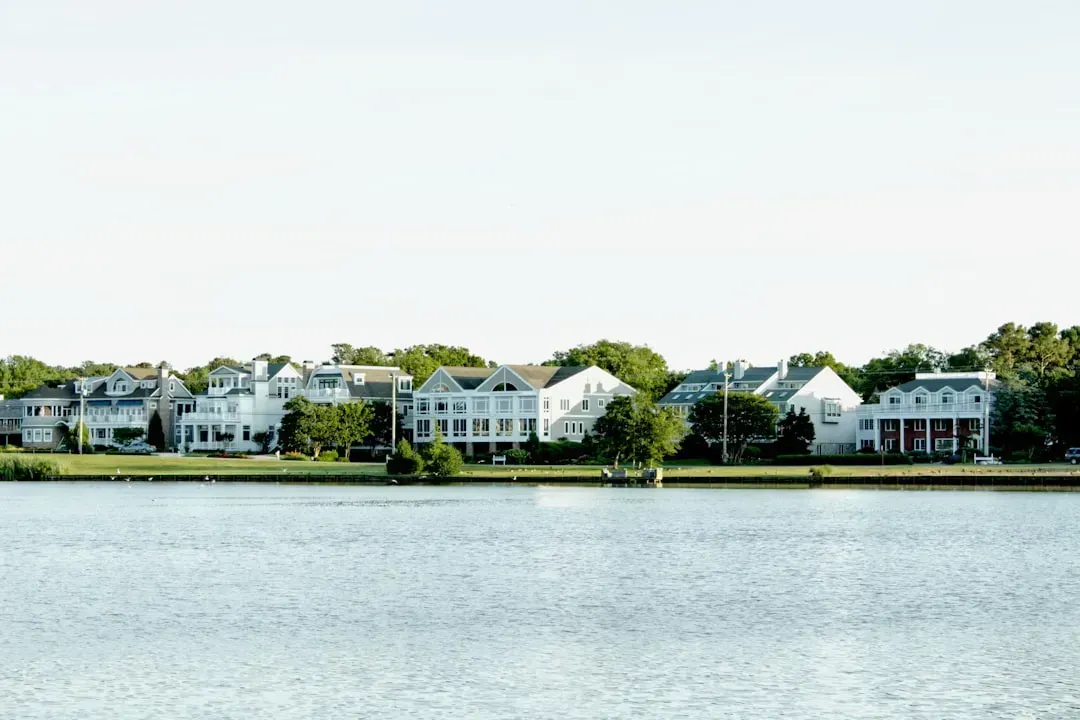
Delaware is a small state, but its water systems punch above their weight in the EPA rankings. Delaware placed fifth with 190.80 violations per 100,000 residents. Given the state’s compact size, its handful of major utilities are easier to monitor closely and bring into compliance quickly when issues arise.
Delaware’s coastal aquifers do face long-term concerns tied to saltwater intrusion and agricultural runoff, but the state’s regulatory agencies have generally kept those risks from translating into frequent violations. Consistent testing schedules and a manageable number of systems statewide seem to be the deciding factors here.
Alabama
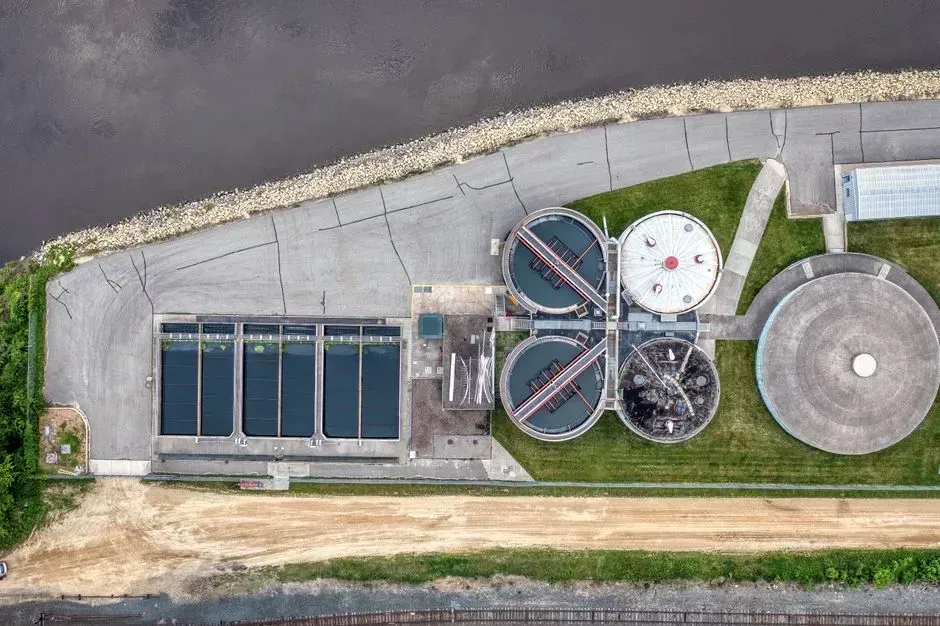
Alabama’s sixth place ranking might catch some readers off guard, since the state does not typically top lists focused on environmental performance. Still, the data is the data. Alabama came in sixth with 233.01 violations per 100,000 residents.
Alabama draws much of its municipal water from rivers and groundwater sources that, while not immune to contamination risks, have generally supported consistent treatment outcomes. The state’s larger urban utilities in Birmingham and Huntsville have modernized treatment processes over the last decade, which likely contributes to the relatively low violation rate compared to many other southern states.
Rhode Island
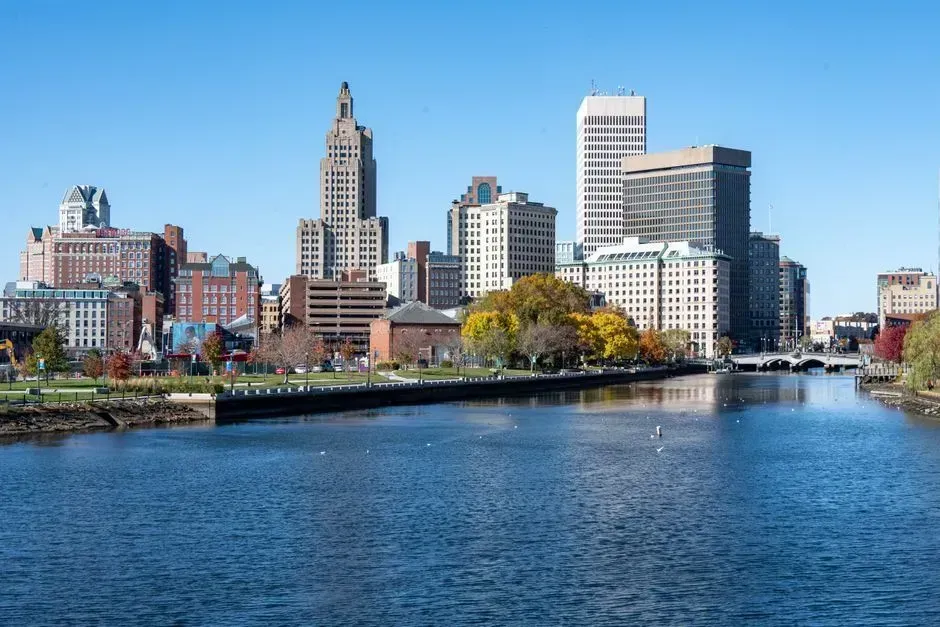
Rhode Island closes out the top seven, and local coverage of the rankings made a point of highlighting the state’s placement. Rhode Island ranked seventh with 243.30 violations per 100,000 residents. That is a solid showing for one of the smallest and most densely populated states in the country.
Rhode Island’s compact geography means fewer, larger water systems serve most of the population, which simplifies oversight considerably. The state has also leaned on regional cooperation between municipalities to share testing resources and treatment infrastructure, an approach that seems to be reflected in its consistently low violation counts.
What the data does and does not tell you

It is worth pointing out that these rankings measure reported violations, not the complete picture of water safety in every neighborhood. The Safe Drinking Water Information System contains information about public water systems and their violations of EPA’s drinking water regulations, as reported to EPA by the states, and these regulations establish maximum contaminant levels, treatment techniques, and monitoring and reporting requirements to ensure that water systems provide safe water to their customers. That means the numbers reflect what gets reported and caught, not necessarily every risk that exists in every pipe.
The number of violations within each system is not taken into account, and estimates are not available for the number of people who consume infected water or get ill from consumption, and not all violations are equivalent, since some violations occur but are addressed quickly, while some violations can linger for years. In other words, a state near the top of this list can still have a handful of struggling rural systems, just as a state further down the list may have excellent water in most of its major cities. Checking your own local Consumer Confidence Report remains the most reliable way to know what is actually in your glass.

- The 7 States With the Cleanest Municipal Water Systems, According to EPA Data - September 13, 2026
- The 6 Coldest Inhabited Places on Earth – Ranked by Average Winter Temperature - September 12, 2026
- 8 South American Climate Scientists Who Changed How We Understand the Amazon - September 12, 2026
