

What “Solar Saturation” Actually Means
Solar saturation describes a point where a grid, or a specific part of it, has more solar generation available than it can absorb, move, or use at a given moment. It is not about running out of sunlight. It is about running out of room on the wires, in the market, or in the balance between supply and demand.
The term applies at two very different scales. At the transmission level, it shows up as an entire regional grid producing more midday power than the whole system needs. At the neighborhood level, it shows up as a single distribution feeder or transformer that simply cannot accept another rooftop array without upgrades.
The Duck Curve: Where the Problem Started
The clearest illustration of saturation is the so called duck curve, a term created by the California Independent System Operator in a 2013 report. It describes what happens to net electricity demand across a day once solar output is subtracted out: a deep midday dip that looks like a duck’s belly, followed by a steep evening climb as the sun sets and everyone gets home and turns things on.
California remains the textbook case. By 2024, the state had over 46 gigawatts of solar capacity, and midday net load could drop to as low as 8,000 megawatts on sunny spring days, while the evening ramp required up to 17,000 megawatts of generation to come online in just three hours. Wholesale prices during that swing can move from negative in the afternoon to well over 100 dollars per megawatt hour a few hours later, according to the same analysis. Hawaii has an even more extreme version of this pattern, nicknamed the “Nessie Curve” for its monster-like proportions, since solar there covers a huge share of daytime demand.
Curtailment: Paying to Throw Power Away
When there is simply too much solar for the grid to absorb, operators curtail it, meaning they order plants to reduce output even though the sun is shining and the panels are capable of producing. The Department of Energy describes this plainly: high solar adoption creates the potential for PV to produce more energy than can be used at one time, called over-generation, which leads system operators to curtail PV generation, reducing its economic and environmental benefits.
The scale of this waste has grown quickly. In recent years, CAISO has curtailed in excess of 2 million megawatt hours of utility-scale wind and solar output annually, and during just the first four months of 2025, CAISO curtailed more than 738,000 megawatt hours. Texas is heading the same direction, since curtailments are also on the rise in Texas as wind and solar energy capacity have grown in recent years.
Negative Prices and the Economics of Oversupply
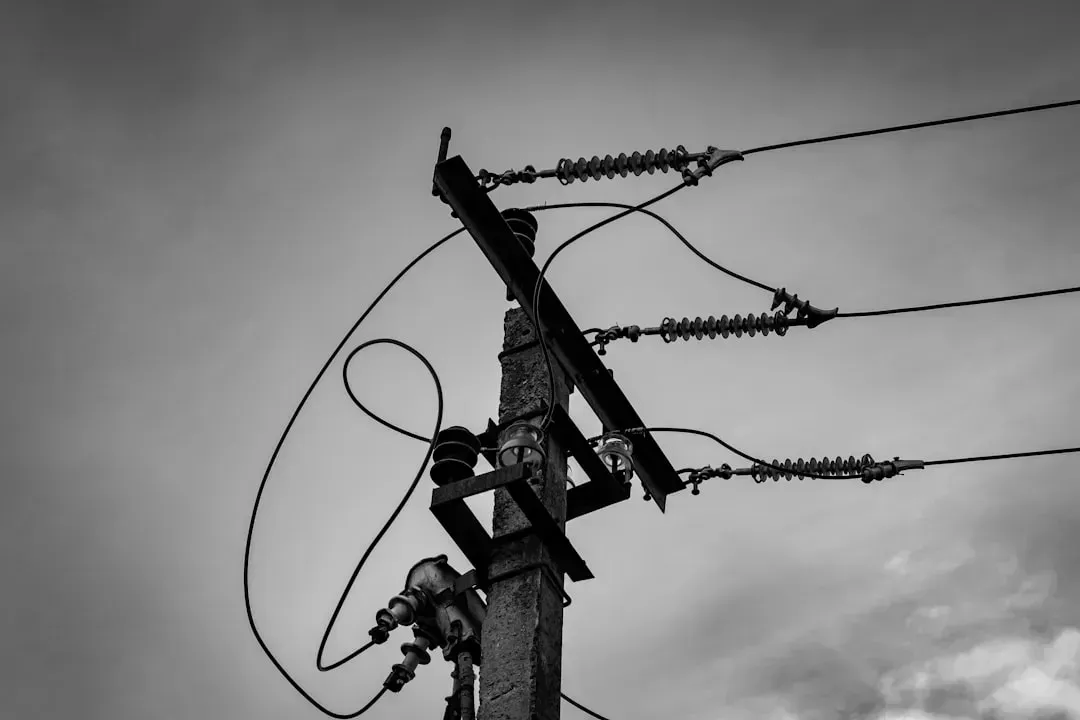
Curtailment is the physical response to saturation, but negative pricing is its financial mirror. When there’s more supply than demand at a given moment, the wholesale price can fall below zero, meaning generators effectively pay someone to take their electricity rather than shut down and restart later. Analysts have tracked this closely in California’s SP15 price hub, where there were roughly 1,180 hours in 2024 that had below-zero prices, about 13% of total hours throughout the year, compared with roughly 530 hours in 2023, about 6% of total hours.
The trend isn’t just more frequent, it’s also deeper. The median negative price in 2024 was about negative 17 dollars, compared with about negative 10 dollars in 2023, indicating that both the frequency and magnitude of negative prices have increased over the last year. Behind that number sits a simple structural fact: in 2024, the average net demand during midday hours between 9 a.m. and 3 p.m. had decreased by 45% since 2020 across the CAISO grid, as more and more solar pushed conventional demand off the books.
Hosting Capacity: The Neighborhood-Level Bottleneck
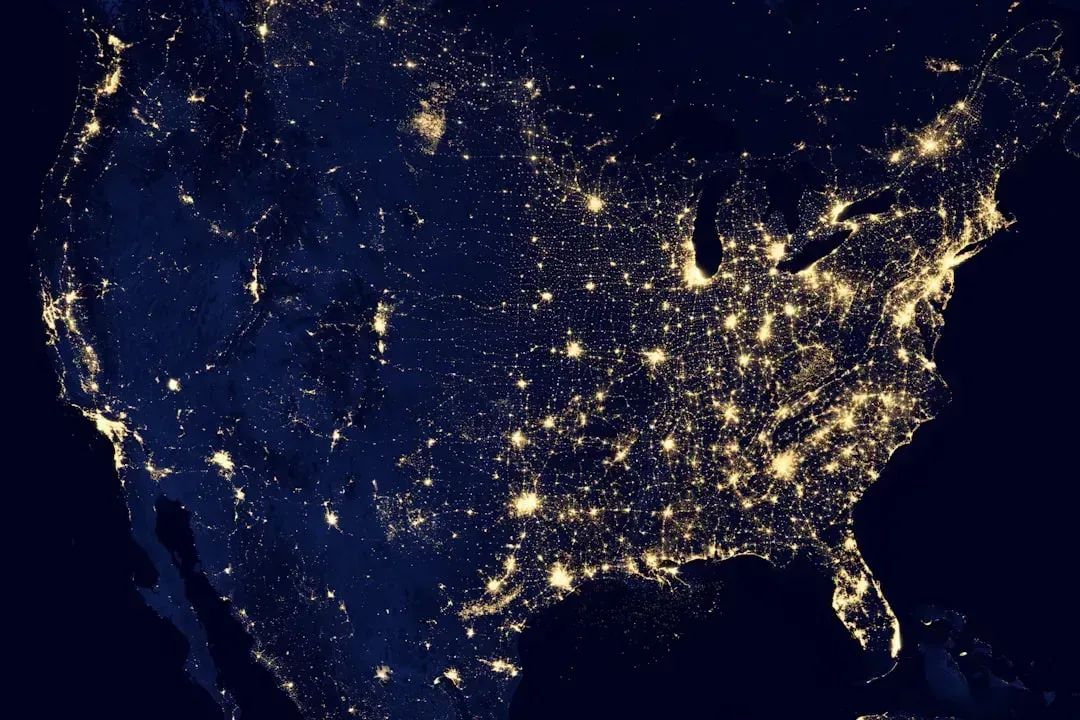
Saturation isn’t only a state-wide phenomenon measured in gigawatts. It also happens circuit by circuit, on the low-voltage lines that run down individual streets. Utilities now publish hosting capacity maps to show where a feeder still has room for new solar and where it doesn’t, and the underlying logic is unforgiving: if the feeder has no available hosting capacity, then it does not matter what the results for the local secondary system is, as the primary feeder circuit is not capable of hosting more without further modification to the system.
These tools have become essential planning aids rather than novelties. As one industry group puts it, hosting capacity analyses provide a snapshot in time of the conditions on a utility’s distribution grid that reflect its ability to host additional distributed energy resources at specific locations, without the need for costly grid upgrades or lengthy interconnection studies. In practical terms, that means a homeowner in one zip code might get a quick, cheap solar interconnection, while a neighbor a few miles away on an already saturated feeder faces months of delay and a bill for equipment upgrades.
Voltage Rise and the Physics of Too Much Local Power
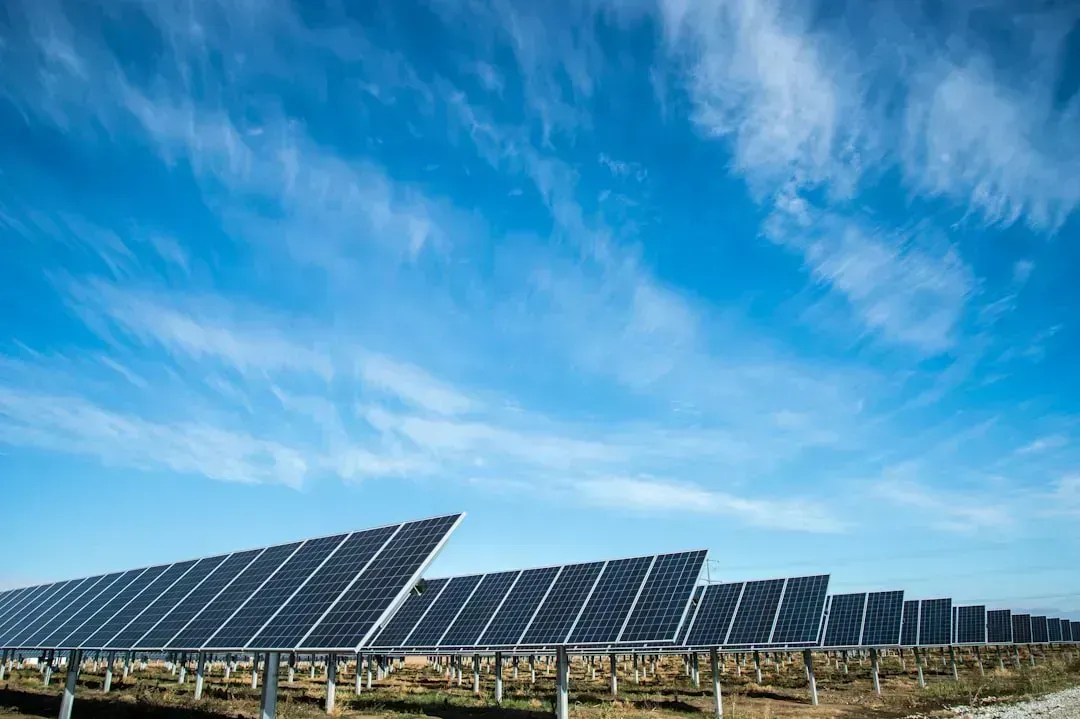
The technical reason a single circuit can only host so much solar comes down to voltage. Distribution lines are engineered to carry power in one direction, from substation to customer, within a narrow voltage band. When rooftop solar pushes electricity backward onto that line during sunny afternoons, voltage can rise beyond safe limits, and researchers studying this reverse power flow problem note that managing the reverse power flow limit requires a multifaceted approach, where network operators should consider implementing advanced inverter functions that can regulate power output and mitigate reverse flow, alongside enhancing grid infrastructure and incorporating energy storage systems to absorb excess generation.
The severity of this constraint varies by neighborhood type. One case study comparing real feeders found that the feeder representing an urban area with many industrial and business customers has a higher hosting capacity, 31% of full load, compared to the feeder representing rural areas, which has 18%. That gap explains why suburban and rural customers often hit hosting capacity limits faster than their city counterparts, even with similar rooftop demand.
The Evening Ramp: Grid’s Hardest Few Hours
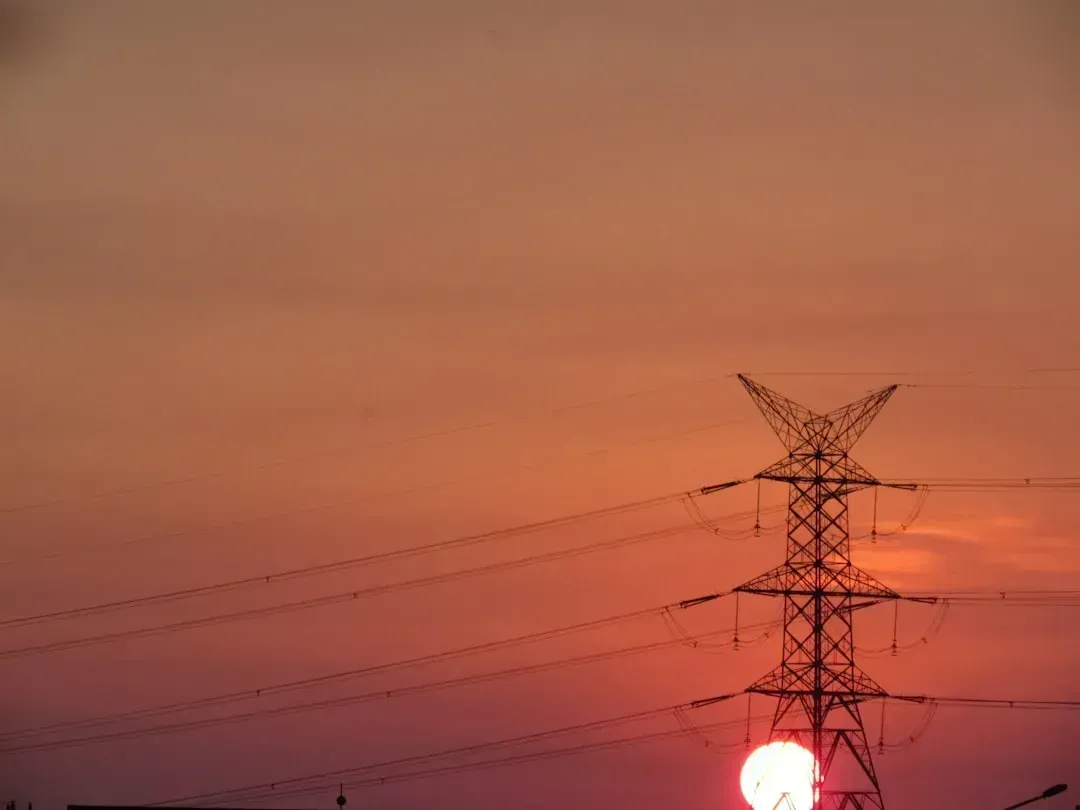
Saturation during the day creates a mirror-image stress a few hours later. As the federal government’s own explainer notes, the extreme swing in demand for electricity from conventional power plants from midday to late evenings, when energy demand is still high but solar generation has dropped off, means that conventional power plants must quickly ramp up production to meet consumer demand, and that rapid ramp up makes it more difficult for grid operators to match supply with demand in real time.
This ramp problem has an economic side effect too. Because solar has eaten into the hours when gas plants used to run profitably, the dynamics of the duck curve can challenge the traditional economics of dispatchable power plants because the factors contributing to the curve reduce the amount of time a conventional power plant operates, which results in reduced energy revenues. Some flexible gas plants have simply become less viable to keep running, which paradoxically makes the grid more dependent on the ones that remain during that steep evening climb.
How Batteries Are Changing the Equation
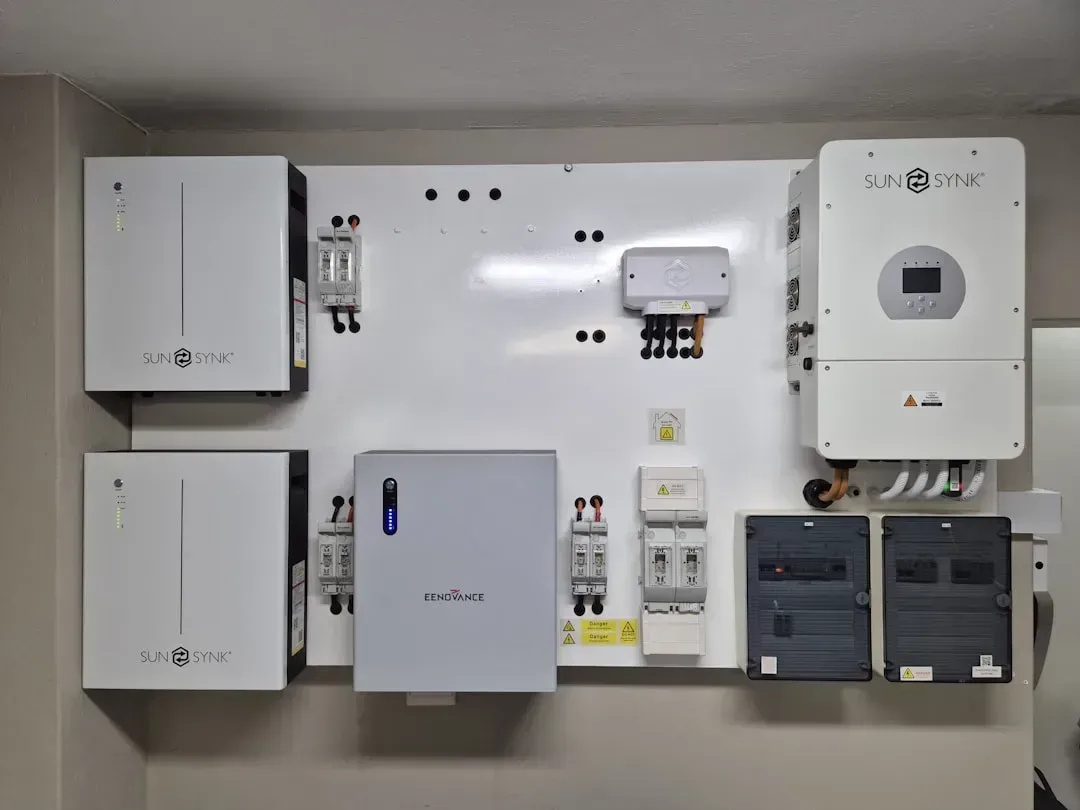
Battery storage has emerged as the most direct fix for daytime saturation, since it can soak up excess solar at noon and release it during the evening peak. The scale-up has been dramatic: California has seen explosive battery growth, expanding nearly twentyfold from 0.6 gigawatts in 2020 to 11.7 gigawatts in 2024, making up nearly half of total national utility battery capacity. Texas is moving fast too, having installed more new utility-scale battery capacity, 3.9 gigawatts, than California in 2024, doubling its total from 3.6 gigawatts in 2023 to 7.5 gigawatts.
The results are measurable on the price side as well. Storage has been shown to be raising the value of negatively priced solar electricity by up to 42 dollars per megawatt hour in the CAISO wholesale market, essentially buying up cheap or negative-priced solar rather than letting it go to waste. Even so, batteries alone haven’t solved the problem. In one recent stretch, curtailment in California actually rose in absolute terms even as batteries expanded, because generation cuts rose 4.1% and March registered a 28% higher peak, showing that the solution involves a combination of storage, smart grids, and active demand management.
Policy Responses: NEM 3.0 and the Push Toward Self-Consumption
California’s answer to rooftop saturation has been to rewrite the economics of exporting solar to the grid. Under the state’s Net Billing Tariff, commonly still called NEM 3.0, the policy features a 75% reduction in export rates, the value of excess electricity pushed onto the grid by solar systems, thereby reducing overall savings and increasing the payback period of home solar. The explicit goal was to nudge homeowners toward pairing solar with batteries instead of simply dumping power onto an already crowded midday grid.
The shift in rates has been steep in practical terms, moving from an average of 30 cents per kilowatt hour to 8 cents per kilowatt hour for exported electricity. Other states are experimenting with softer versions of the same idea. In Colorado, regulators recently ordered a major utility to offer a flexible interconnection or energization tariff that optimizes the use of existing grid infrastructure by allowing developers to connect new load or generation projects in constrained locations that would otherwise require capacity upgrades, trading some curtailment risk for a faster, cheaper connection.
Interconnection Queues and the Slow Path to New Capacity

Saturation on the ground is compounded by a slower moving bottleneck in the paperwork. Large solar and battery projects often wait years in interconnection queues before they’re allowed to connect at all, and that backlog has been shifting in an unusual direction. A December 2025 review found that while queue capacity dropped for the first time in 2024, it was not solely due to increased efficiency, and that though record amounts of large-scale solar, 31 gigawatts, and battery storage, 11 gigawatts, completed interconnection and began operating, new solar and battery storage capacity entering the queue declined sharply along with an increase in withdrawals.
Part of the slowdown traces back to the saturation problem itself. Developers are more hesitant to enter queues for regions where curtailment risk and constrained hosting capacity make a project’s economics shaky from the start. The same review pointed to systemic causes as well, noting that the absence of standardized, transparent data and processes has lengthened study timelines, and transmission system limitations and mismatches in regional planning often mean that grid expansion lags behind actual resource interconnection needs.
Where the Problem Goes From Here
Solar saturation is not a sign that the technology has failed or that the buildout should slow down. It is closer to a growing pain, the natural friction that shows up when a grid designed for one-directional, dispatchable power has to absorb a flood of variable, distributed generation faster than transmission lines, transformers, and market rules can adapt.
The fixes already underway, more batteries, smarter inverters, flexible interconnection tariffs, and better hosting capacity data, are gradually closing the gap, even if unevenly across states and utilities. California’s experience suggests the tools work, since curtailment decreased by 12% in relative terms between January and May 2025, despite an 18% increase in solar generation during the same period. Other states now watching that experiment closely will decide, largely through their own regulatory choices, whether they repeat California’s early stumbles or skip past them.
