

The 2023 USDA map update changed the baseline for millions of gardeners
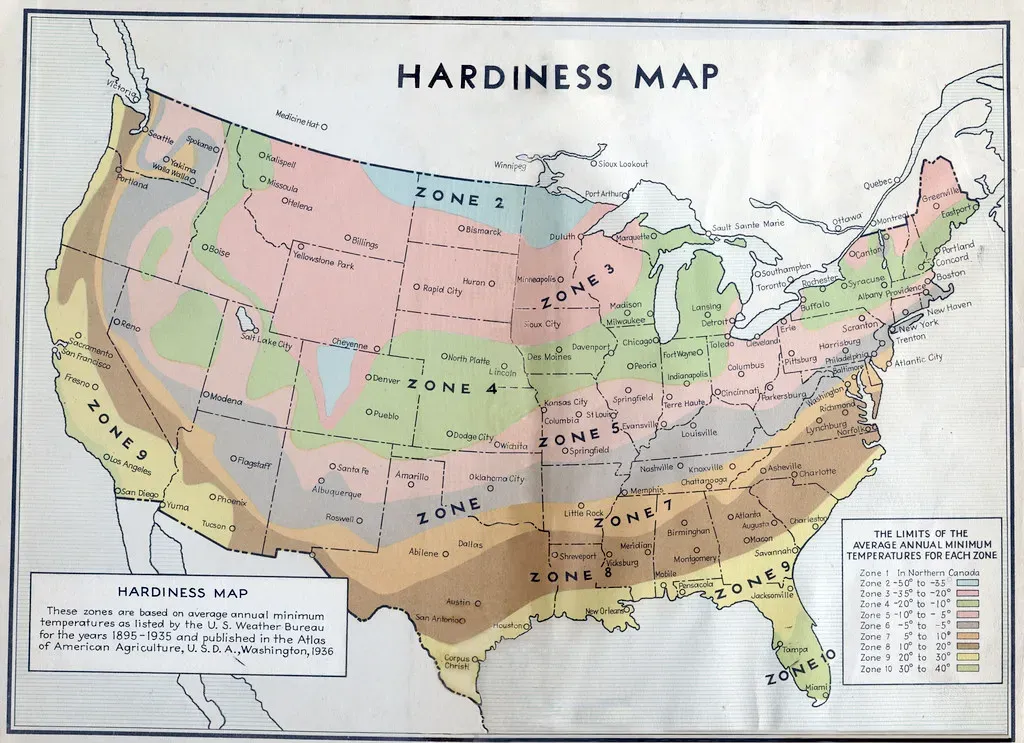
In late 2023, the USDA released its first updated Plant Hardiness Zone Map in over a decade, replacing the version gardeners had relied on since 2012. Late last November, the United States Department of Agriculture released an updated Plant Hardiness Zone map for the United States, marking the first time this national map had been updated since 2012. The new edition didn’t just tweak a few lines on a chart. It reflected three decades of fresh temperature data pulled from a far denser network of weather stations than before.
The 2023 map uses data from 13,412 weather stations, up from 7,983 in 2012. That extra detail matters because it means the new zones aren’t just warmer in a general sense, they’re also more precise about where exactly those warmer pockets sit. For a home gardener trying to decide whether a fig tree will survive the winter, that precision is the whole point of the map.
About half the country moved into a warmer half zone
The headline number from the update is straightforward, even if the implications are not. If you average the change between these two maps over the entire lower 48 states, you get about two and a half degrees Fahrenheit warming, according to Chris Daly, the climate scientist who led the mapping project. That might sound modest, but in gardening terms it’s enough to push a plant from marginal survival to reliable growth, or the other way around for a plant already at its cold limit.
Daly says the new map means about half the country has shifted into a new half zone and half hasn’t. The other half stayed put, at least officially, which is a reminder that this shift is uneven rather than uniform. Where you garden determines whether you’ve felt any of this at all, or whether you’ve felt it dramatically.
Some regions warmed far more than others
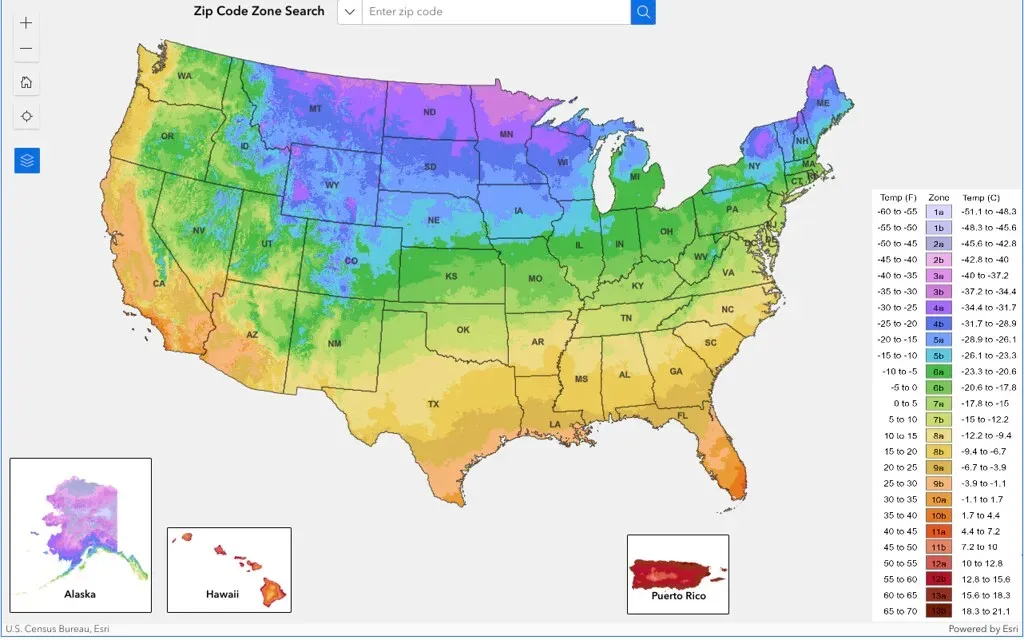
Averages hide a lot of local drama, and this update is a good example of that. Arkansas, Kentucky, Missouri and Tennessee had the biggest changes, as much as five degrees Fahrenheit warmer than the 2012 map. Gardeners in those states didn’t just nudge up a fraction of a zone, they leapt.
Other pockets of the country saw even more dramatic swings over a similar stretch of time. In some areas, including the central Appalachians, northern New England and north central Idaho, winter temperatures have warmed by 1.5 hardiness zones, or 15 degrees Fahrenheit, over the same 30-year window. That’s the kind of change that can genuinely alter what belongs in a garden bed versus what belongs in a greenhouse.
Winters are warming faster than summers, and that matters for plants

One detail that often gets lost in the zone conversation is which season is actually driving the change. It isn’t scorching summer afternoons pushing the numbers around. Climatological winter seasons have warmed faster than any other season over the past century, and in the winter, nighttime low temperatures have increased at a faster rate than daytime high temperatures.
That distinction matters because hardiness zones are built entirely around winter extremes, not summer heat. The U.S. is divided into 13 plant hardiness zones based on the local coldest temperature of the year, averaged over 30-year periods, with each zone spanning a 10 degree Fahrenheit range. A milder cold snap in January, repeated over three decades, is exactly what nudges a region into a warmer classification.
Growing seasons are stretching longer on both ends
Zone shifts are one measurement, but frost dates tell a more everyday version of the same story. In North Carolina, climate change has already led to measurable changes in the length of the growing season, with Wilmington’s growing season lengthening by about 1.2 days per decade. Multiply that across regions and decades and the extra weeks start to add up.
Fall is where the change shows up most clearly for many gardeners. The first fall freeze is happening 9 days later compared to what was observed 75 years ago, according to a National Weather Service climate program leader quoted in that same regional analysis. A later first frost means more time to ripen tomatoes, more time for a second round of beans, and a little more room for error when fall planting runs late.
Gardeners are experimenting with plants that once seemed off limits
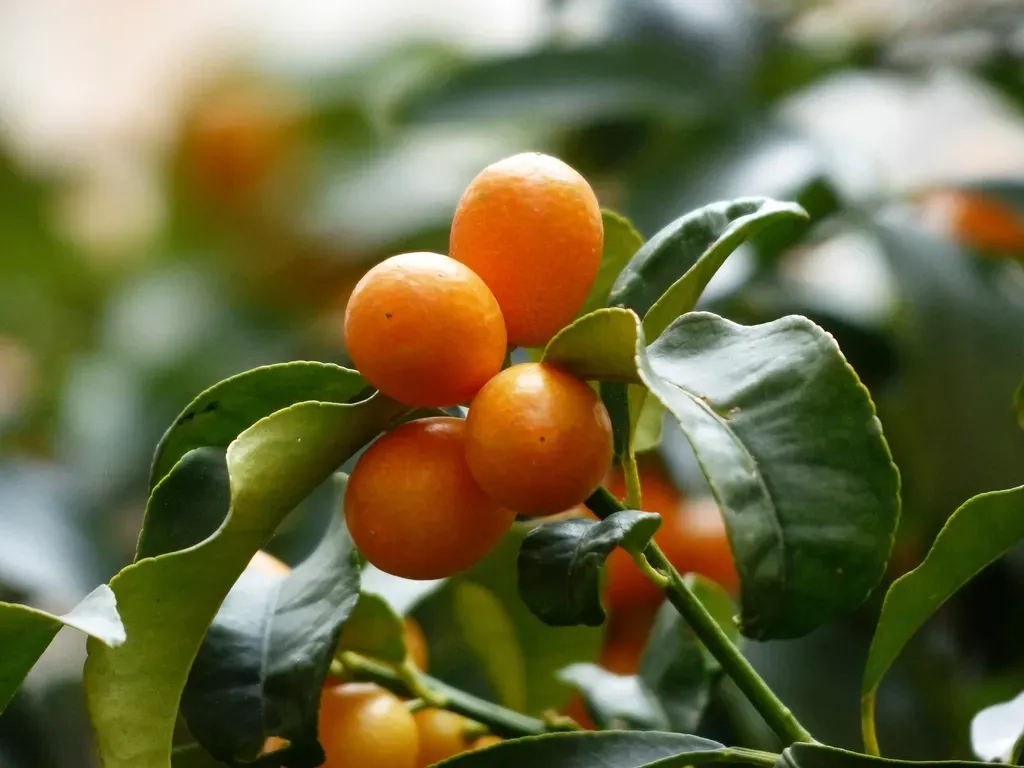
Curiosity tends to follow opportunity, and a lot of gardeners have started testing the edges of what their new zone allows. In central Arkansas, one longtime gardening consultant watched her region move from zone 7b to zone 8a and started rethinking her plant list entirely. What that means for her is that she’s now considering growing kumquats, mandarin oranges, and shampoo ginger, a tropical plant.
That kind of experimentation is happening well outside the traditional citrus belt too. In Philadelphia, an urban orchard project has been testing crops that would have seemed absurd there a generation ago. The Philadelphia Orchard Project plants food gardens and orchards at schools, parks, and other sites, and in an unheated greenhouse called a high tunnel, they’re experimenting with crops from warmer regions, not just bananas, but yuzu, kumquat, ginger, olives, guava, and capers. Not every experiment succeeds, but the fact that these trials are happening at all says something about how far the boundaries have moved.
Warmer zones also invite new pests and plant diseases
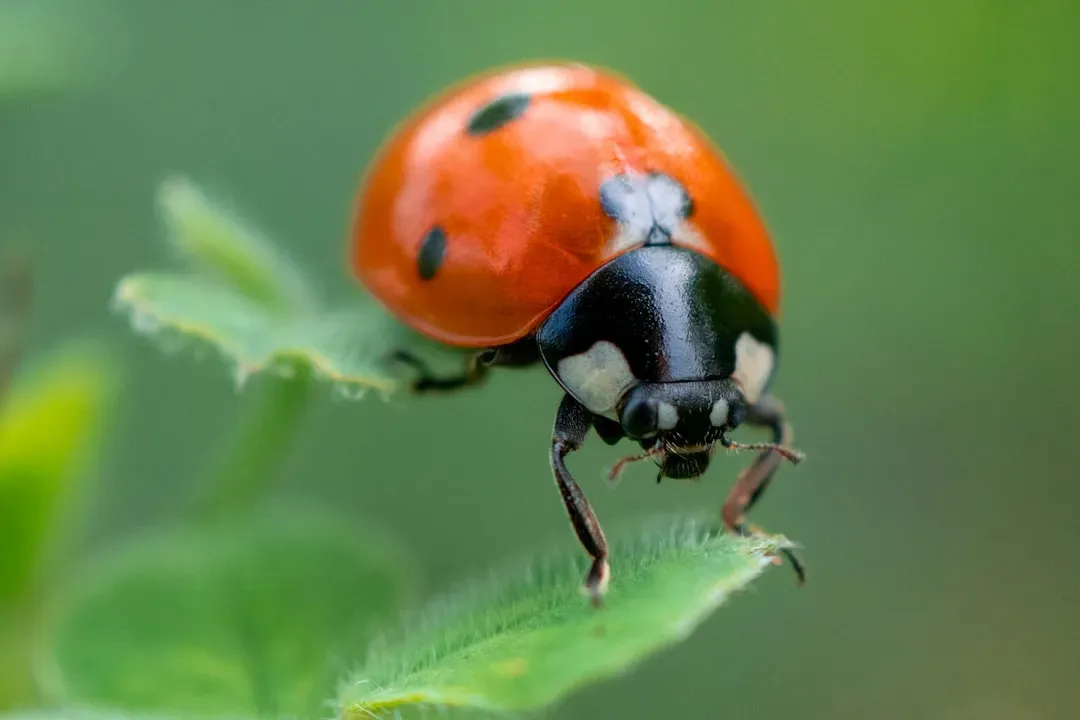
A longer growing season and milder winters aren’t purely good news for the garden. Insects and pathogens follow the same temperature cues that plants do, and many of them are shifting their ranges right alongside the crops. The changes in temperature affect more than the plants that can grow in a zone, since a warmer climate means new pests and diseases, and gardeners must be aware of which pathogens or insects might be moving into their area as the climate warms.
That reality is pushing some growers toward different varieties than they’d normally choose, not for flavor or yield but for resilience. These changes might require new preventative measures, such as choosing different plant varieties. It’s a quieter side effect of zone shifts, but one that shows up in the number of aphids or fungal spots a gardener deals with each season.
Independent climate analyses show the shift is broader and accelerating

Outside of the official USDA update, other research groups have run their own numbers using longer historical baselines, and the picture that emerges is consistent. About 67% of 243 U.S. locations analyzed have already shifted to warmer planting zones from the past, 1951 to 1980, to the present, 1995 to 2024. That’s a longer lens than the USDA’s map comparison, and it points in the same direction.
Looking ahead, the trend isn’t expected to level off anytime soon. With continued heat-trapping pollution, 90% of locations are likely to shift to warmer planting zones by the middle of the century, with the Upper Midwest likely to be most affected. For gardeners in that region, the plant list that works today may look noticeably different by the time a young fruit tree planted now reaches full maturity.
Checking your zone is worth doing even if you think you already know it
Given how uneven these shifts have been, it’s worth actually confirming where you land rather than relying on memory or an old seed packet chart. The USDA’s own tool makes this simple. Gardeners can go to the Plant Hardiness Website and plug in their zip code to find out the hardiness zone they live in.
It’s also worth remembering that the zone map is only one input among several. Successful growing is also determined by soil type, rainfall or irrigation, daytime and nighttime temperature, day length, wind, humidity, and heat, and climates and growing conditions can vary even within the same growing zone. A zone number is a useful starting point, not a guarantee, and pairing it with your own observations of frost dates and microclimates will always beat relying on the map alone.
What this means for the next few seasons
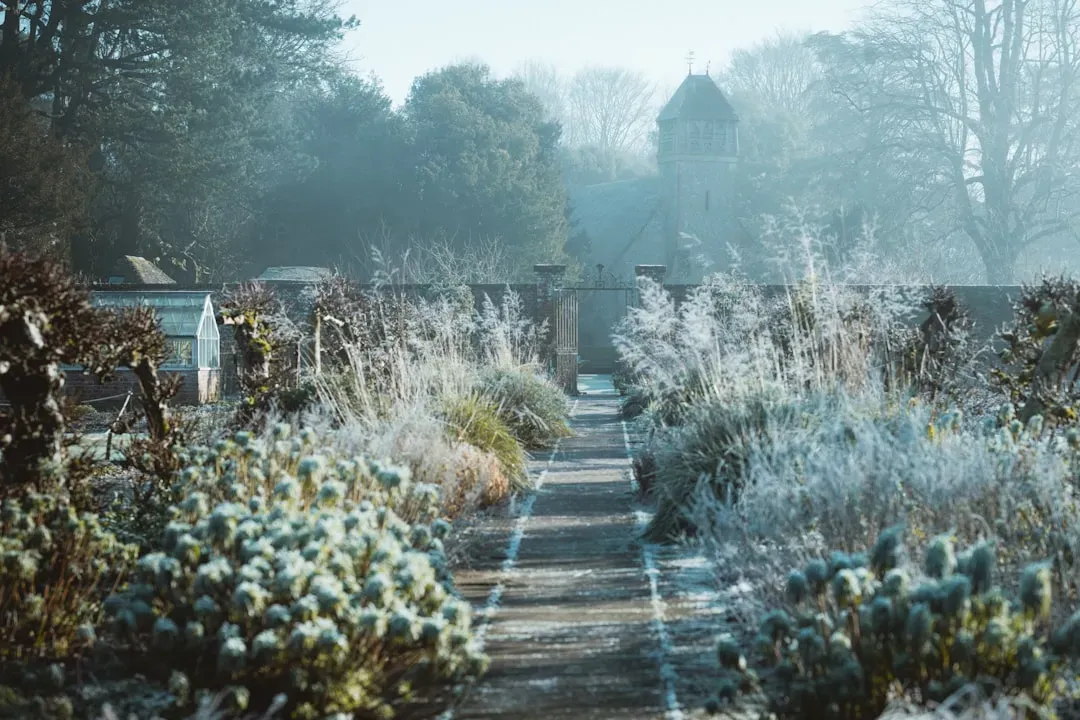
None of this suggests gardeners need to overhaul their plans overnight. It does suggest that the assumptions many of us grew up with, about what survives winter and what doesn’t, are worth revisiting every few years rather than treated as fixed. The zone map isn’t rewriting itself constantly, but the ground beneath it clearly is.
The most useful habit going forward may simply be paying attention. Notice which plants struggled last winter and which ones sailed through. Track your own frost dates instead of trusting decade old averages. The official map will eventually catch up again, but your own garden notes will tell you the story long before the next update lands.

- The Shoreline Sucked Dry in Seconds – 5 Tsunami Signals Beachgoers Mistake for Low Tide - November 14, 2026
- 9 Dark-Sky Destinations Around the World Where the Stars Look Unreal - November 14, 2026
- The Fault Line That Never Slips – 7 Locked Seismic Zones Overdue for a Massive Release - November 14, 2026
