

Most of the warming we talk about happens where almost nobody lives. It happens in the water. When scientists add up where the extra energy from greenhouse gases ends up, the air barely makes the list.
The ocean is the main storage site, and the numbers keep growing year after year. Here’s what the research shows, including the latest findings from 2025 and 2026.
Where the Extra Heat Actually Goes

Greenhouse gases trap more energy than Earth sends back to space. Because oceans absorb the vast majority, roughly ninety percent, of that excess energy as heat, changes in ocean heat content are an accurate proxy of the energy imbalance. In other words, the ocean works like the planet’s main thermometer.
The wider climate system has other places to put heat, namely the atmosphere, land and ice. The imbalance can be estimated by an inventory of heat changes across the atmosphere, the land, the cryosphere and the ocean. The ocean takes by far the biggest share of that inventory.
Why Water Is Such a Good Heat Sponge

The reason comes down to physics. Water can store a lot of heat compared to the air, so the ocean can absorb excess heat from a warming atmosphere. The ocean is also huge, and its sheer volume adds to that capacity.
NASA notes that about ninety percent of the excess heat from planetary warming over the past century has been absorbed by the ocean. That heat has raised ocean temperatures, though more slowly than it would have warmed the air.
How Researchers Measure It

Ocean heat content comes from temperature readings taken at many locations and depths. The calculation integrates the change in energy over an ocean basin or the entire ocean. Most long records focus on the upper layers, where most of the data were collected.
Since most historical measurements, starting in the late 1960s, were collected in the upper layer, long term monitoring is most consolidated at depths down to 700 metres. Newer work extends to 2000 metres. NASA’s indicator listed 372 zettajoules gained since 1955 as of December 2024.
The 2025 Record
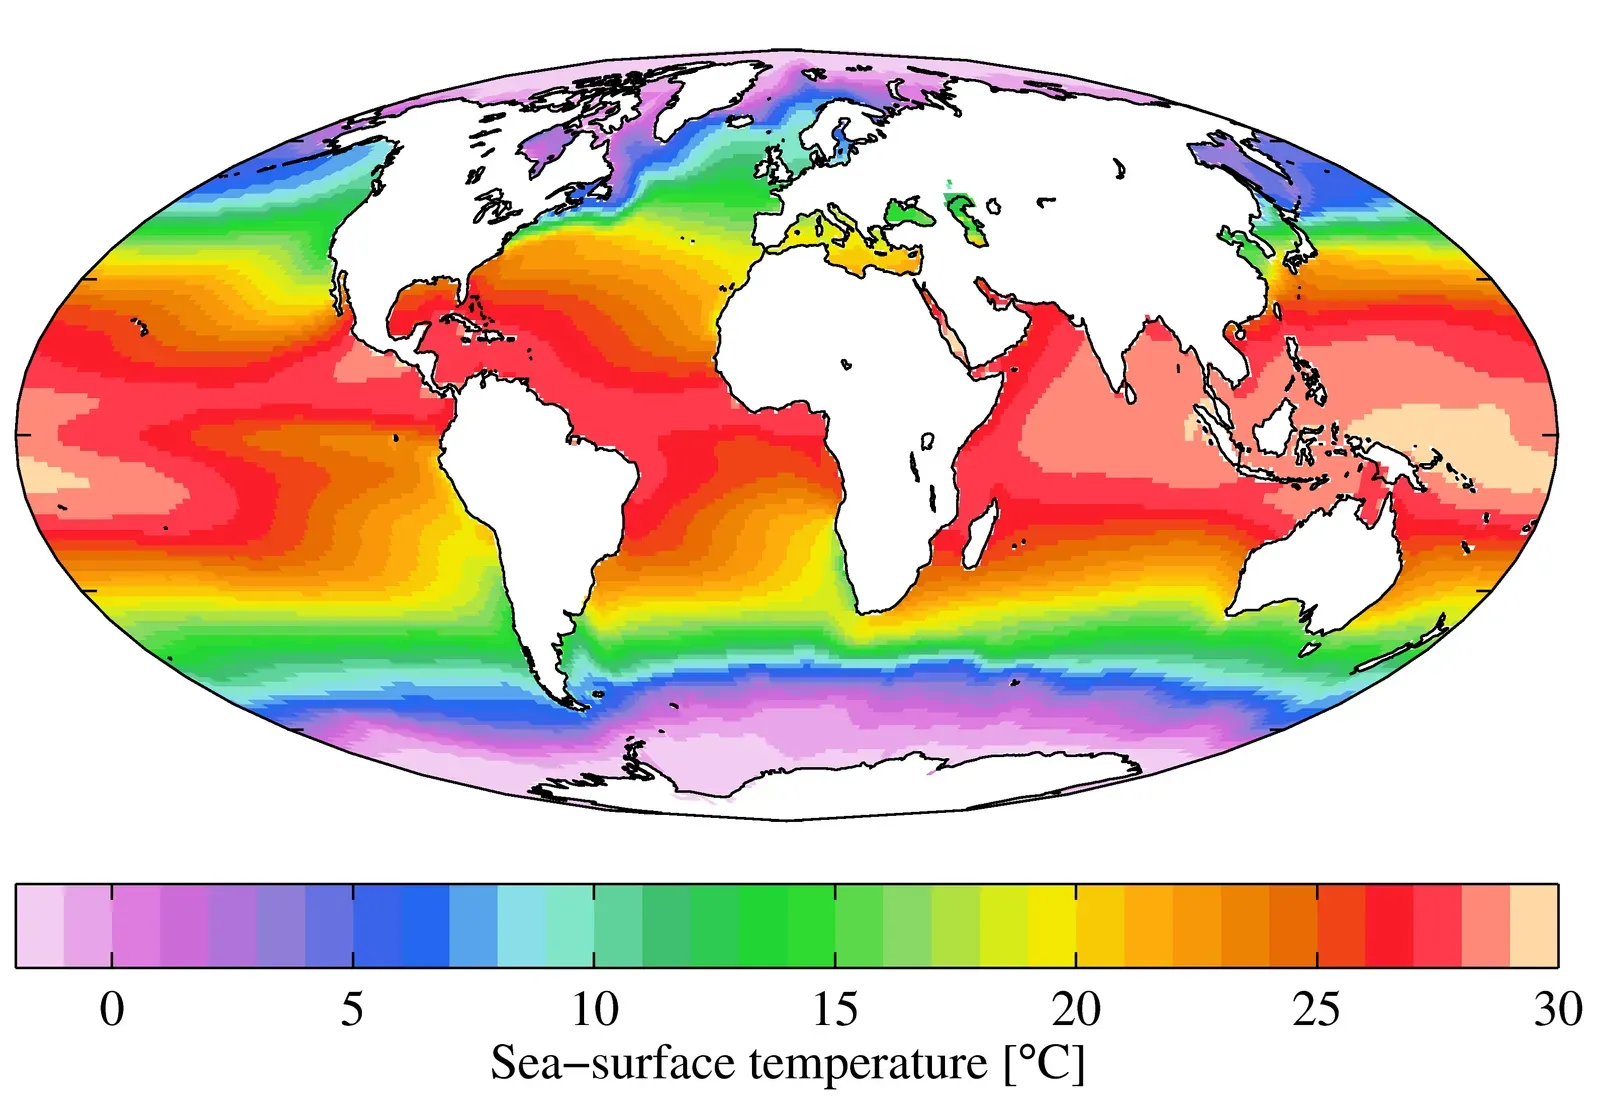
A study published in January 2026 in Advances in Atmospheric Sciences looked at the most recent year. It found that the ocean stored more heat in 2025 than in any year since modern measurements began. The work brought together more than fifty scientists from 31 institutions.
The upper 2000 metres gained about 23 zettajoules relative to 2024, according to the IAP/CAS estimate. That’s roughly 37 years of global primary energy consumption at the 2023 level. Independent datasets from Europe and North America agreed on the direction.
Nine Years of Records in a Row
The 2025 result wasn’t a one off. Ocean heat content reached a record high in 2025, as it has in each of the past nine years. That streak points to steady accumulation rather than a random spike.
Copernicus Marine reached a similar conclusion with a different record. In 2025, global ocean heat content was the highest in a record that goes back to 1993. Different teams, different methods, same answer.
Surface Temperatures Tell a Different Story

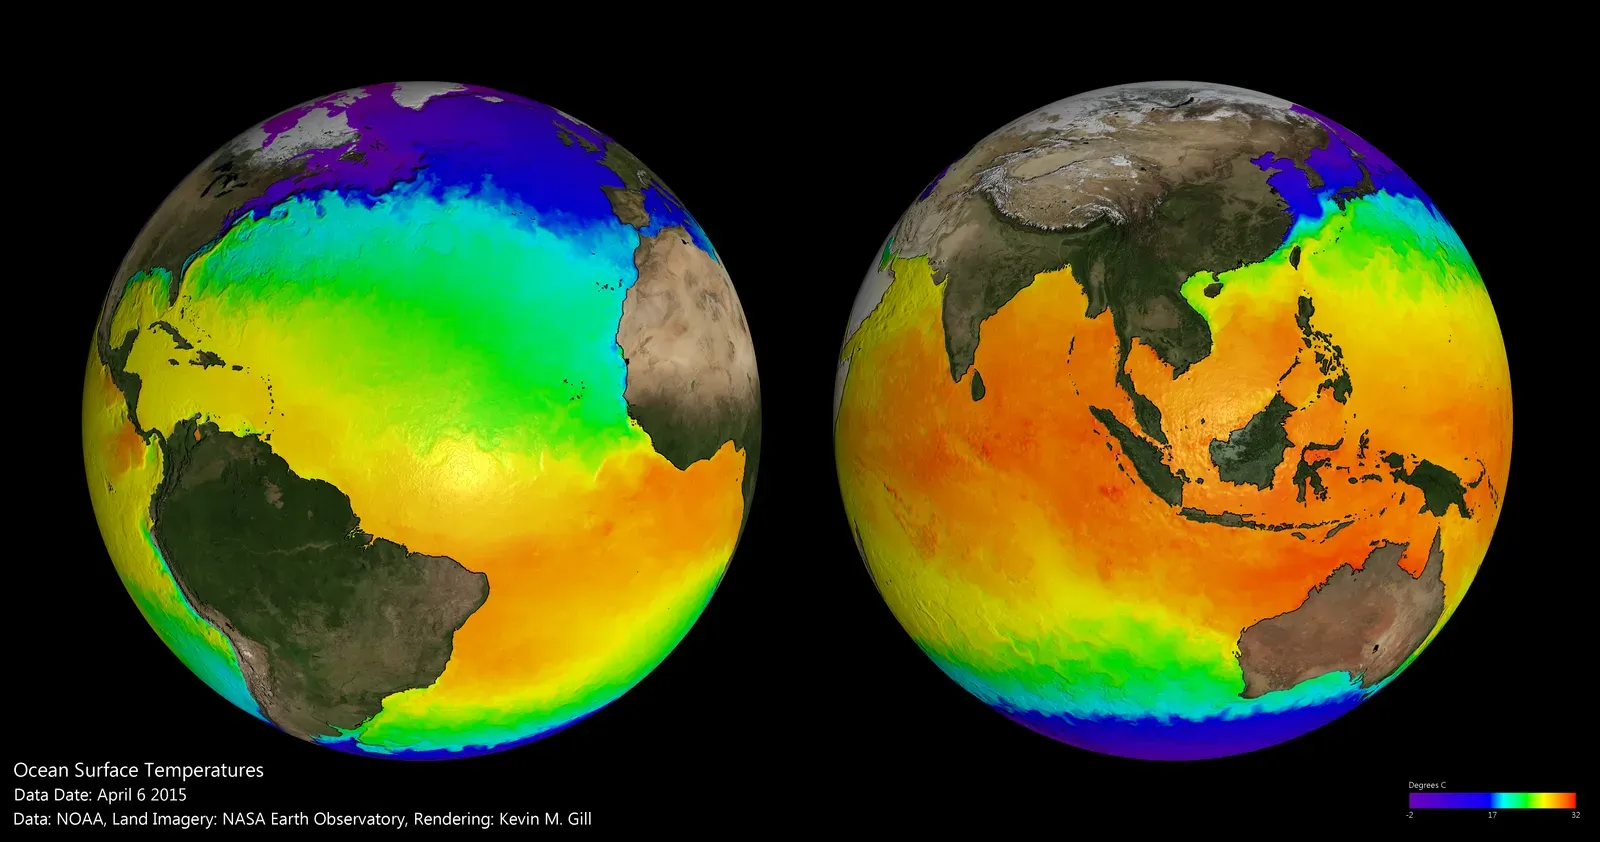
You might expect surface readings to set records every year too. They don’t always. Global mean sea surface temperature in 2025 was 0.12 degrees Celsius lower than in 2024, consistent with evolving La Niña conditions, yet still the third warmest year on record.
So the surface can cool slightly while the deeper ocean keeps gaining heat. That’s why researchers lean on heat content rather than surface readings alone. It captures the long term accumulation that natural swings can hide.
A Faster Rate of Warming

The pace has picked up. Warming of the upper 2000 metres increased from 0.14 watts per square metre per decade over 1960 to 2025 to 0.32 over 2005 to 2025. That’s more than double.
Other research backs this up. One analysis found that ocean heat uptake has accelerated dramatically since the 1990s, nearly doubling during 2010 to 2020 relative to 1990 to 2000. Copernicus adds that over the last 15 years, accumulated heat has risen by nearly half compared with the amount gathered over the previous 50 years.
Uneven Warming Across Basins
The heat isn’t spread evenly. In 2025, about sixteen percent of the global ocean area reached a record high heat content, and about a third ranked among the top three warmest on record. The study’s wider ranking put more than half of the ocean in its top five.
The warmest areas included the tropical and South Atlantic, the North Pacific and the Southern Ocean. Currents and mixing also move heat downward. Though the upper layers bear the brunt, heat is also exported to depth, where it can stay for centuries or even millennia.
What the Stored Heat Does

The ocean’s buffering role has a cost. By absorbing about ninety percent of the human driven heat, it slows the warming of the planet’s surface. The water itself gets warmer in the process.
Warm water expands. Over the past two decades, thermal expansion caused about thirty five percent of global sea level rise. WHOI also links stored heat to marine heatwaves, stronger storms and rising seas.

- The Shoreline Sucked Dry in Seconds – 5 Tsunami Signals Beachgoers Mistake for Low Tide - November 14, 2026
- 9 Dark-Sky Destinations Around the World Where the Stars Look Unreal - November 14, 2026
- The Fault Line That Never Slips – 7 Locked Seismic Zones Overdue for a Massive Release - November 14, 2026
