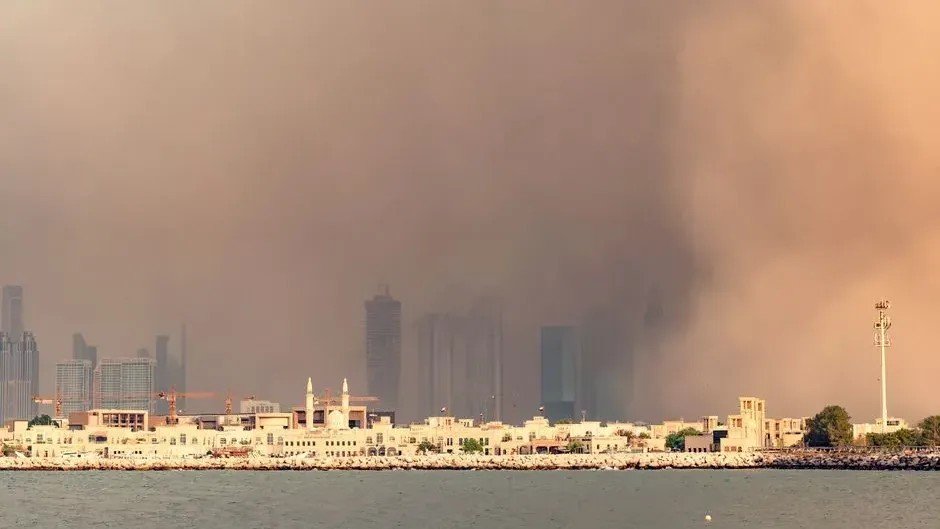
Every breath carries a cost. For billions of people, that cost has grown measurably higher. The latest data from IQAir’s 2025 World Air Quality Report, released in March 2026, paints a picture that is difficult to ignore: only 14 percent of global cities met the WHO annual PM2.5 guideline in 2025, down from 17 percent the year before. That backward slide matters enormously, because the particulate matter at the center of these rankings isn’t just a nuisance. PM2.5 particles are smaller than 2.5 micrometres, penetrate deep into the lungs and bloodstream, and are linked to cardiovascular, respiratory, and developmental diseases, particularly in children.
The rankings that follow are drawn from that same global dataset, which presents PM2.5 air quality data sourced from 9,446 cities spanning 143 countries, regions, and territories, drawing on more than 40,000 regulatory monitoring stations and low-cost sensors managed by government agencies, universities, non-profit organizations, private enterprises, and citizen scientists around the world. The regions below represent the places where living conditions are most acutely shaped by what’s in the air.
1. Pakistan: The World’s Most Polluted Country in 2025
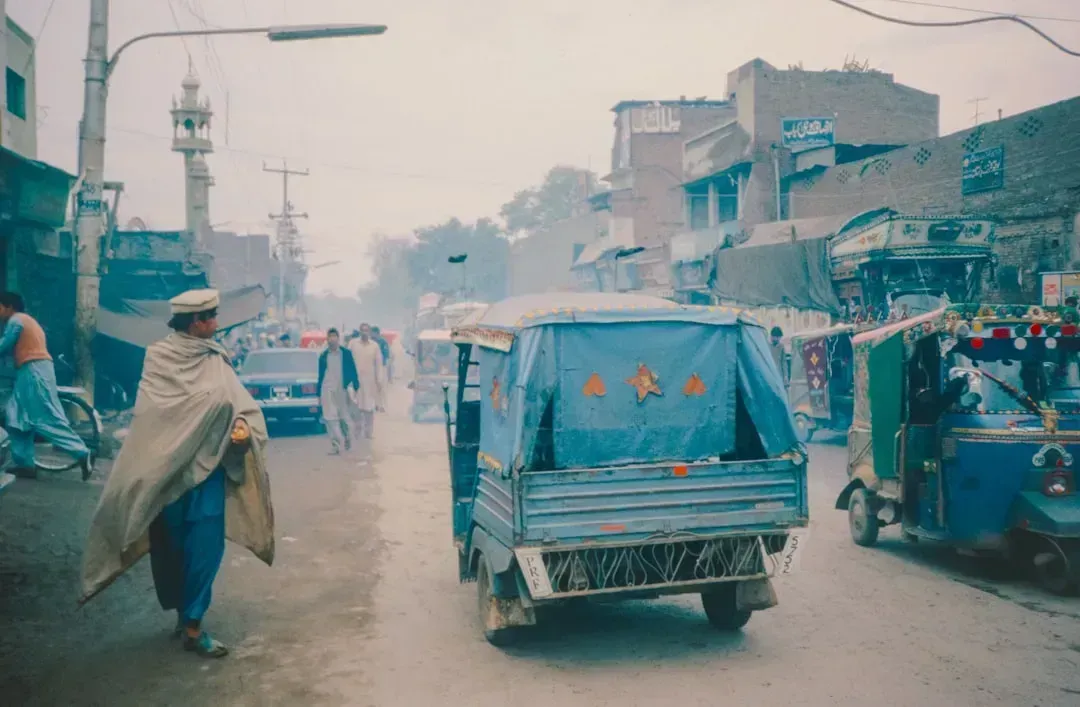
Pakistan ranked as the most polluted country globally, recording an annual average PM2.5 concentration of 67.3 micrograms per cubic metre. That figure is hard to put in context without noting what it’s measured against: the WHO standard for healthy air quality is an average PM2.5 of no more than 5 micrograms per cubic metre. Pakistan’s air exceeded that safe threshold by more than thirteen times.
Pakistan closely followed India in terms of severe and persistent urban air pollution across its major cities. Winter temperature inversions, industrial emissions, traffic congestion, brick kilns, and agricultural residue burning significantly elevated PM2.5 concentrations. Air quality remained poor for extended periods, particularly in densely populated urban centres, placing Pakistan firmly in the high-risk exposure category. Its position at the very top of the global rankings is a reflection not just of geography, but of policy gaps that have persisted for years.
2. Bangladesh: Dense, Urban, and Chronically Choked
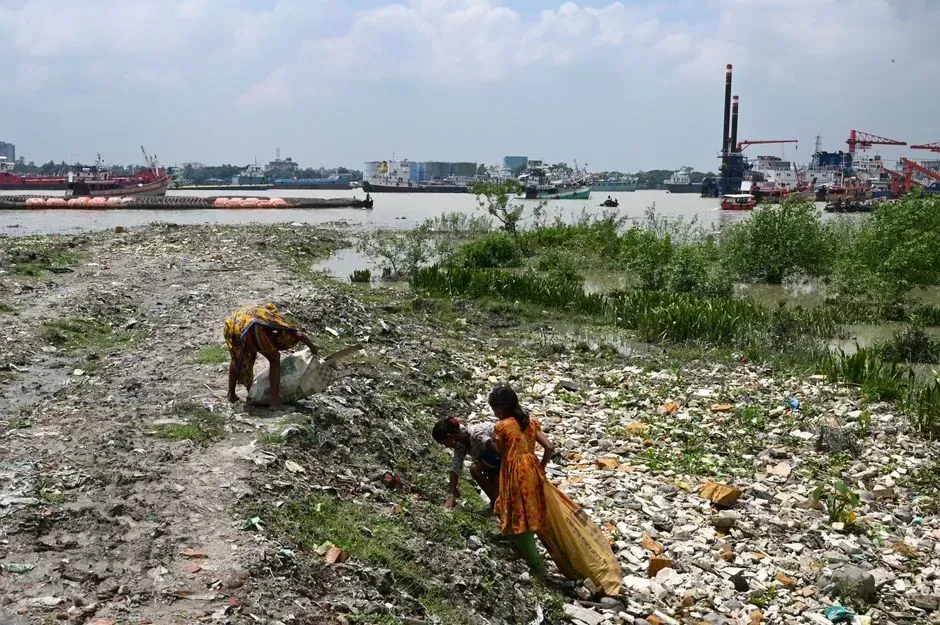
Bangladesh ranked second among the world’s most polluted countries in 2025, with an annual average PM2.5 of 66.1 micrograms per cubic metre. The figure places it almost neck and neck with Pakistan, and the causes are similarly entangled in rapid urbanization and industrial pressure. Its air quality remained consistently poor, with dense urbanisation, brick kilns, vehicular emissions, construction dust, and transboundary pollution contributing to elevated PM2.5 levels. Seasonal improvements during the monsoon were insufficient to offset extreme pollution episodes during winter, keeping the national average at the threshold of severe health concern.
Bangladesh is also a stark example of how geography compounds an already difficult situation. The country sits at the base of the Indo-Gangetic Plain, meaning it receives drifting pollution from neighboring India in addition to generating its own. Not only are Pakistan, Bangladesh, and India ranked first, second, and sixth as countries, but 83 cities from these three countries as well as Nepal are among the 100 most polluted cities in the world. This transboundary dynamic makes national-level fixes significantly harder to achieve alone.
3. Tajikistan: Central Asia’s Quiet Crisis

In 2025, the PM2.5 concentration in Dushanbe reached 57.3 micrograms per cubic metre, which is 11.5 times higher than the standard recommended by the World Health Organization. Tajikistan’s place at number three on the global list often surprises people unfamiliar with Central Asian air quality, but the causes are well documented. Cement and coal power plants are widespread in Tajikistan, particularly in Dushanbe, and represent the biggest contributors to air pollution in the country.
Tajikistan relies mostly on hydropower for electricity but routinely suffers from energy shortages, especially in winter when water levels are low. This has made the country resort to burning fossil fuels to stabilize the electricity grid. The Dushanbe-2 plant burns 6,000 tons of coal daily, providing roughly 60 percent of the electricity used in Dushanbe. Natural dust events add another layer: dust storms primarily contribute to elevated PM levels during spring and early summer, while local emissions from traffic, industry, and residential heating dominate in colder months.
4. Chad: Where the Sahara Meets the Smog
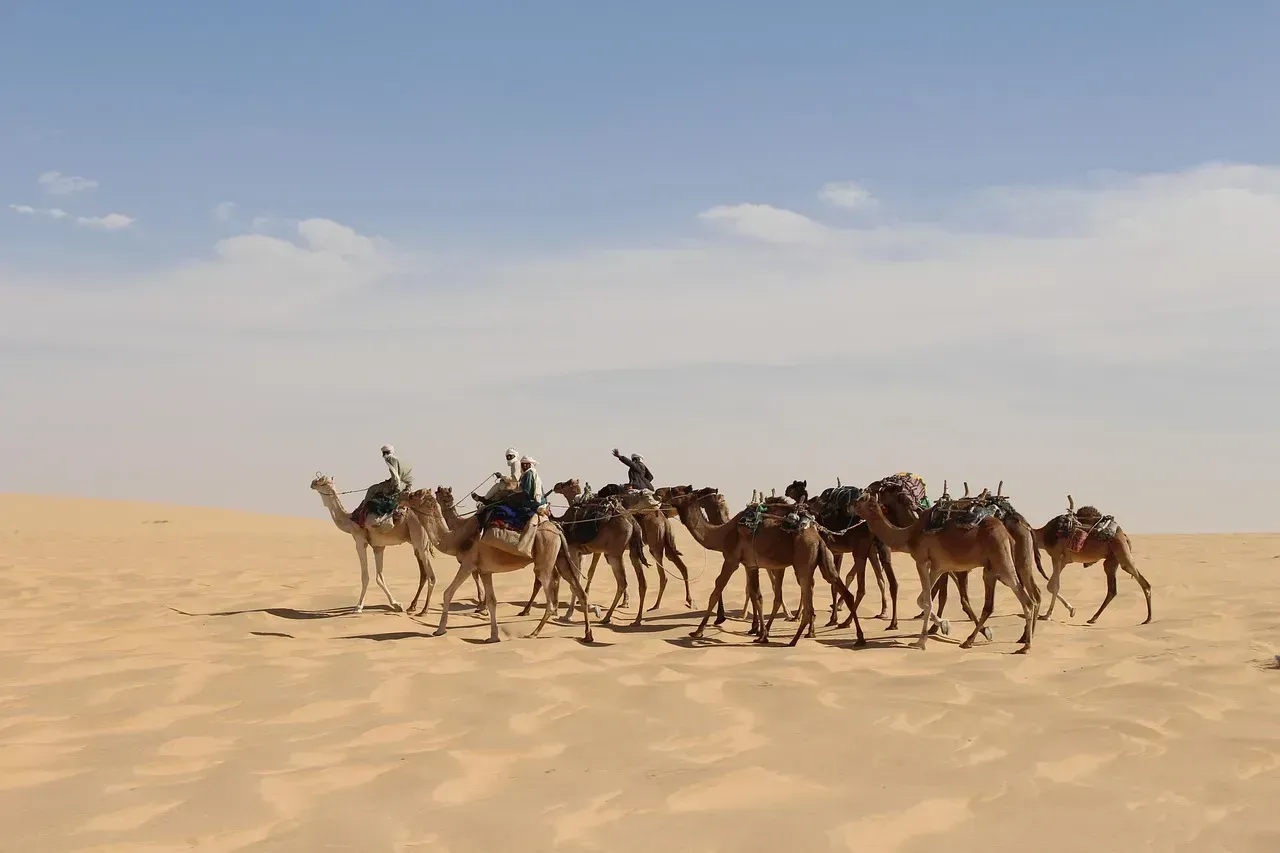
Chad ranked as Africa’s most polluted country in 2025 and the fourth most polluted globally, following Pakistan, Bangladesh, and Tajikistan, with an annual average PM2.5 concentration of 53.6 micrograms per cubic metre. Unlike most regions on this list, Chad’s pollution crisis has a uniquely geological dimension. Mineral dust from the Sahara is the country’s dominant source of airborne particles, making Chad one of the most dust-exposed regions in the world. A significant share of this dust originates from the Bodele Depression in northern Chad, a dry prehistoric lakebed considered one of the most active dust-producing regions on Earth.
The natural dust burden doesn’t tell the whole story, though. Urban vehicle emissions, crop burning, industrial activity, and widespread use of biomass fuels such as firewood and charcoal for cooking all add to the air pollution burden, affecting both climate and public health. Access to cleaner energy alternatives remains extremely limited: indoor air pollution causes an estimated 9,600 premature deaths every year in the country.
5. The Democratic Republic of Congo: Pollution Amid the Rainforest
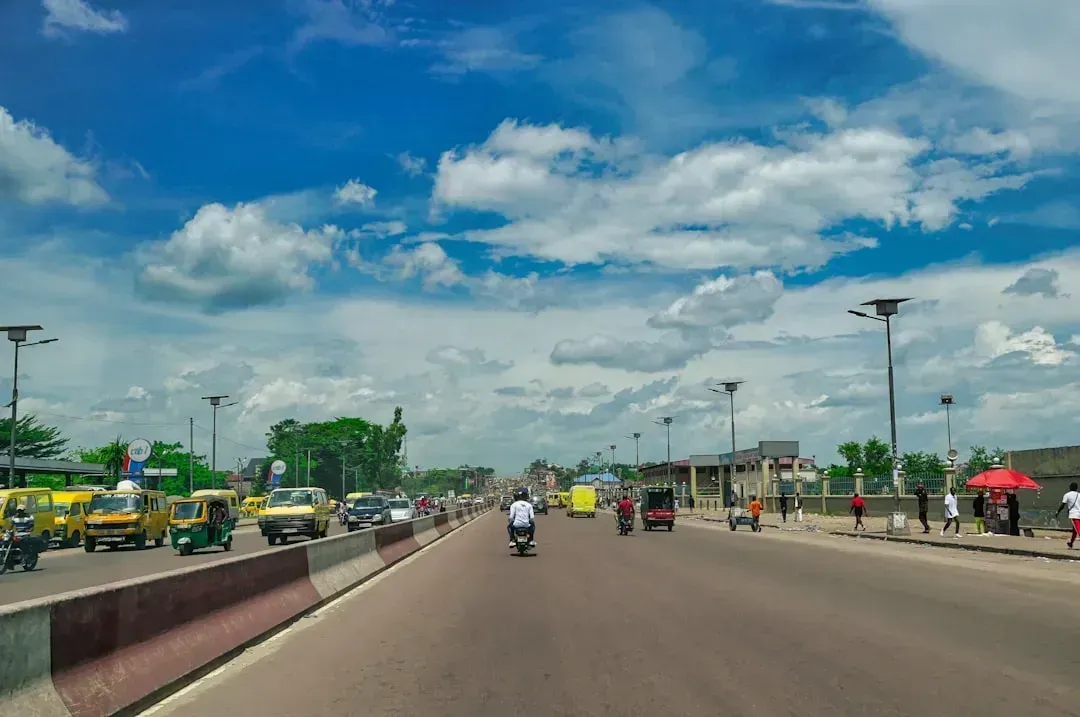
The Democratic Republic of the Congo ranked fifth on the global list, with an annual average PM2.5 of 50.2 micrograms per cubic metre. It may seem counterintuitive for a country largely covered by equatorial rainforest to feature this high, but the DRC’s pollution profile is driven by a combination of urban pressure and biomass dependence. More than 90 percent of the population uses wood biomass for cooking, and both ambient and household air pollution cause an estimated 32,000 deaths annually in the DRC.
Contributors to environmental pollution in the DRC include mining, waste, mineral processing, forestry, energy, agriculture, and land use. The country’s megacity capital, Kinshasa, is home to more than 11 million people, and outdoor PM2.5 levels there regularly exceed WHO guidelines. The destruction of forests, especially when they are cleared by fire, also causes significant environmental pollution, adding a regional smoke burden that compounds industrial and household sources.
6. India and the Indo-Gangetic Plain: A Region in Its Own Category
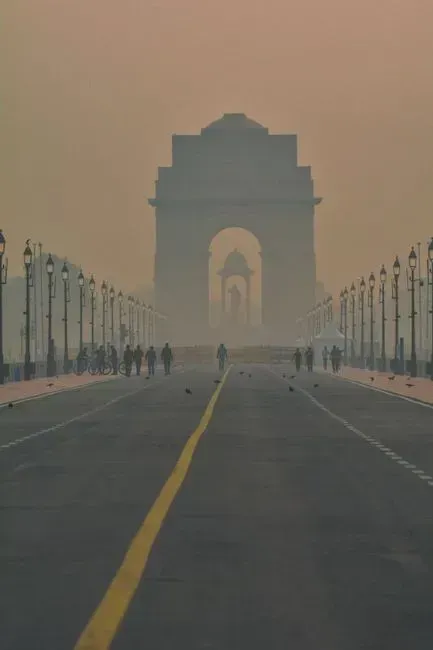
India dropped out of the global top five for the first time since the rankings began eight years ago. Its average PM2.5 level dipped by 3 percent to below 50 micrograms per cubic metre as an annual average across the country, still nearly ten times the WHO’s recommended annual average. The modest improvement doesn’t change much for the millions living in the northern plains. Loni, India, was the most polluted city globally, recording an annual average PM2.5 concentration of 112.5 micrograms per cubic metre, a nearly 23 percent increase from 2024 and more than 22 times the WHO guideline.
Delhi, home to over 30 million people, remains the world’s most polluted capital. Its average PM2.5 was 99.6 micrograms, 20 times the WHO’s safe guideline. The pattern is seasonal but severe: fueled by seasonal crop burning, vehicular emissions, and stagnant winter air, the poor air quality corresponded to a rise in hospital patients dealing with asthma, cardiac issues, and difficulty breathing. The Indo-Gangetic Plain functions almost as a pollution trap, its flat topography limiting atmospheric dispersal.
7. East Asia: China’s Shifting Pollution Belt
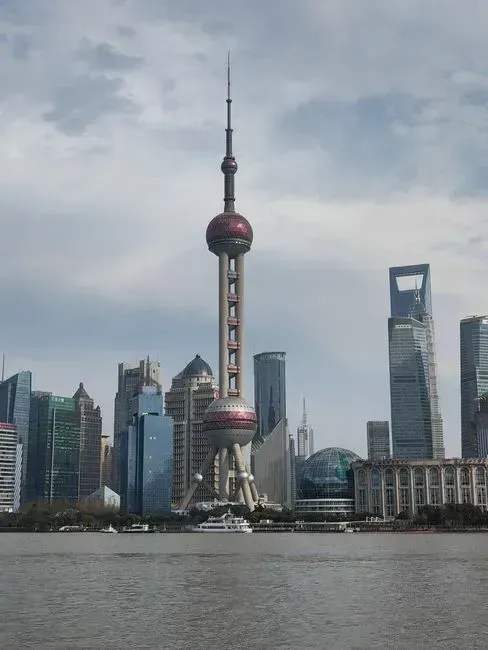
2025 marked the second consecutive year in which no cities in East Asia met WHO PM2.5 guidelines. Pollution patterns in China indicate a westward shift in elevated concentrations. That westward movement reflects China’s ongoing effort to relocate heavy industry away from its eastern coastal cities, a process that has improved air quality in places like Beijing and Shanghai while exporting the problem inland. China saw a slight overall decline to 29.6 micrograms per cubic metre, but a geographic shift is pushing pollution west due to industrial relocation.
Hotan, in northwestern China’s Xinjiang region, ranked as the second most polluted city in the world in 2025, with PM2.5 levels of 109.6 micrograms per cubic metre. The region combines industrial emissions with persistent desert dust blown in from the Taklamakan Desert. All of the world’s top 25 most polluted cities were in China, India, and Pakistan, which reinforces just how concentrated the global burden remains within this one part of the world.
8. North America: Wildfires Rewrite the Rankings
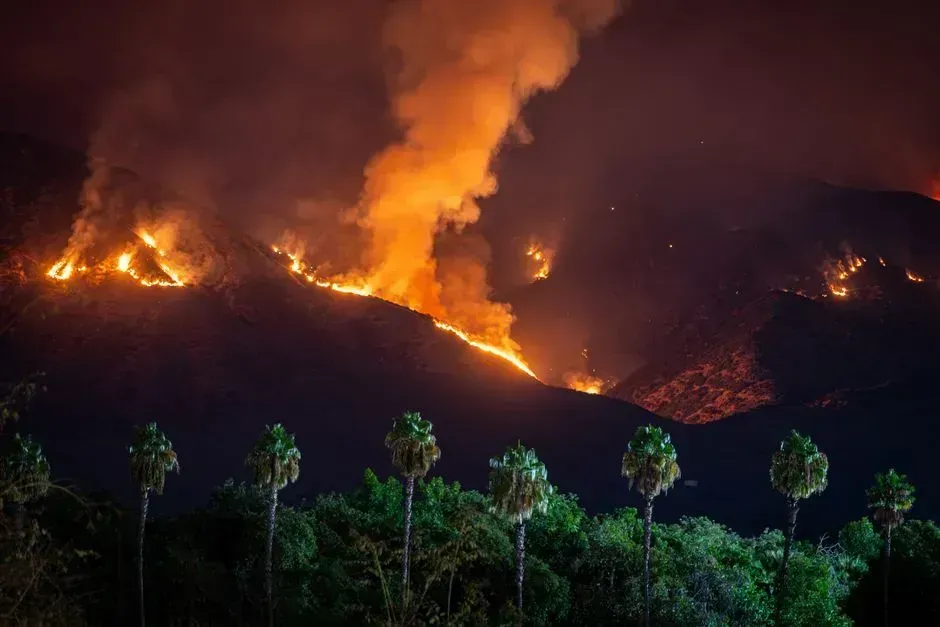
Canada was the most polluted country in Northern America for just the second time in this report’s eight-year history, as its second-worst wildfire season on record affected air quality across Canada, the United States, and parts of Europe. This is a significant shift for a country that has historically ranked among the cleaner nations in the dataset. Wildfires have fundamentally changed the seasonal pollution profile of the entire continent. Wildfires, intensified by climate change, played a major role in degrading global air quality in 2025. Record biomass emissions from Europe and Canada contributed to approximately 1,380 megatons of carbon.
Within the United States, the picture is uneven. El Paso was the most polluted major city in the United States. Historic dust storms triggered a roughly 46 percent increase in PM2.5 levels as the city recorded the highest number of major pre-summer dust storms since the 1930s. On the West Coast, the Southeast Los Angeles region, heavily impacted by wildland-urban interface fires, ranked as the most polluted area in the country. The lesson here is sobering: even wealthy, well-monitored regions are no longer insulated from air quality crises.
9. Europe: Mixed Trends and Unexpected Spikes
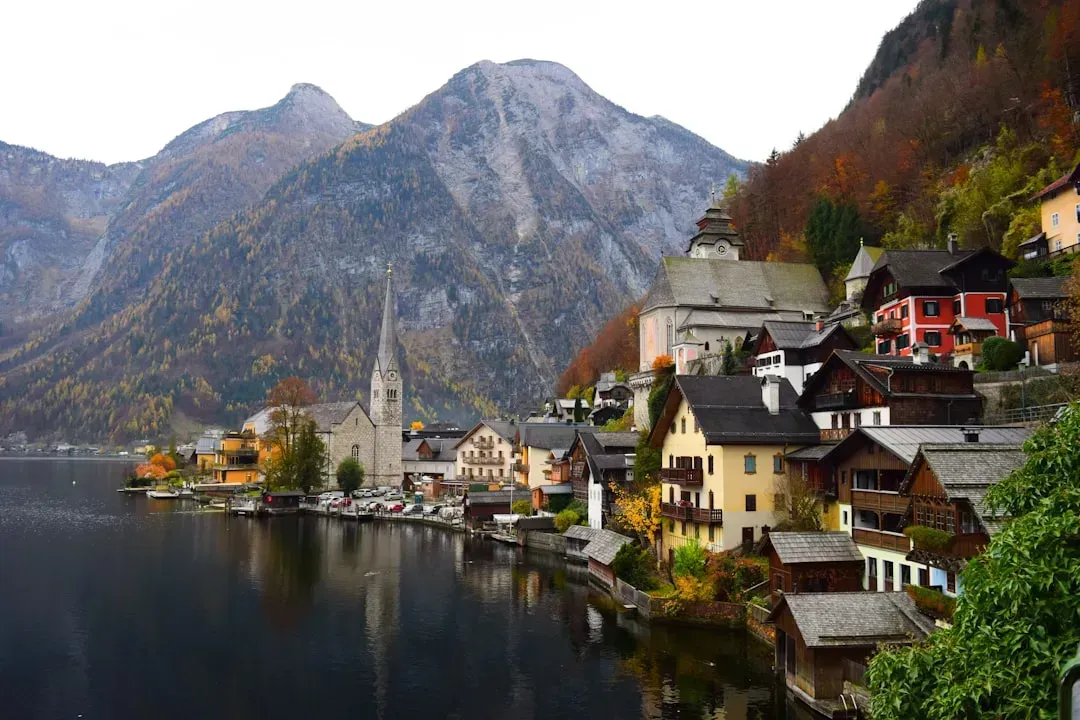
Europe saw mixed air pollution trends in 2025, with 23 countries recording higher PM2.5 concentrations and 18 seeing declines, while winter wood burning, summer smoke from Canadian wildfires, and Saharan dust worsened seasonal pollution. The continent is clearly not immune to the transboundary forces now shaping global air quality. Switzerland and Greece experienced increases exceeding 30 percent due to transboundary wildfire smoke from North America and Saharan dust from Africa.
These spikes carry a particular significance in countries that are accustomed to relatively clean air and may lack the public health infrastructure to respond to acute pollution events. Countries where pollution rose include the United States, Switzerland, and Greece, which experienced smog days due to the drift of Saharan dust from Africa. The era of geographically contained air pollution is effectively over. Dust from the Sahara settling over Alpine cities is no longer a rare anomaly; it’s increasingly part of the annual cycle.
10. West Asia and the Middle East: An Undermonitored Region Under Pressure
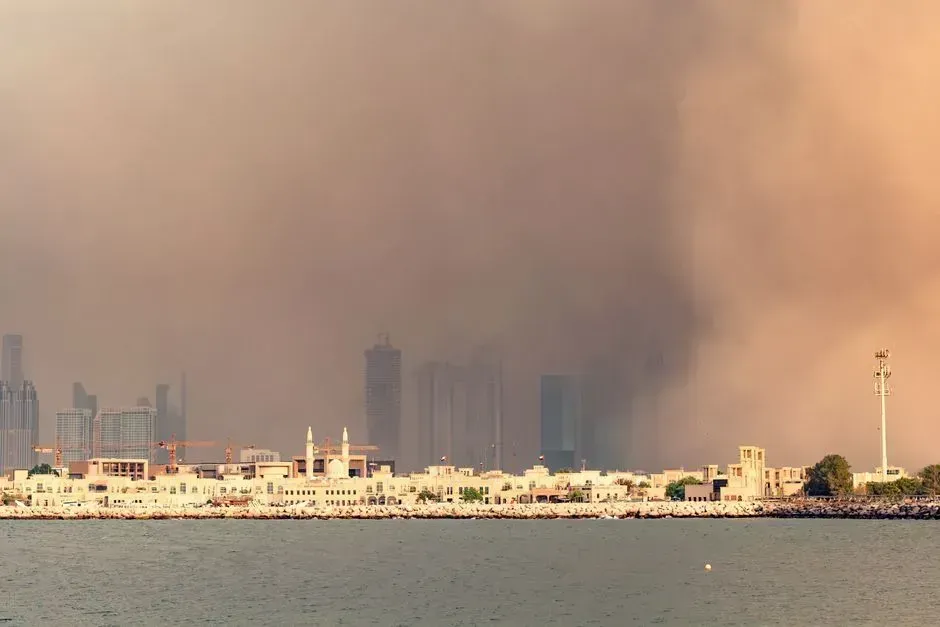
An increase in 2025 data contributions from West Asia, notably the inclusion of Iran, Syria, and Jordan, resulted in a 33 percent increase in the number of cities covered in the region. While this region remains the least represented and has been historically undermonitored, this growth marks a critical step toward closing global data gaps. The limited monitoring has almost certainly meant that the true scale of pollution across parts of the Middle East has been understated in past rankings. Bahrain recorded poor air quality throughout much of 2025, largely influenced by industrial emissions, oil-related activities, traffic density, and regional dust events. Limited urban dispersal due to climatic conditions further intensified pollution levels, resulting in one of the highest average AQI values in the Middle East.
Kuwait’s air pollution in 2025 was shaped by a combination of desert dust storms, oil and gas operations, industrial emissions, and urban traffic. The Gulf region faces a structural challenge: it is among the world’s largest fossil fuel producers, which means the economic incentives for reducing emissions are entangled with the core of national wealth. The report also flags vast data gaps, especially in Africa and West Asia, which saw setbacks in air quality monitoring coverage. Where there is less monitoring, the true pollution burden remains hidden rather than resolved.
The broader picture that emerges from these rankings is one of persistent regional inequality in air quality, with South and Central Asia bearing a disproportionate share of the global burden, while climate-driven wildfires are expanding the risk into regions that once considered themselves largely safe. PM2.5 is considered a major contributor to premature births, and prolonged exposure has also been linked to higher likelihoods of neurodegenerative conditions, including dementia, Parkinson’s disease, and Alzheimer’s disease. The data, drawn from the most expansive air quality monitoring effort ever conducted, suggests that clean air is less a baseline condition and more something that must be actively defended.

- The Shoreline Sucked Dry in Seconds – 5 Tsunami Signals Beachgoers Mistake for Low Tide - November 14, 2026
- 9 Dark-Sky Destinations Around the World Where the Stars Look Unreal - November 14, 2026
- The Fault Line That Never Slips – 7 Locked Seismic Zones Overdue for a Massive Release - November 14, 2026
