

- Oceans Trapped Under 20 Miles of Ice – 5 Moons More Likely to Host Life Than Mars - November 12, 2026
- Record planetary extremes loom as the world’s largest climate summit begins - November 12, 2026
- Will travel insurance cover weather-related flight delays and cancellations? - November 11, 2026
Southern California’s shoreline is dealing with some of the highest water levels ever measured there. Sea water levels reached an all-time record high in San Pedro, topping 8 feet. Late October 2026 has brought a convergence of ocean and atmospheric conditions that forecasters had been flagging for months.
This article looks at what has been measured, why it’s happening, and what the longer-term sea level picture means for the state. Some details are still developing, so the numbers below reflect reports available as of late October 2026.
What the Gauges Are Showing
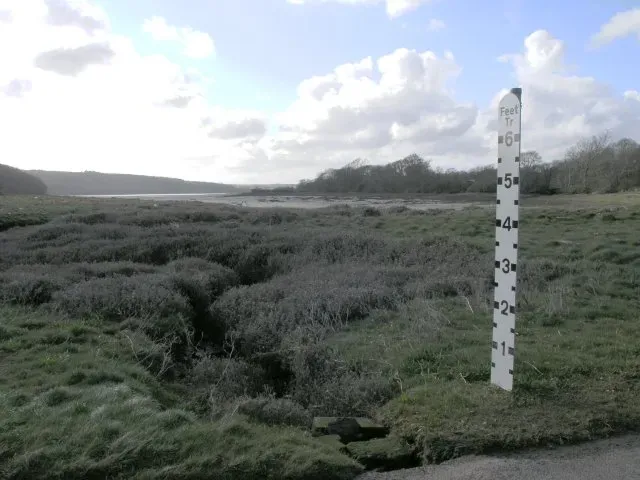
Total water levels this week in Los Angeles, Orange and San Diego counties could reach more than 8 feet above the baseline, which is defined as the average daily lowest water level observed between 1983 and 2001. That baseline matters, because these figures aren’t heights above ordinary sea level.
The La Jolla record is a useful benchmark. The record there is 7.81 feet, set on Nov. 25, 2015, during the last “very strong” El Niño. On Sunday, the level reached 7.66 feet, which is close to that mark. In Newport Beach on Sunday, the seawater had already reached a high of 8 feet, city officials said.
A Rare Combination of Causes
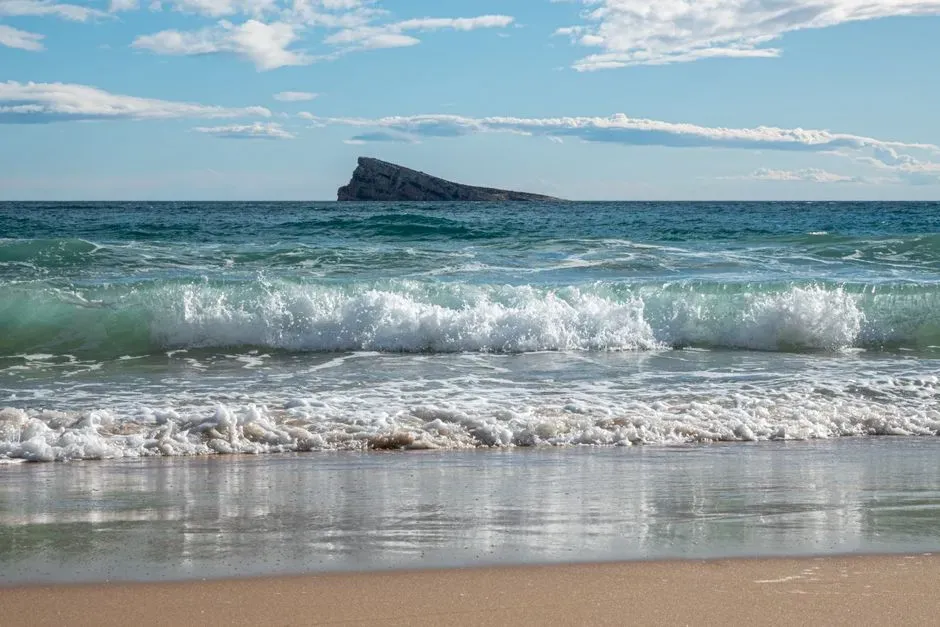
No single factor explains this. A rare combination of threats has brought damaging swells to Southern California’s coastline this year: El Niño fueling an active eastern Pacific hurricane season, a marine heat wave, and an astronomical alignment that happens only once every 20 years.
Each ingredient adds a bit of height or energy. Stacked together, they push the ocean surface higher than tide tables alone would suggest. Maximum at high tide have been nearly 2 feet higher than astronomical forces alone would predict.
How El Niño Lifts the Coast
El Niño warms the eastern Pacific, and warm water takes up more space. State climate indicators note that coastal water levels can be temporarily raised by 10 to 40 centimeters, roughly 4 to 16 inches, during El Niño years.
Forecasters saw this one building. In August, equatorial Pacific temperatures were running 1.2°C above average, with warming expected to continue into winter. Experts warned the El Niño could be the strongest on record.
The Marine Heat Wave Factor
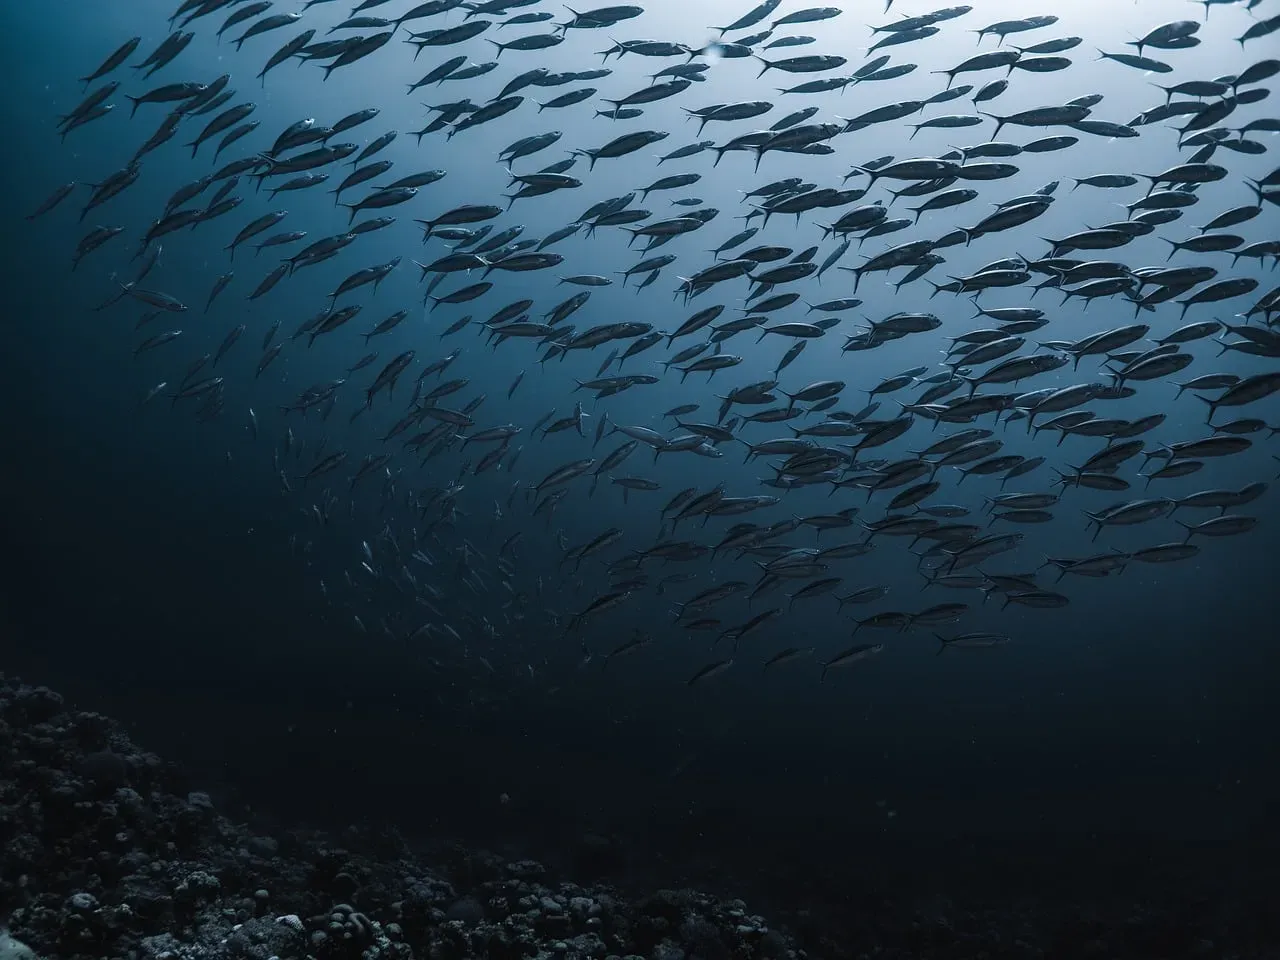
Ocean temperatures right along the coast are unusually high too. UC climate scientist Daniel Swain said the coastal waters are at record warm levels for the time of year, from about the Farallon Islands south to Baja California.
Warmer water expands, so a coastal heat wave directly raises local sea level. That’s one reason the current readings are being compared with 2015, when a similar warm period preceded a big El Niño. State indicators show levels at three tide stations rose in 2014 and 2015 because of unusually warm Pacific temperatures, then the large El Niño that peaked in late 2015.
Predictions That Came Before the Peak
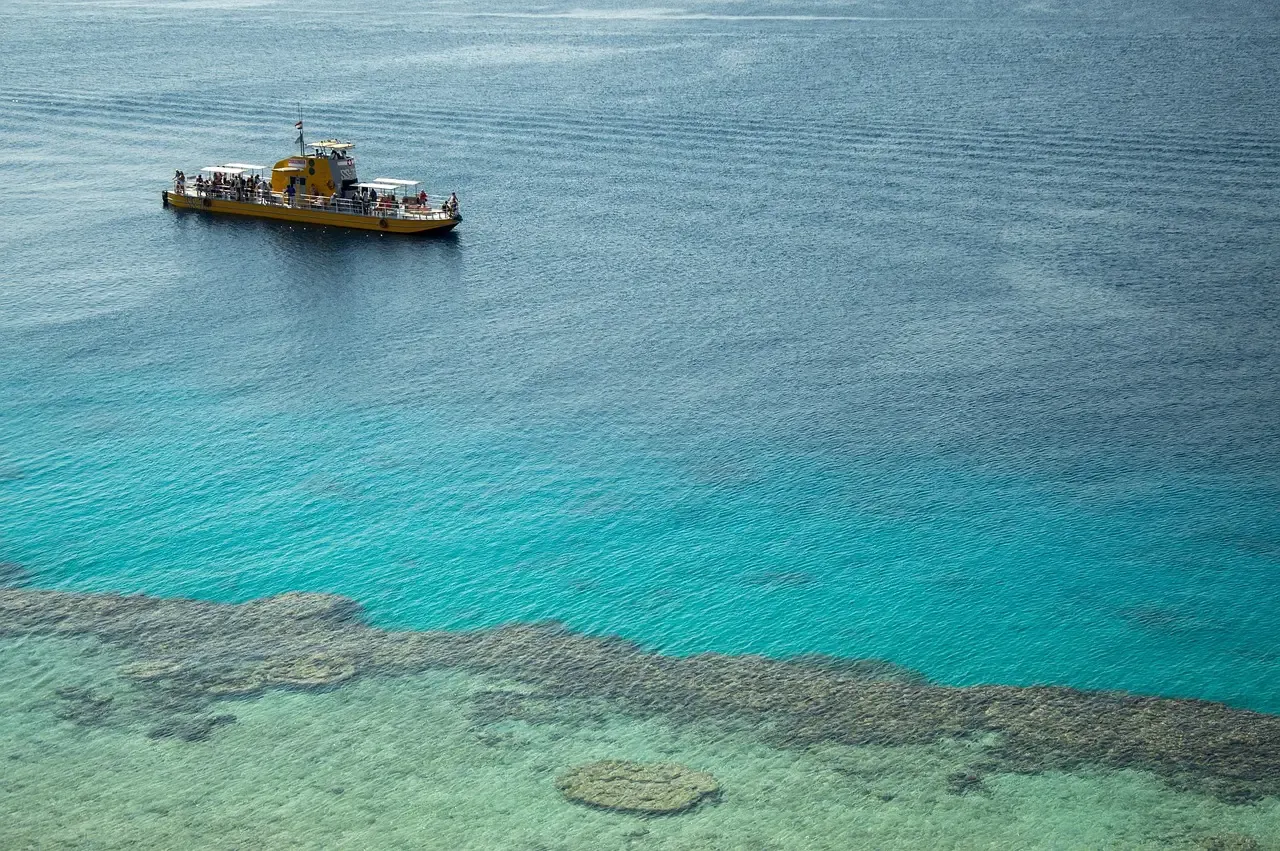
This wasn’t a complete surprise. In August, Mark Merrifield of the Scripps Institution of Oceanography said it would likely bring the highest ever recorded on the California coast associated with this event.
Experts also noted that San Francisco Bay water levels rose significantly during the 2023-24 El Niño and king tides, and the current system appears stronger. That means Northern California communities are watching closely as well, not just the south.
Flooding and Erosion on the Ground
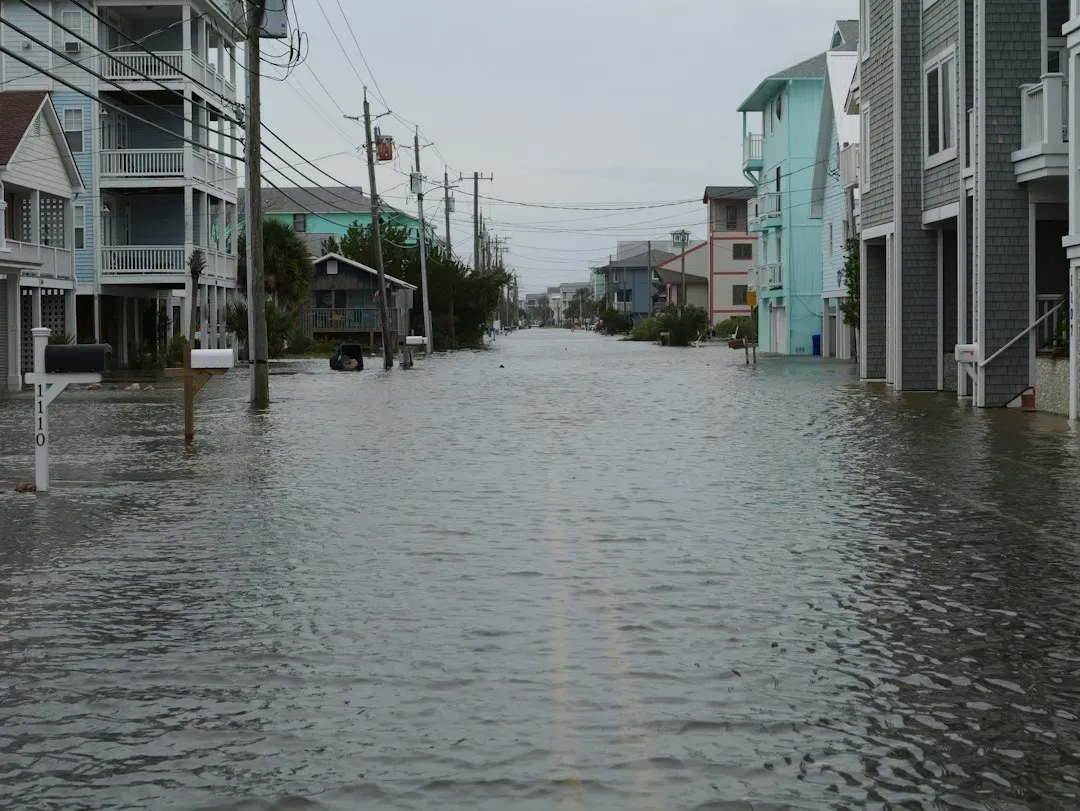
The forecast language from the weather service has been blunt. Low-lying property including homes, businesses, and some critical infrastructure will be inundated, and some shoreline erosion will occur in the morning hours.
Cliffs and homes are a particular worry. A video report from Laguna Beach describes a race to secure coastal homes and cliffs, though I’d treat that as a local account rather than an official measurement.
Earlier Warnings From King Tides
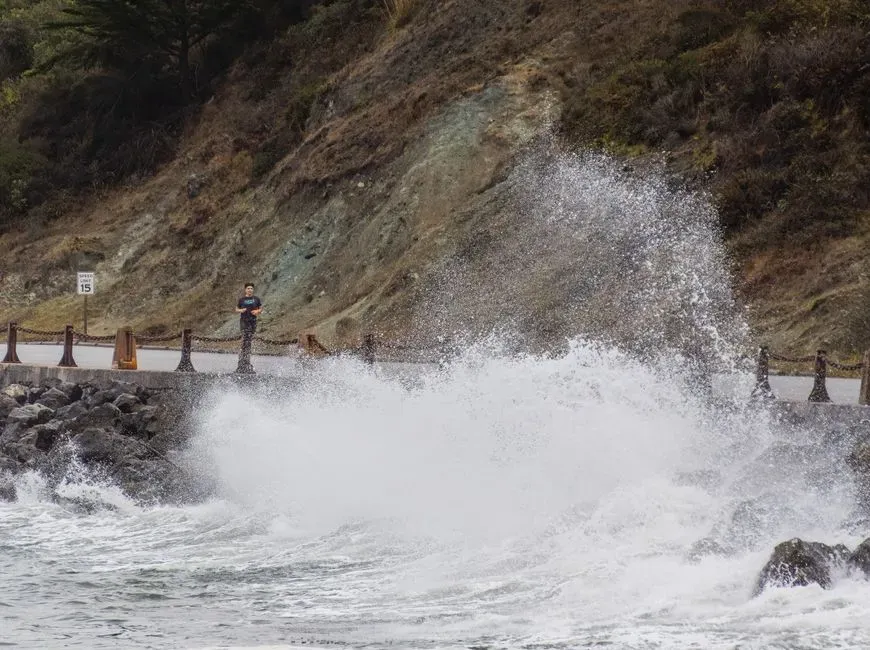
This year’s extremes didn’t start in October. In early January 2026, communities along California’s coast and around San Francisco Bay experienced king tides, some among the highest seen in decades, causing flooding in streets, parks and public spaces.
King tides are natural and predictable, which makes them a preview of how future higher seas will behave. When the baseline is higher, the same tide reaches farther inland.
The Long-Term Trend Beneath the Spikes
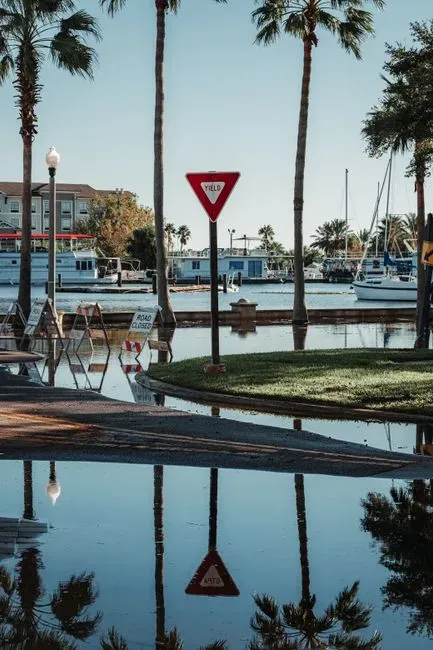
El Niño surges are temporary, but they ride on a rising baseline. Mean have increased by about 8 inches over the past century in San Francisco and La Jolla. The far north coast is an exception: Crescent City has seen a decline of about 3 inches because of regional land uplift.
Looking ahead, the state’s 2024 guidance finds seas will likely rise by nearly a foot by 2050 and potentially up to twelve feet by 2150, with storms and high tides compounding flooding, erosion and groundwater challenges. Today’s records show what a temporary spike looks like on top of that trend.
Conclusion
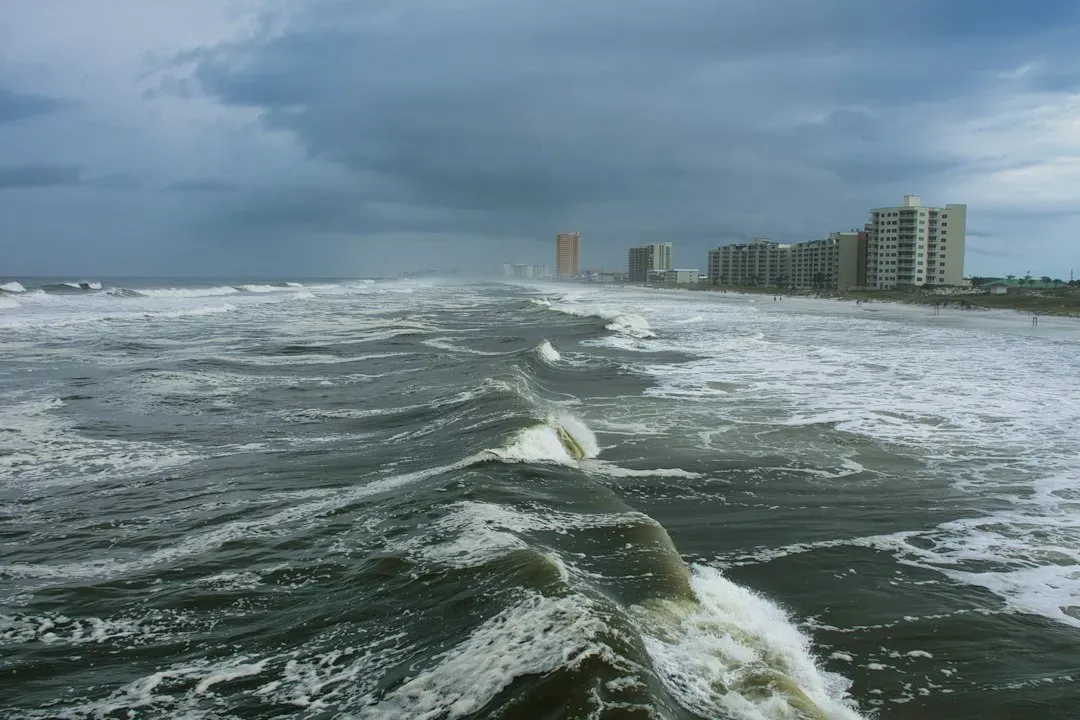
The current readings come from an unusual mix of El Niño, a marine heat wave and a once-every-20-years tidal alignment. Official figures are still being tallied, and individual stations may or may not formally break their records. What’s clear is that coastal communities are getting a stress test of what a higher baseline will bring.
The surge will recede, but the longer rise won’t. Every extreme tide is a reminder that planning has to be built around where the ocean is heading, not where it used to sit.
