

- That Metallic Taste in Storm Air – How Lightning Generates Pure Ozone - November 16, 2026
- Atlantic Hurricane Activity Has Often Rebounded After Strong El Niño Years, Records Show - November 15, 2026
- The Planet Where It Rains Liquid Glass – 7 Alien Worlds Defying Known Physics - November 14, 2026
1. Ice cores drilled from Antarctica and Greenland
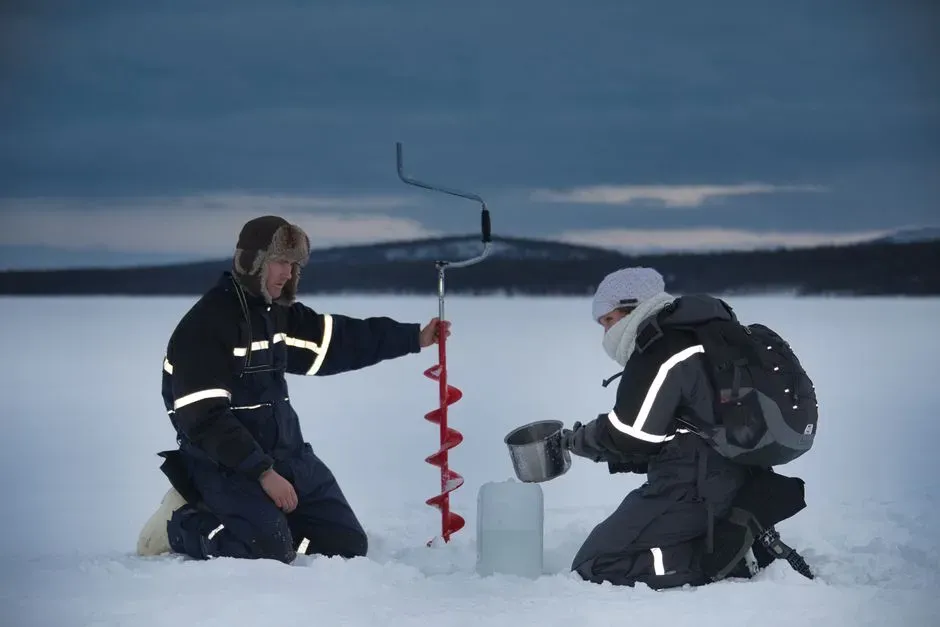
Ice cores remain one of the most powerful tools for reconstructing ancient climate because they trap tiny bubbles of the atmosphere as snow compacts into ice, layer by layer, year after year. Scientists recently pushed this record further than ever before, with analyses of ancient Antarctic ice cores extending records of greenhouse gases and ocean temperatures to 3 million years, indicating a 2 to 2.5 degree Celsius decline in mean ocean temperature and only a modest decrease in atmospheric CO2 and stable methane. That’s a staggering timescale for direct atmospheric sampling.
The ice from a site called Allan Hills has been especially useful because it is an unusual setting where ice from the Antarctic interior is stranded in mountain ranges at the edge of the continent, though flow patterns deform the originally horizontal layers, so the data provide snapshots rather than continuous records. Even fragmented, those snapshots have reshaped scientists’ understanding of how greenhouse gases and global cooling have interacted over deep time.
2. Modern greenhouse gas monitoring stations
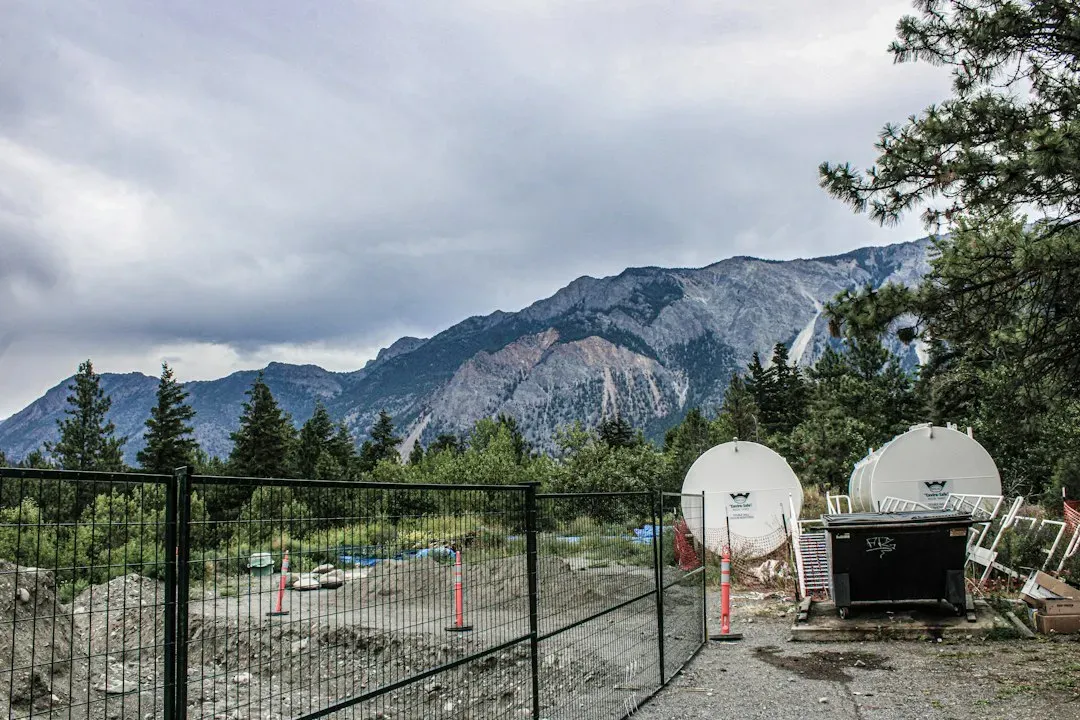
Ice cores tell us about the ancient past, but current atmospheric monitoring networks tell us what’s happening right now, in real time. NOAA and partner agencies track carbon dioxide and methane continuously, and the numbers keep climbing: modern levels of carbon dioxide and methane have increased dramatically in the last two centuries, with carbon dioxide averaging 425 parts per million in 2025 and methane averaging 1,935 parts per billion in 2025.
These aren’t estimates pulled from proxies. They come from direct chemical sampling at monitoring stations around the world, some perched on remote mountaintops or islands specifically chosen to avoid local pollution interference. When researchers compare these modern figures against the ice core record, the contrast is stark, and it’s one of the clearest signals that something unusual is happening to the atmosphere on a geological timescale.
3. Tree ring analysis, or dendrochronology

Trees keep a remarkably precise diary of their own growing conditions. Each ring corresponds to a single year, and the study of tree ring growth is known as dendrochronology, while the study of the relationship between climate and tree growth in an effort to reconstruct past climates is called dendroclimatology. Wide rings generally mean good growing conditions, narrow ones often point to drought, cold, or stress.
Researchers don’t rely on a single tree, either. Overlapping ring patterns allow scientists to match, or correlate, tree to tree and even to dead trees, extending chronologies well beyond the lifespan of any individual tree, which is why researchers seek out long-lived species such as bristlecone pines. The result is climate records stretching back thousands of years in some regions, all built from a resource that’s renewable and non-destructive to sample.
4. Satellite ocean altimetry for sea level
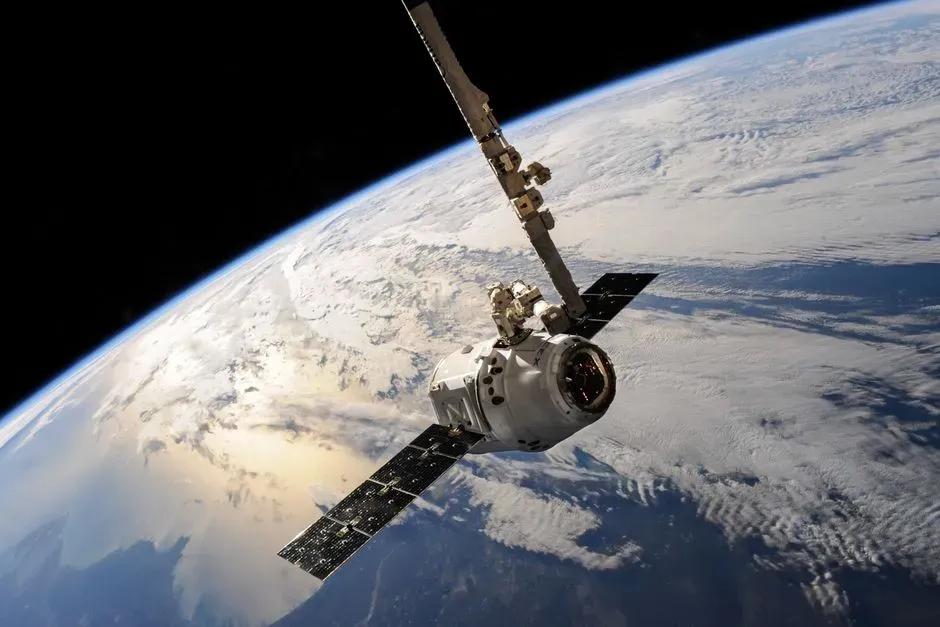
Since the early 1990s, a chain of satellites has been bouncing radar signals off the ocean’s surface to measure its height with remarkable precision. The acquisition of global sea level height data calibrated and processed for scientific research dates back to the launch of the first satellite ocean altimetry missions in the 1990s, and combining that data with tide gauge records reveals an unmistakable trend: global sea levels are rising, and the rate of this rise is increasing.
The numbers themselves are telling. Since the satellite record of ocean height began in 1993, the rate of annual sea level rise has more than doubled, and total global sea level has gone up by 4 inches, or 10 centimeters, since that year. A newer satellite, Sentinel-6B, launched in late 2025 to keep this three-decade chain of measurements going without a gap.
5. Ocean heat content measured by Argo floats
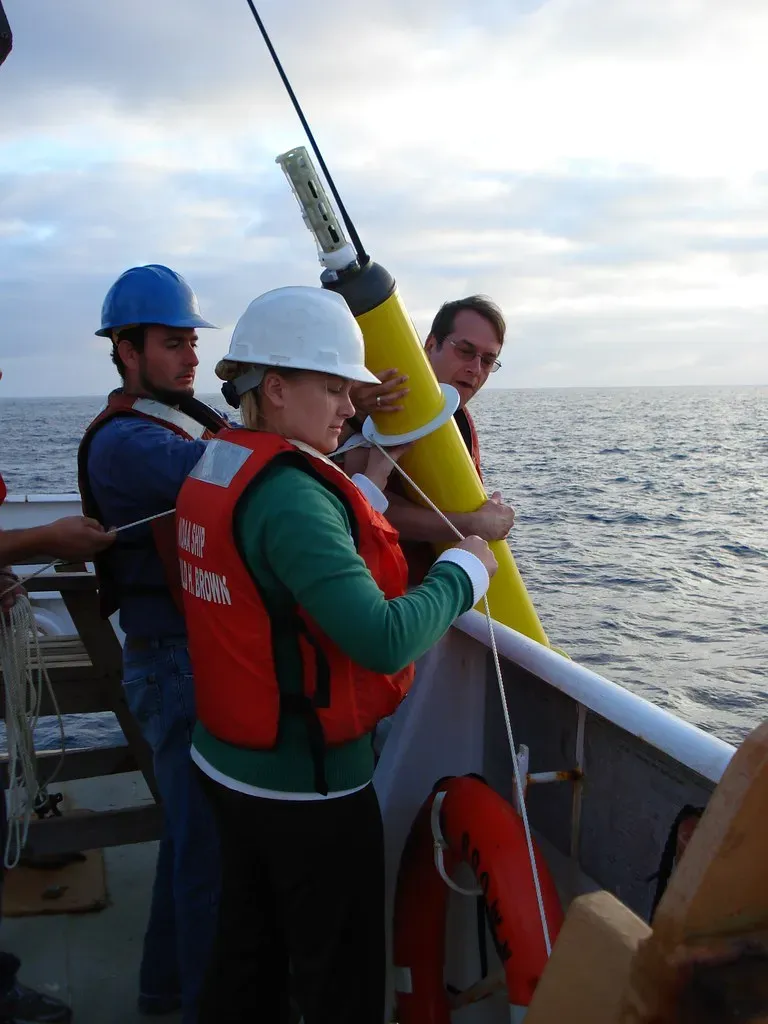
Most of the extra heat trapped by greenhouse gases doesn’t stay in the air. It goes into the ocean, and scientists track this using a fleet of thousands of autonomous floats called Argo that drift through the water column measuring temperature and salinity at different depths. Data from Argo showed record warming of the oceans in 2025, continuing a trend that has held for years running.
The scale of this heat absorption is hard to overstate. The year 2025 was the warmest on record for the heat content of the world’s oceans, which increased by around 500 zettajoules, or billion trillion joules, since the 1940s. Because oceans absorb heat slowly and release it slowly, this measurement acts almost like a long-term memory bank for the planet’s energy budget, smoothing out the noise of any single hot or cool year.
6. Glacier mass balance and ice sheet monitoring
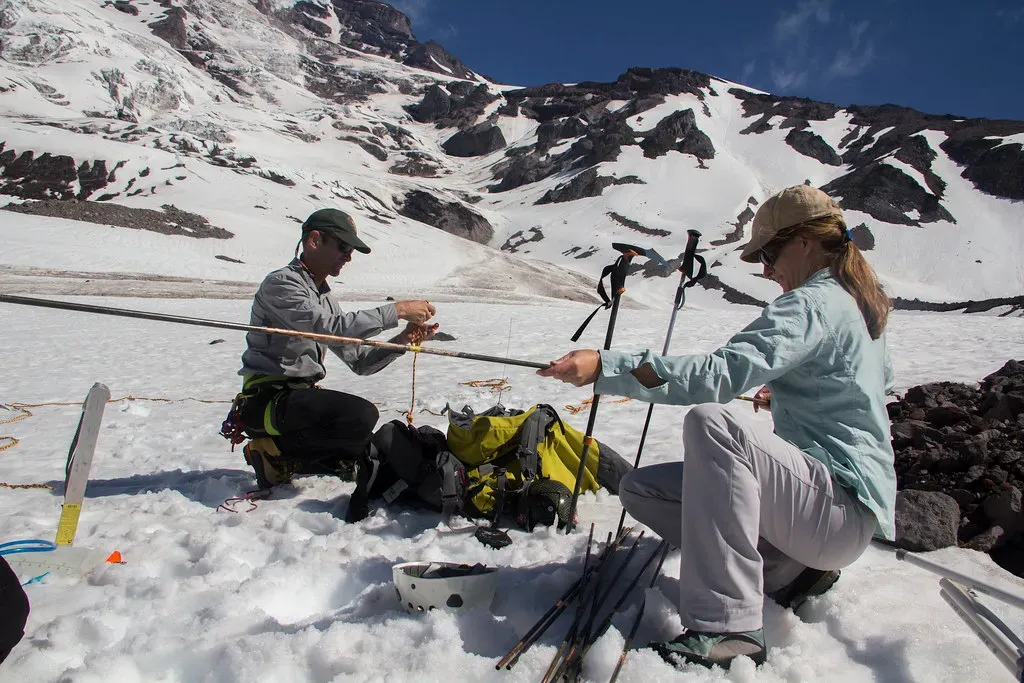
Glaciers respond to temperature changes with a lag, but their long-term trend is one of the most visually and physically obvious markers of a warming planet. In 2025 that trend accelerated rather than slowed. Cumulative ice loss from the world’s glaciers and from the Greenland ice sheet reached a new record high in 2025, contributing to sea level rise.
Scientists track this through a mix of satellite gravity measurements, which detect changes in mass by how they subtly affect Earth’s gravitational field, and direct field surveys where researchers physically measure snow accumulation and ice loss on the glacier surface. Combining these methods gives a fuller picture than either could provide alone, since satellites cover huge areas but ground surveys can catch fine-grained detail that orbit-based instruments might miss.
7. Sea ice extent tracked by satellite imagery
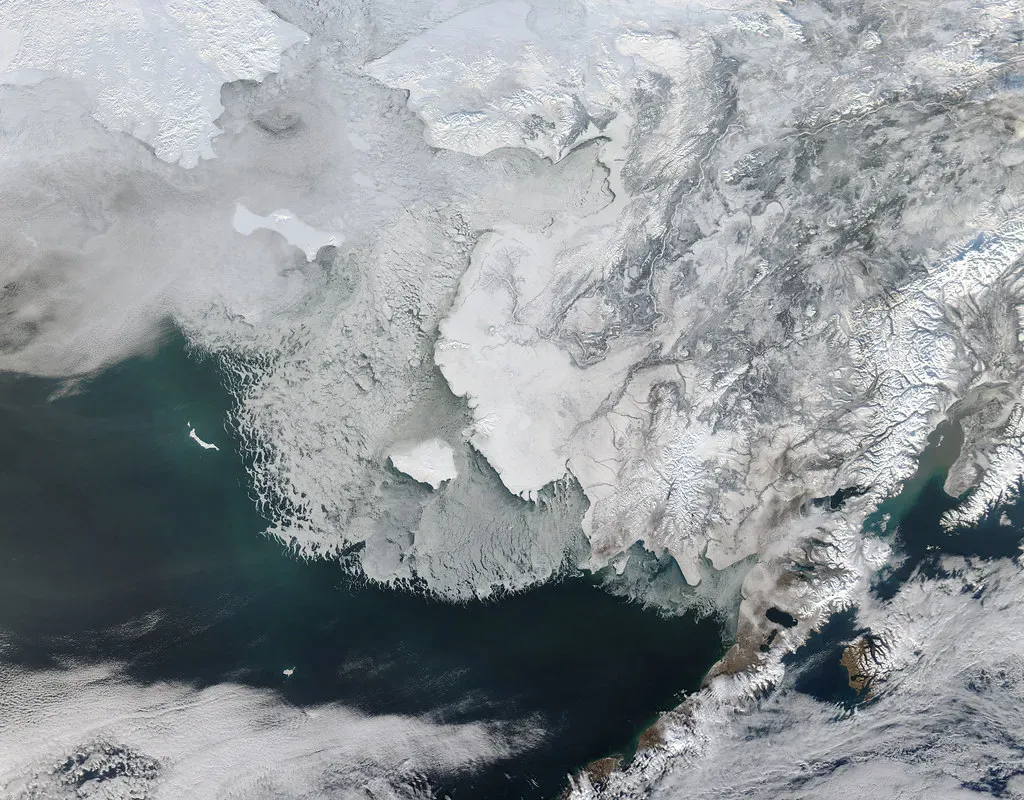
Sea ice is one of the more visually dramatic indicators, and it’s monitored almost daily using passive microwave sensors on polar-orbiting satellites that can see through clouds and darkness. The polar regions have not been telling a reassuring story lately. Arctic sea ice saw its lowest winter peak on record as well as its 10th lowest summer minimum extent, while Antarctic sea ice saw its third lowest minimum extent in the most recent tracking period.
What makes sea ice such a useful indicator is its sensitivity. It responds quickly to temperature shifts, unlike glaciers or ice sheets which can take decades to show clear change. That responsiveness makes it a kind of early warning gauge, even though year to year variability from winds and ocean currents means scientists focus on multi year trends rather than any single season’s numbers.
8. Global surface temperature records from weather stations
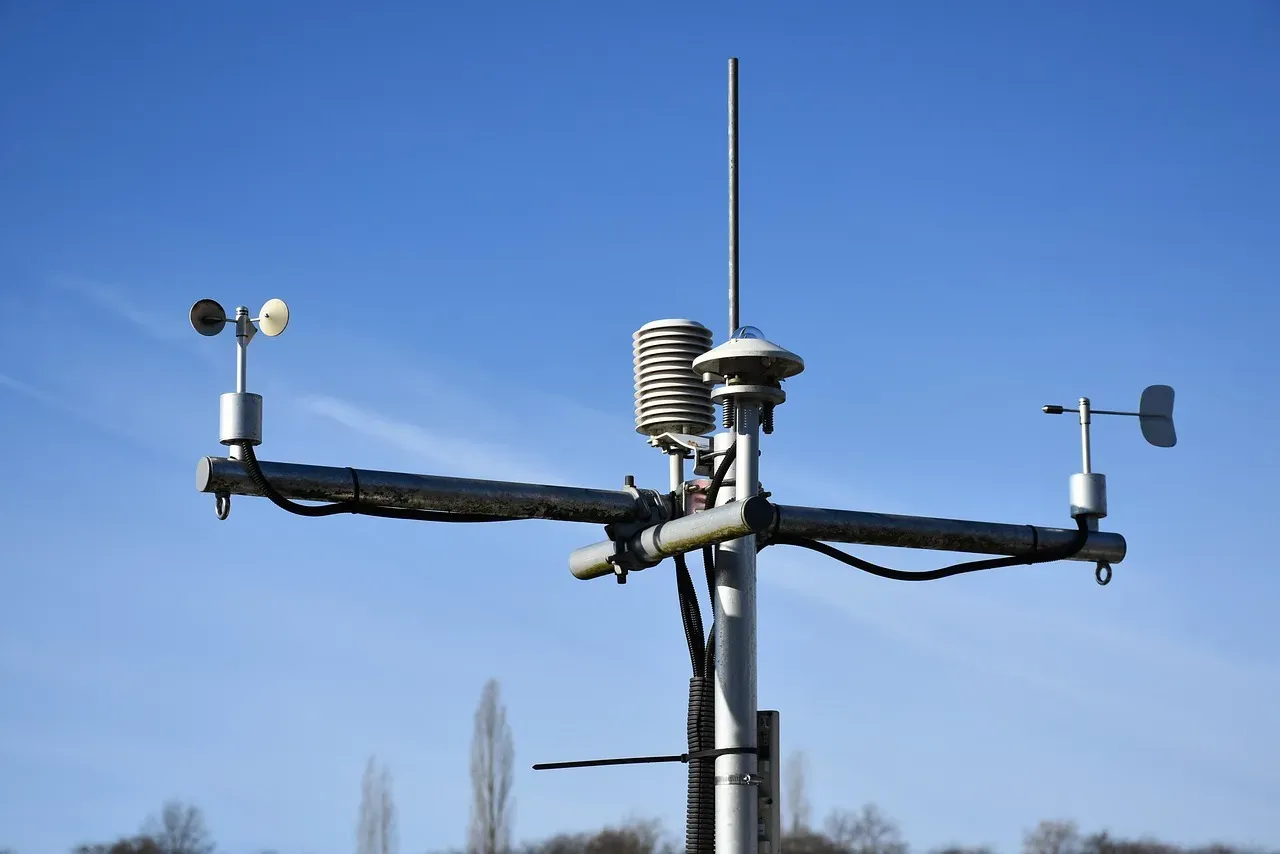
Behind every headline about a “warmest year on record” sits a massive, quietly maintained network of thermometers, buoys, and ship measurements that stretches back well over a century in some locations. Multiple independent agencies, including NASA, NOAA, and international meteorological bodies, compile this data using different statistical methods, yet they consistently arrive at similar conclusions about the pace of warming. Looking ahead, forecasters have already sketched out where the trend is likely headed. Carbon Brief predicts that global average surface temperatures in 2026 are likely to be between the second and fourth warmest on record, similar to 2023 and 2025, at around 1.4 degrees Celsius above pre-industrial levels. That kind of forward-looking projection depends entirely on the depth and reliability of the historical instrument record it’s built on.
9. Ice core chemistry and pollutant tracing
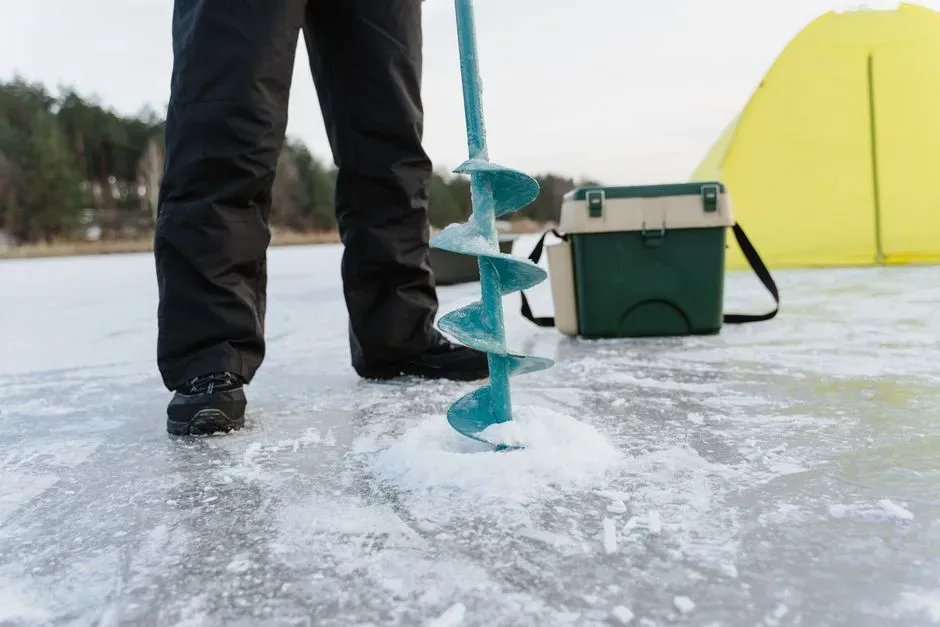
Beyond greenhouse gases, ice cores also preserve a record of pollution, volcanic activity, and other human fingerprints on the atmosphere. Researchers studying cores from high altitude regions like the Tibetan Plateau have found this especially valuable. Ice core records from the Tibetan Plateau provide regional indicators of climatic and environmental changes and permit reconstruction of variations in human made atmospheric pollutants during past hundreds of years. This isn’t just an academic exercise. These ice core records have revealed recent rapid warming with different warming rates across the plateau, while pollutant records within the ice indicate the enhanced impact of anthropogenic activities on the region. There’s also urgency behind this work, since ongoing climate warming is threatening the reliability of ice core records in the future as some glaciers begin to melt or degrade before scientists can sample them.
10. International glacier archiving projects
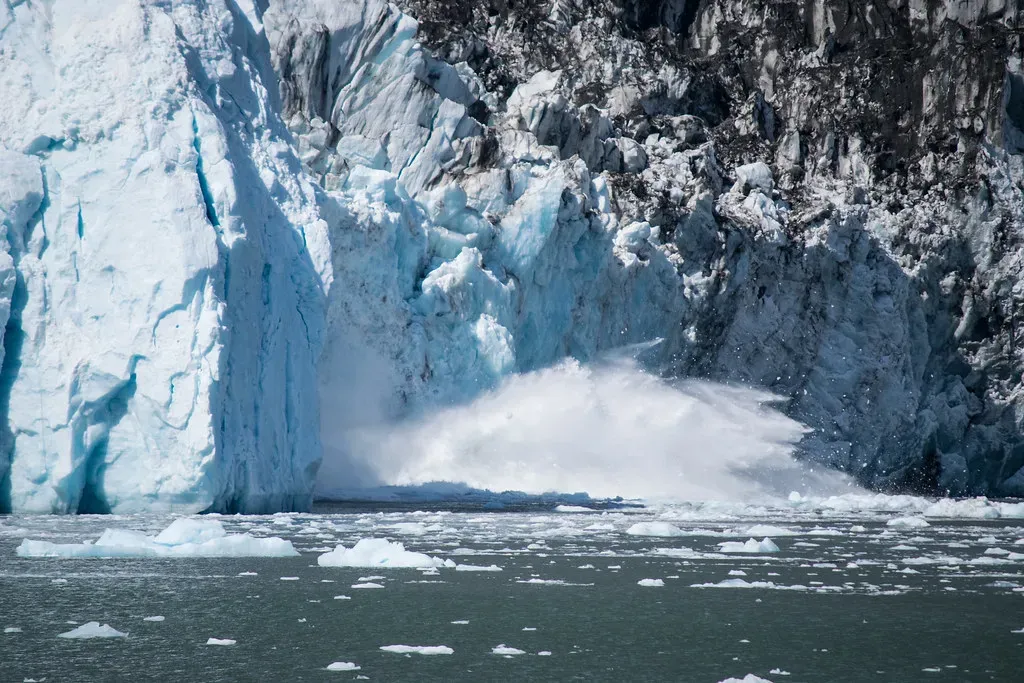
Recognizing that some ice archives may not survive much longer, scientists have started a race against time to preserve samples before they’re lost for good. The Ice Memory Foundation is one such effort, built around a simple but ambitious goal. The objective of the Ice Memory Foundation is to sample 20 glaciers in 20 years so that future generations of scientists will have access to undamaged high quality ice cores to pursue their research and understand Earth’s climate. This isn’t purely about preservation for its own sake. Ice cores allow scientists to study the dozens of chemical compounds trapped within them, including gases, acids, heavy metals, radioactivity, and water isotopes that together form the memory of past climates and environments. As of the most recent reporting, the foundation has been storing glacier samples from Europe, Bolivia, and Eurasian Russia, while waiting for Antarctic storage to become available, effectively banking irreplaceable climate data for researchers who haven’t been born yet.
Taken together, these ten methods form something closer to a web than a single measuring stick. Ice cores anchor the deep past, tree rings fill in regional detail across centuries, and satellites and ocean floats capture what’s happening this year, this month, sometimes this week. No single dataset carries the full weight of the story on its own, but the fact that so many independent, physically unrelated methods keep confirming the same overall pattern is, in itself, one of the more compelling pieces of evidence in modern science.