

High on a Hawaiian volcano, a small set of instruments has been counting carbon dioxide in the air for close to seven decades. The numbers it produces are plain: parts per million, month after month. Together they make one of the most important data series in climate science.
The most recent entries are from 2026, and they’re worth looking at closely. Here’s how the record began, how it works, and what it shows today.
How the Record Began in 1958
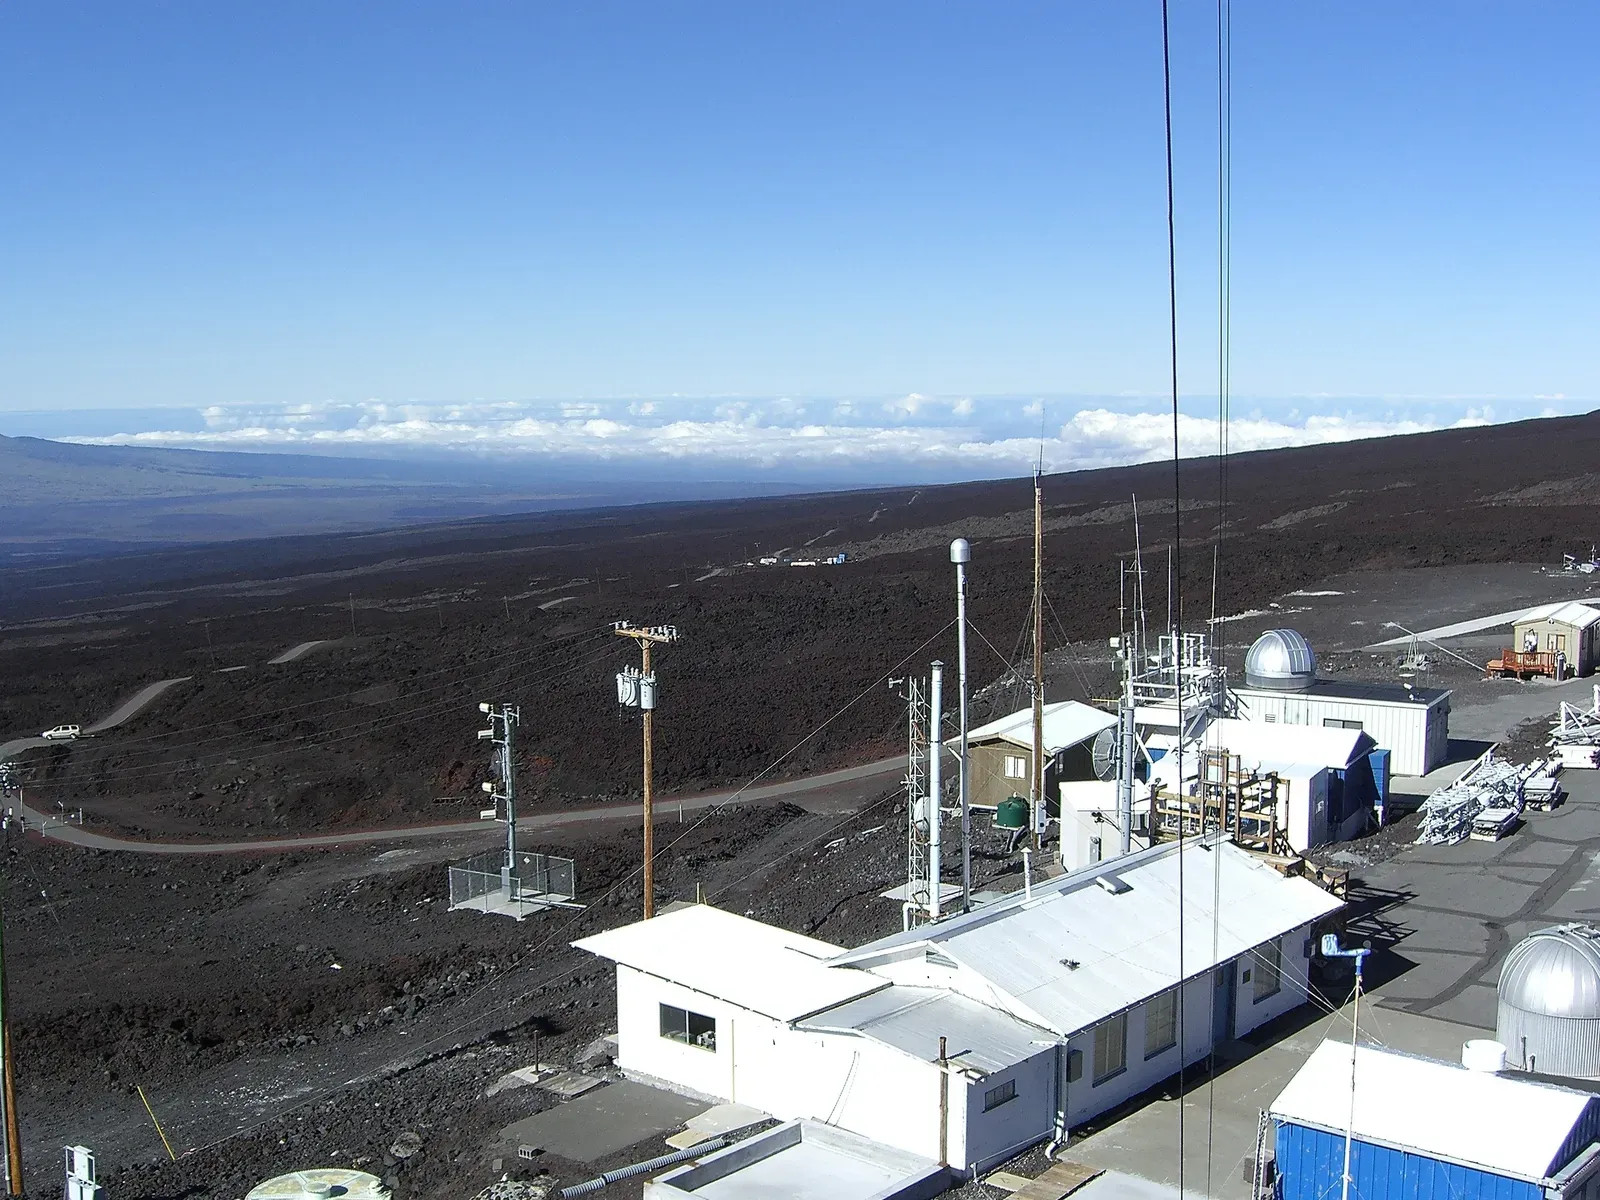
In 1958, oceanographer Charles David Keeling started the first systematic, long-term measurements of atmospheric CO2 at Mauna Loa. He was a Scripps Institution of Oceanography scientist, and he began on-site measurements at NOAA’s weather station on the mountain. The project was small at first.
Nobody then could have known how long the series would run. Its continuity is a large part of its value. Few scientific datasets have been kept going this long without a break in method.
Why Mauna Loa Was Chosen
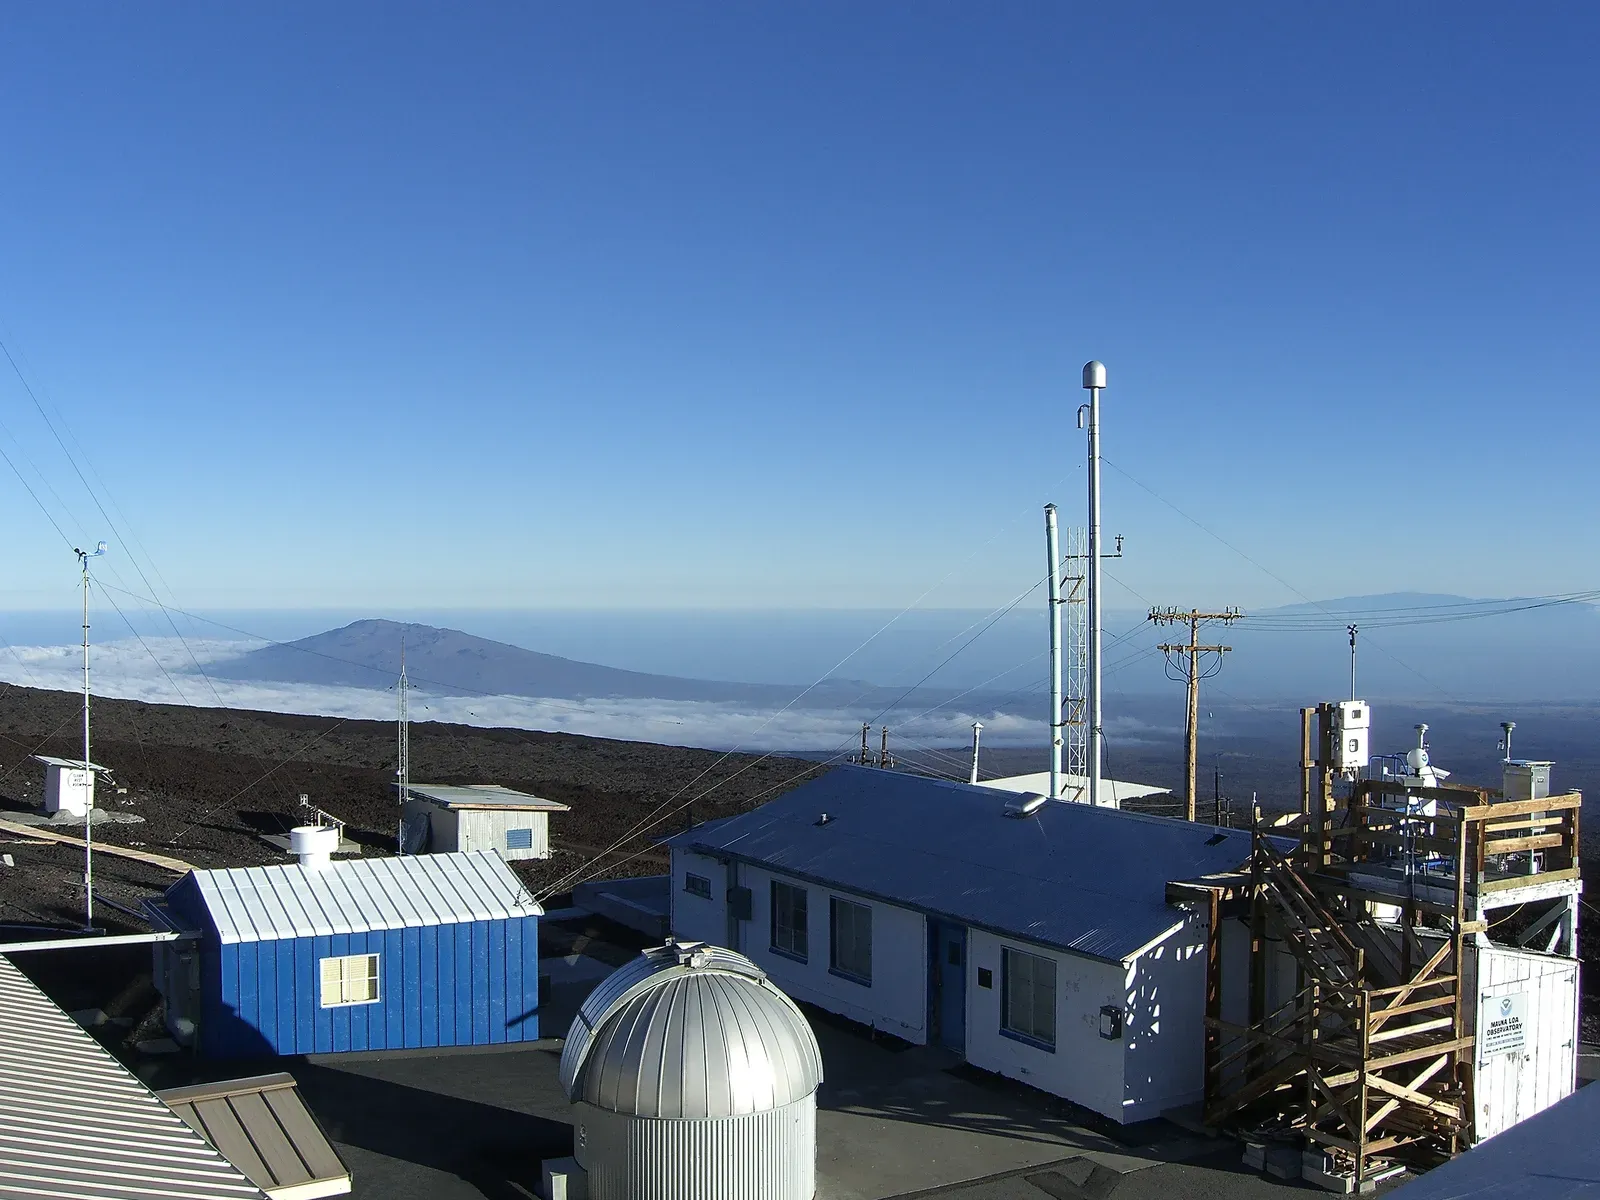
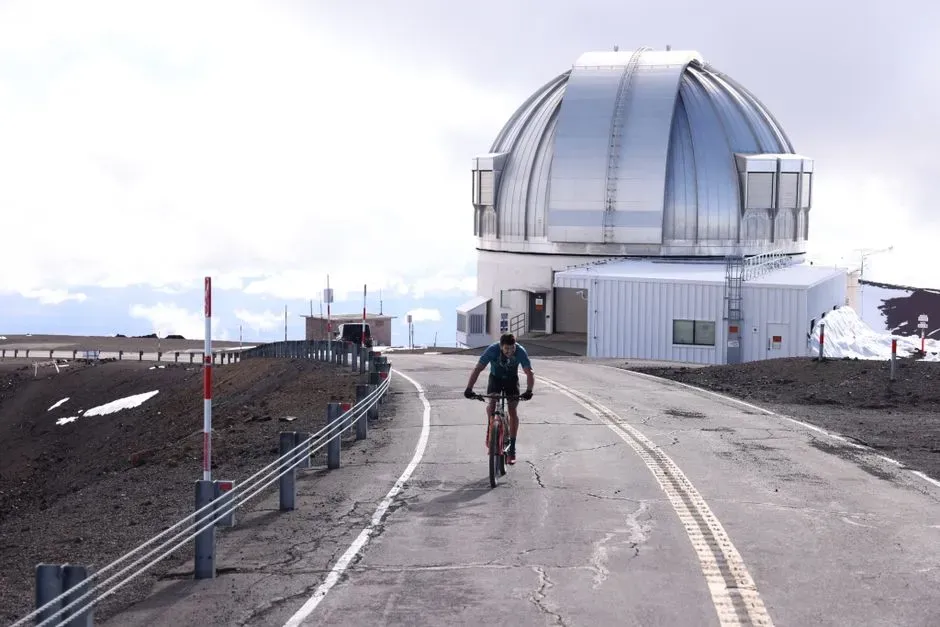
Location matters a great deal for this kind of measurement. The observatory sits at 11,141 feet above sea level, so it samples air representative of the Northern Hemisphere mid-troposphere. That height keeps it well away from cities and factories.
The air has mixed over thousands of miles of the Pacific Ocean, so the record is largely untainted by local pollution and reflects the true baseline of global greenhouse gas concentrations. In other words, the site gives a clean reading of the planet’s background air rather than of one region.
The Keeling Curve and Its Seasonal Rhythm
The famous graph from these measurements is called the Keeling Curve. CO2 levels peak in May, then dip during the Northern Hemisphere growing season. Plants take up carbon dioxide as they grow, and the dip follows.
Each year the zigzag repeats. Yet every peak and every trough sits higher than the one before, so the overall line climbs.
Where Levels Stood in 2024 and 2025
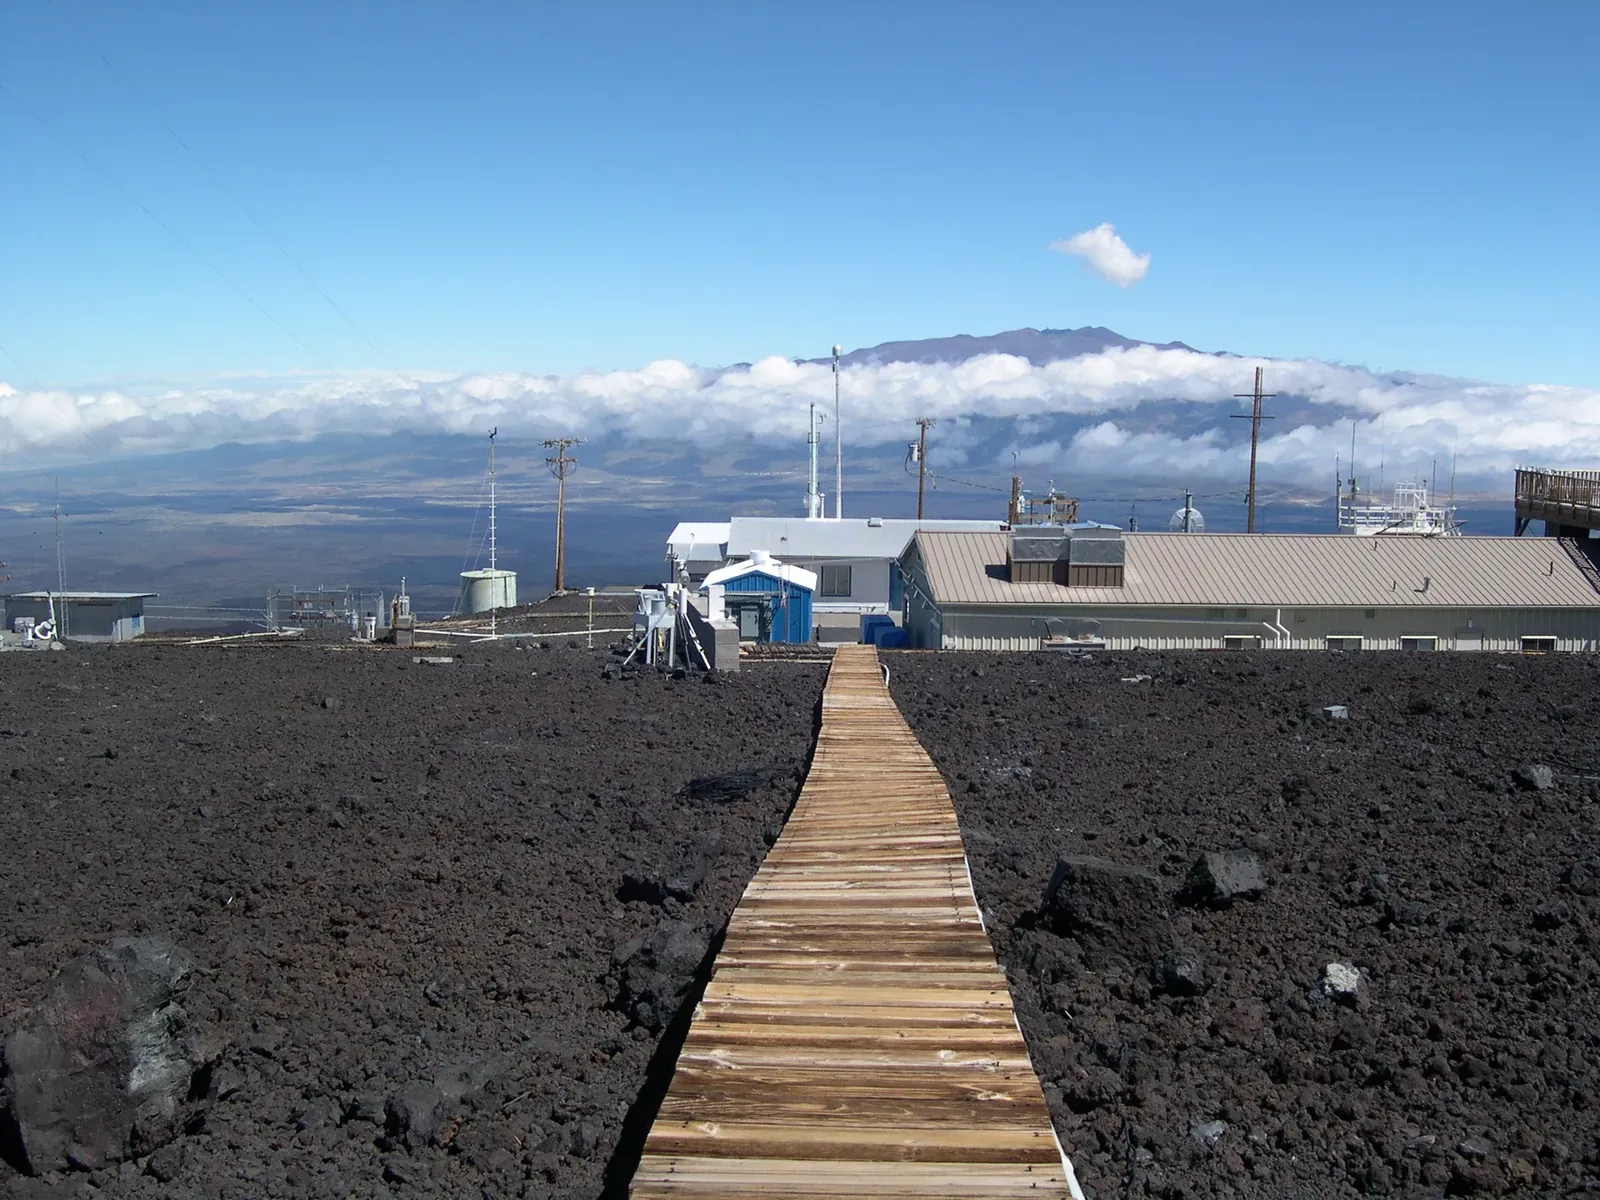
In 2025, a milestone was crossed. For the first time, the seasonal peak of carbon dioxide at NOAA’s Mauna Loa Observatory exceeded 430 parts per million. Scripps calculated a May 2025 monthly average of 430.2 ppm, up 3.5 ppm from May 2024’s 426.7 ppm.
NOAA’s Global Monitoring Laboratory reported a slightly different average of 430.5 ppm, an increase of 3.6 ppm. The two groups use separate analysis methods, so small gaps like this are normal and don’t signal disagreement about the trend.
The May 2026 Peak
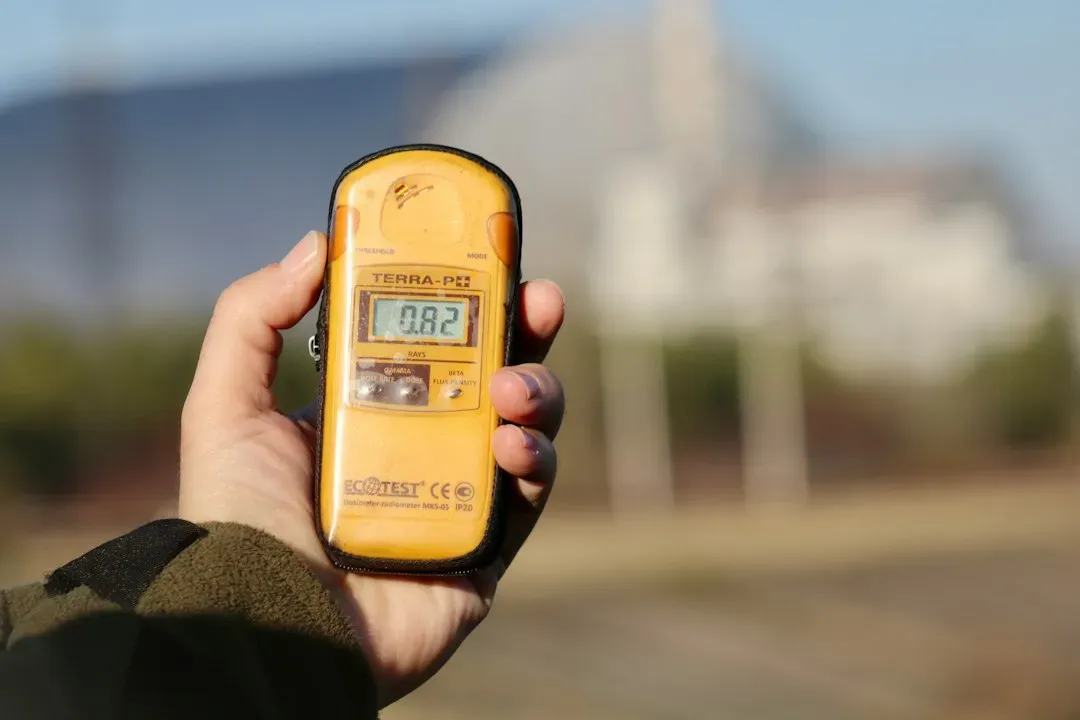
Scripps reported that carbon dioxide at Mauna Loa reached 432.00 ppm in May 2026. That’s 1.8 ppm above May 2025’s measurement of 430.2 ppm. The rise was smaller than the jump a year earlier.
NOAA reported an average of 432.3 ppm, also 1.8 ppm higher than the previous year. Both institutions agree the May peak is the highest in the record. For comparison, the May 2021 monthly peak was 419 ppm.
A Record Year for Growth
Not every year adds the same amount. From 2023 to 2024, CO2 at Mauna Loa rose 3.33 ppm, the largest single-year increase in the record. Record emissions set the baseline, and the 2023 to 2024 El Niño pushed the increase higher.
That shows how natural climate swings can raise or lower the yearly gain. Even so, the direction has not changed. Every year since 1959 has had more CO2 in the air than the year before.
Six Decades of Climb
The annual average has gone from 316 ppm in 1959 to 427 ppm in 2025. A reference line marks the pre-industrial average at about 280 ppm. Today’s levels sit far above it.
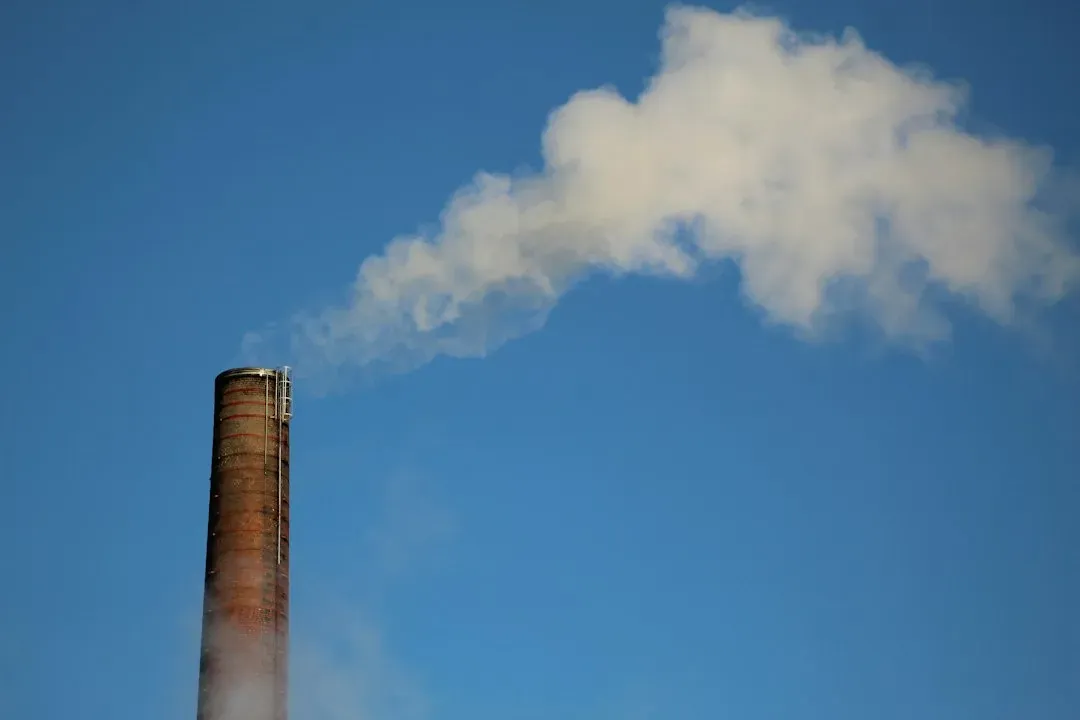
The speed has changed too. The average annual CO2 rise has grown over the six decades of the record, mainly because of human-caused emissions from burning fossil fuels. A single analysis puts it that CO2 is now accumulating about three times faster than in the 1960s.
The 2022 Eruption and the Continuity of the Data
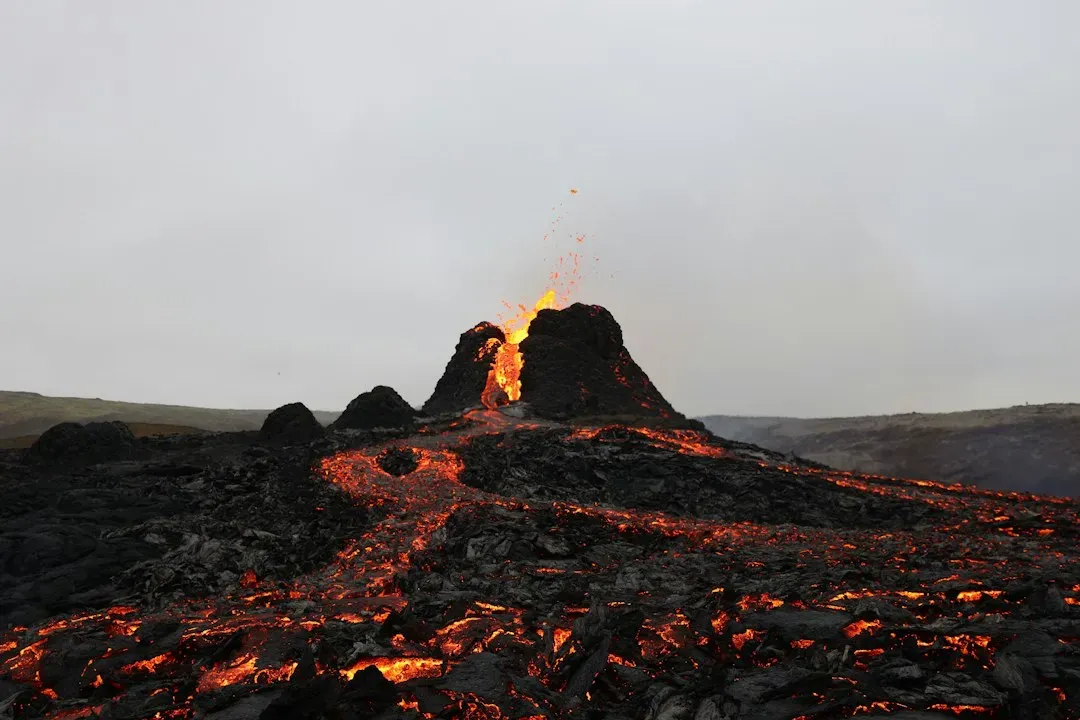
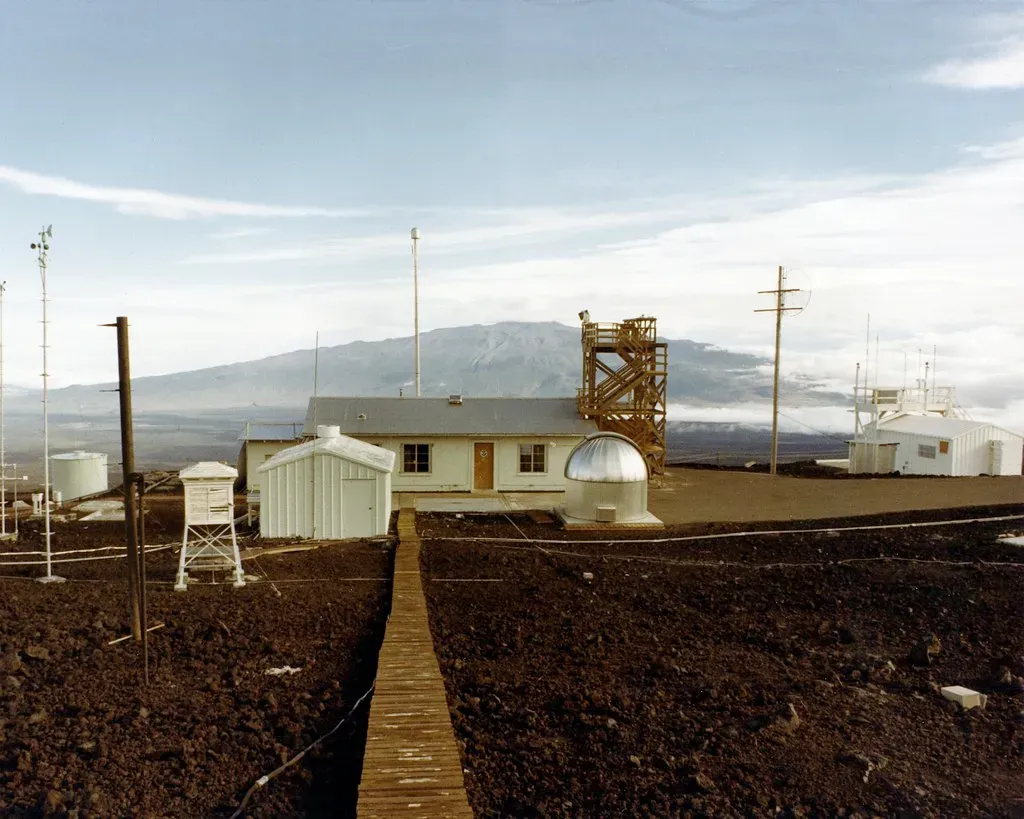
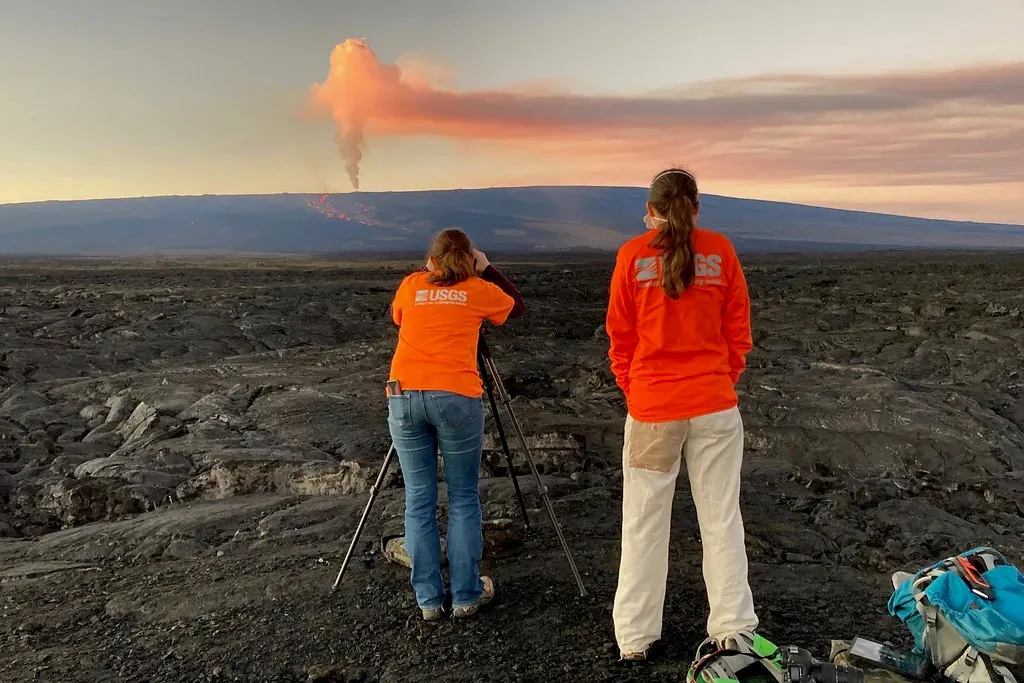
The record has been threatened by nature before. Because of a 2022 eruption at Mauna Loa, NOAA’s measurements came from nearby Maunakea between late 2022 and mid-2023. Lava cut power access to the site, which forced the move.
The Mauna Loa measurements have since been restored after the disruption and remain a key baseline. Scientists could bridge the gap because the two sites sample similar background air.
Forecasts and Funding Questions for 2026
The UK Met Office forecast the 2026 annual average at Mauna Loa to be 2.37 ± 0.55 ppm higher than in 2025. That would put the 2026 annual average at 429.4 ± 0.6 ppm. The forecast also accounts for La Niña conditions, which tend to slow the rise slightly.
The record’s future support is less certain. A NOAA budget proposal for fiscal year 2027 would cut funding to several climate monitoring facilities, including Mauna Loa. Reporting on the proposal notes this could leave the foundational CO2 record without its primary data source.
Why the Measurements Still Matter
The Mauna Loa data, along with measurements from stations around the world, feed into NOAA’s Global Greenhouse Gas Reference Network. That network is a core dataset for international climate researchers and a benchmark for policymakers.
Scripps and NOAA both continue to publish the readings. Scripps operates the original Keeling Curve program and manages 14 global sampling stations. The record that began in 1958 now stands at 432 ppm for the May 2026 peak.

- Asteroid 2024 YR4 Once Had a 3% Chance of Hitting Earth – How Astronomers Ruled It Out - November 12, 2026
- How and When to Watch the Orionid Meteor Shower This October - November 12, 2026
- Blue whales vanish from the Galápagos, and scientists suspect El Niño - November 11, 2026
