


- The Planet Where It Rains Liquid Glass – 7 Alien Worlds Defying Known Physics - November 14, 2026
- Stars Consuming Entire Worlds – 6 Planetary Systems Swallowing Their Own Worlds - November 14, 2026
- The Ground Liquefies Like Water – 6 Silent Fault Lines Geologists Watch Closely - November 14, 2026
14: The new baseline for an average season
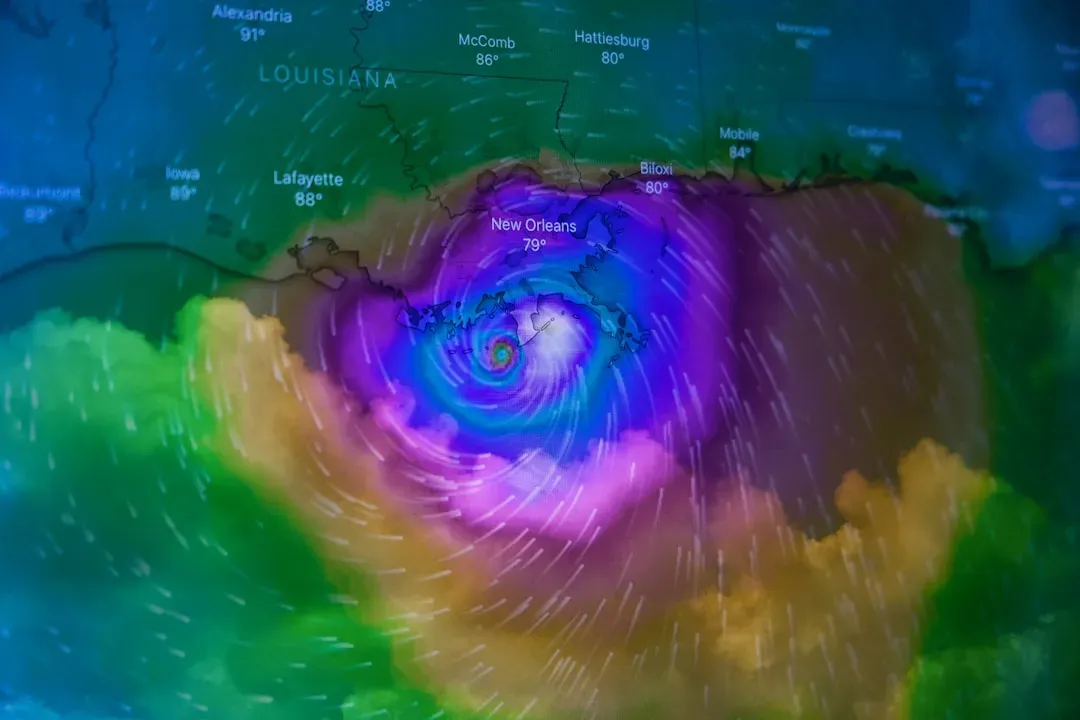
For decades, meteorologists told the public that a typical Atlantic season produced around 12 named storms. That changed in 2021, when NOAA updated its statistical baseline. Beginning with that year’s hurricane season outlooks, NOAA’s Climate Prediction Center began using 1991 to 2020 as the new 30-year period of record, and the updated averages for the Atlantic hurricane season increased to 14 named storms and seven hurricanes.
That’s not a small bump. The previous Atlantic storm averages, based on the period from 1981 to 2010, were 12 named storms, 6 hurricanes, and 3 major hurricanes. NOAA itself pointed to two overlapping causes: the overall improvement in observing platforms, including NOAA’s fleet of next-generation environmental satellites and continued hurricane reconnaissance, along with the warming ocean and atmosphere influenced by climate change. In other words, we’re seeing more storms partly because we’re better at spotting them, and partly because there are simply more to spot.
30: The record that shattered every name list
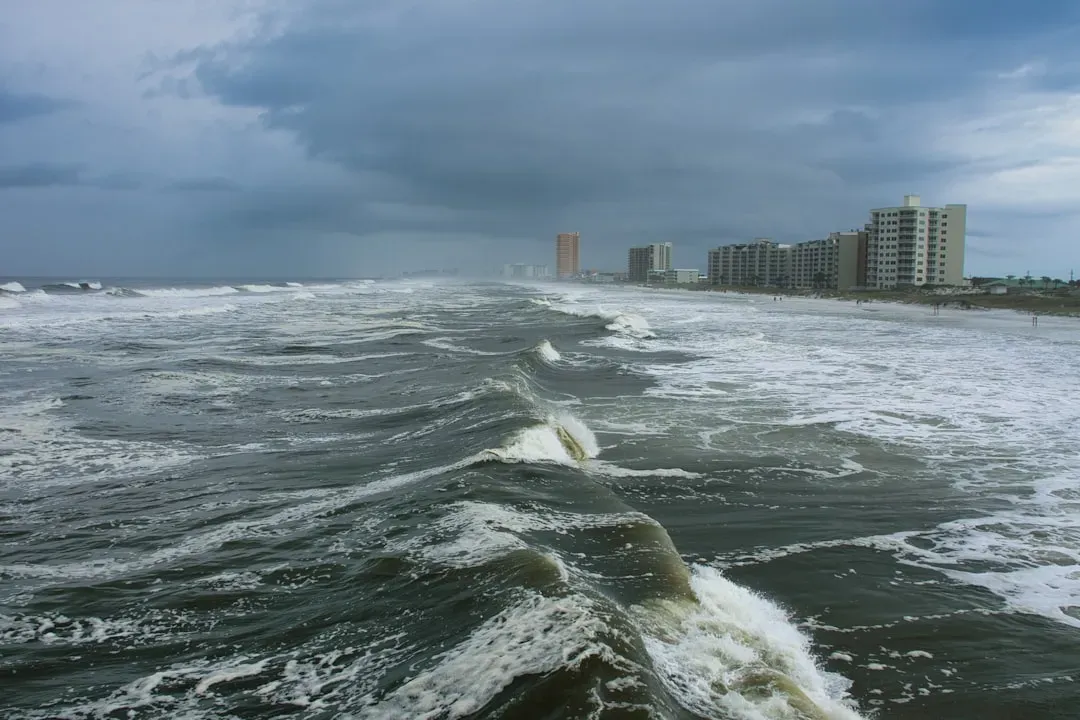
If 14 is the new normal, 2020 is the season everyone still talks about. The busiest year on record was 2020, when 30 storms reached tropical storm status, with 14 hurricanes, seven of which were considered major hurricanes. Forecasters ran through the entire alphabet and had to dip into supplemental lists, something that had happened only once before.
That season wasn’t an isolated fluke, either. The National Hurricane Center ran out of names for Atlantic storms in the last two years of that stretch, with a record-setting 30 named storms in 2020 and 21 the following year. Compare that to the quiet stretch three decades earlier, when the years 1991 through 1994 experienced the quietest tropical cyclone activity on record in terms of frequency of tropical storms, hurricanes, and intense hurricanes. The contrast between those two eras is about as stark as hurricane climatology gets.
Nearly doubled: How fast storms are blowing up
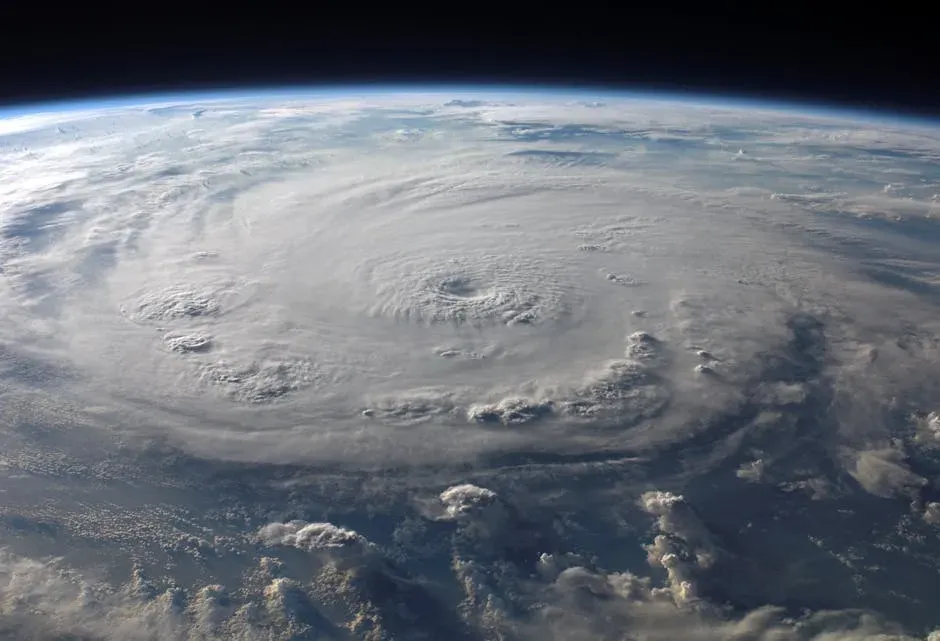
Rapid intensification, when a storm’s winds jump by at least 35 mph in a single day, used to be the exception. Now it’s practically routine for the strongest systems. About 80% of major hurricanes (Category 3-5) undergo rapid intensification, and from 1980 to 2023, 177 landfalling Atlantic tropical cyclones rapidly intensified above that threshold.
The frequency of the most extreme version of this has climbed even faster. In the North Atlantic, the number of storms that quickly intensified from Category 1 or weaker into a major hurricane has more than doubled in 2001-2020 compared to 1971-1990. Separate research backs this up with a specific figure: a 2023 study found that tropical cyclones in the Atlantic Ocean were around 29% likelier to undergo rapid intensification from 2001 to 2020, compared with 1971 to 1990. Hurricane Erin’s explosive jump from Category 1 to Category 5 in a little over a day, during the 2025 season, was a fresh reminder of exactly this pattern.
1.4: The extra punch near the coastline

It’s not just how often storms intensify rapidly, it’s where. Coastal waters, specifically, have become a hot zone for this behavior. Over the 40-year period of 1979-2018, the mean 24-hour hurricane intensification rate increased by about 1.4 mph per six-hour period near the U.S. Atlantic coast.
That number sounds modest until you consider what it means in practice: storms gaining strength right as they approach land, sometimes leaving residents and emergency planners with less warning than they’d get from a slower-moving system offshore. Interestingly, researchers found the Gulf Coast didn’t show the same pattern over that stretch. A significant increase in intensification did not occur near the Gulf Coast over the same period. The geography of risk, in other words, isn’t uniform even within the same basin.
3: Category 5 storms crowding into a single season
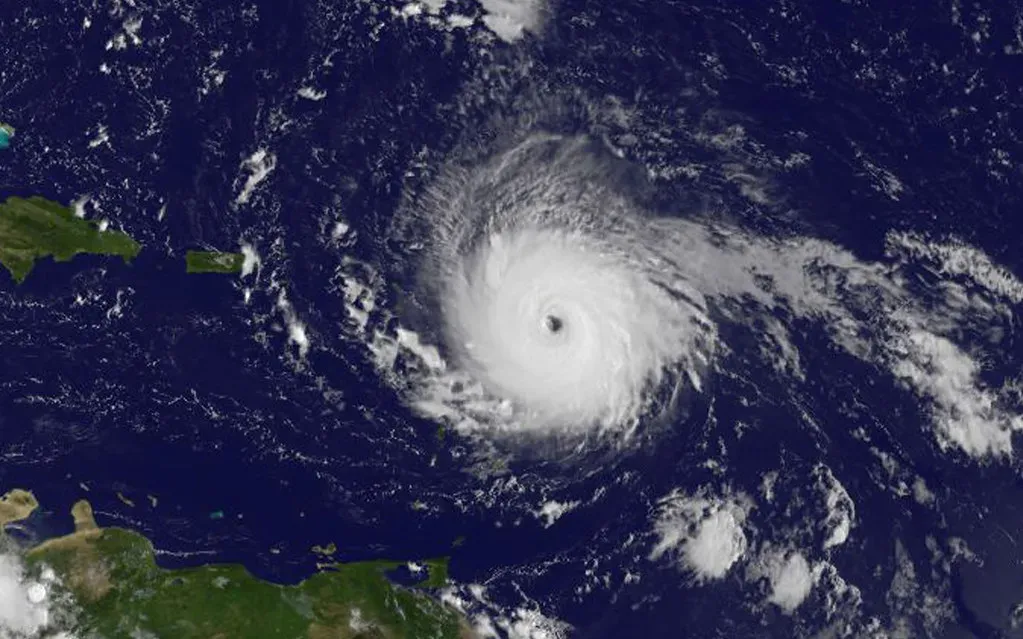
The 2025 season delivered a strange split: a historically quiet U.S. landfall record paired with extraordinary offshore intensity. While the climatological peak of the hurricane season was quiet with no tropical activity, the season generated three Category 5 hurricanes, the second-most on record in a single season.
Despite that raw power, the country caught a break. For the first time in a decade, not a single hurricane struck the U.S. that season, which officials called a much needed break. Even so, a tropical storm caused damage and casualties in the Carolinas, and distant hurricanes created rough ocean waters that caused property damage along the East Coast. Three Category 5 storms in one year, with almost none of that fury reaching American shores, is the kind of statistical oddity that underscores just how much luck plays into any given season’s outcome.
$1.5 trillion: What thirty years of hurricanes have cost
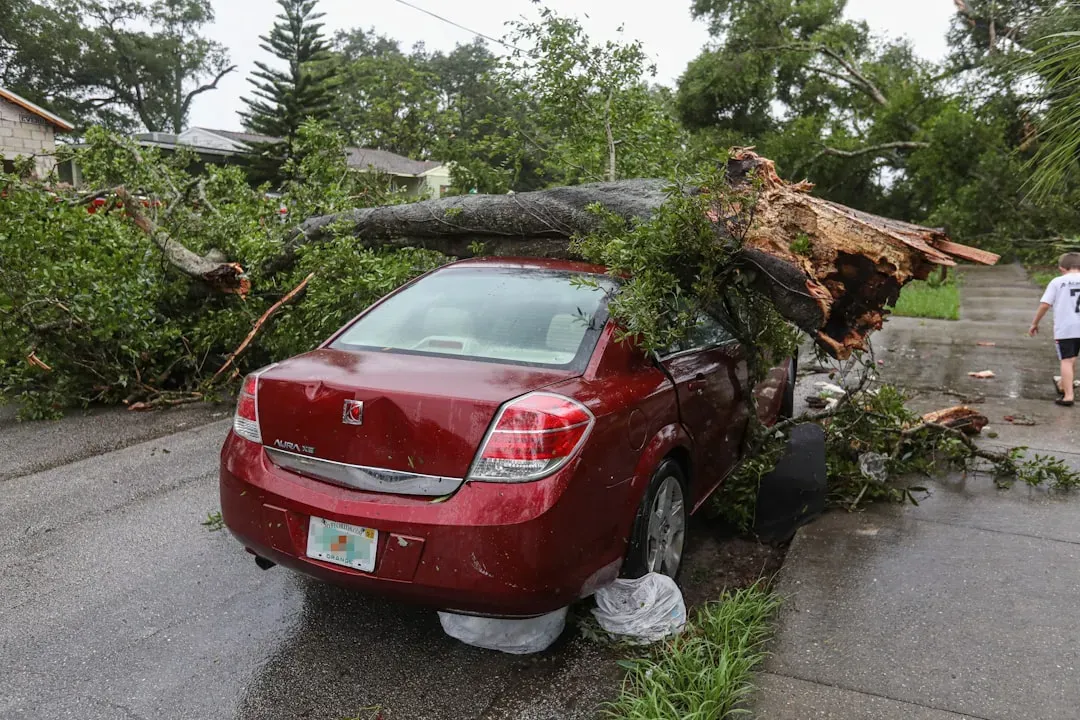
Money tells its own version of the climate story. Of the 403 billion-dollar weather disasters recorded since 1980, tropical cyclones have caused the most damage of any category: over $1.5 trillion total, with an average cost of $23 billion per event. That single category dwarfs droughts, wildfires, and severe storms combined.
The human toll sits right alongside the financial one. Hurricanes are also responsible for the highest number of deaths among billion-dollar disaster types, with 7,211 fatalities since 1980. Some of that rising cost reflects more people and property sitting in harm’s way along the coast, not just stronger storms, but the two forces have been compounding each other for years.
27: A single year’s worth of billion-dollar disasters
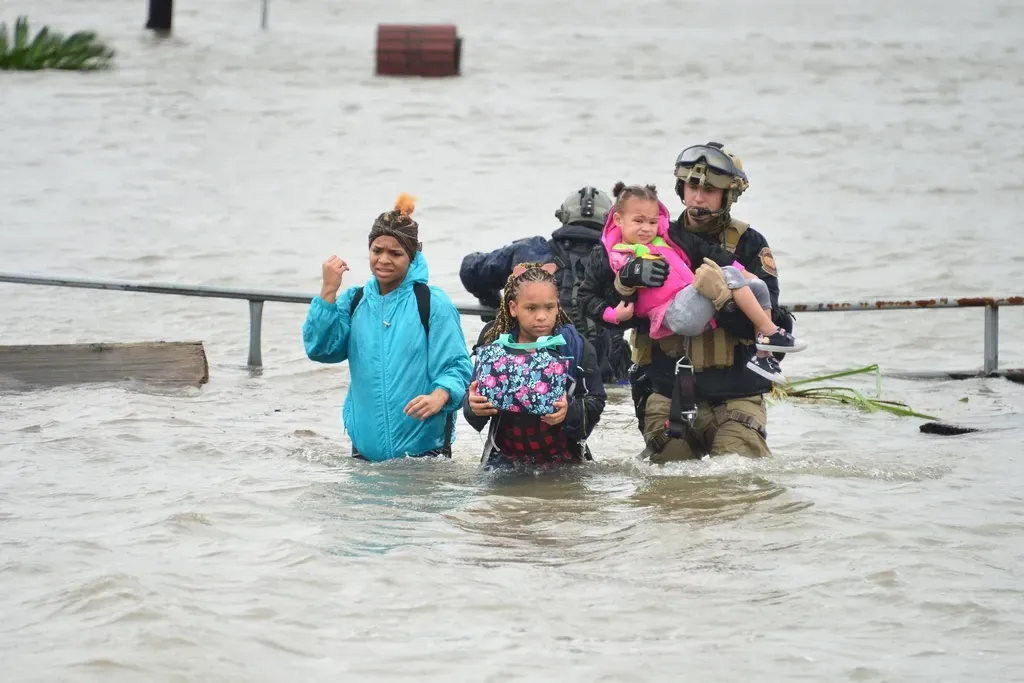
Zoom into just 2024, and the acceleration becomes obvious. The 27 billion-dollar disasters in 2024 resulted in $182.7 billion in damages, higher than the average annual amount of events (23) and the average annual cost ($149.3 billion) for the past five years, in a year that was also the warmest on NOAA’s global temperature record dating back to 1850. Hurricane Helene was a major driver of that total.
Category 4 Hurricane Helene, with 140 mph sustained winds, was the strongest hurricane on record to strike the Big Bend region of Florida when it made landfall near Perry, Florida on September 26, and it was the third hurricane to hit that region in just over a year. The scale of Helene’s rainfall was its own record. Its most severe impacts came from historic rainfall, up to 30-plus inches, and flooding across much of western North Carolina. A storm like that didn’t just add to a yearly tally, it reshaped how emergency planners think about inland flood risk from hurricanes that make landfall hundreds of miles from where the worst damage ends up occurring.
5 of 7: The years dominated by the strongest storms
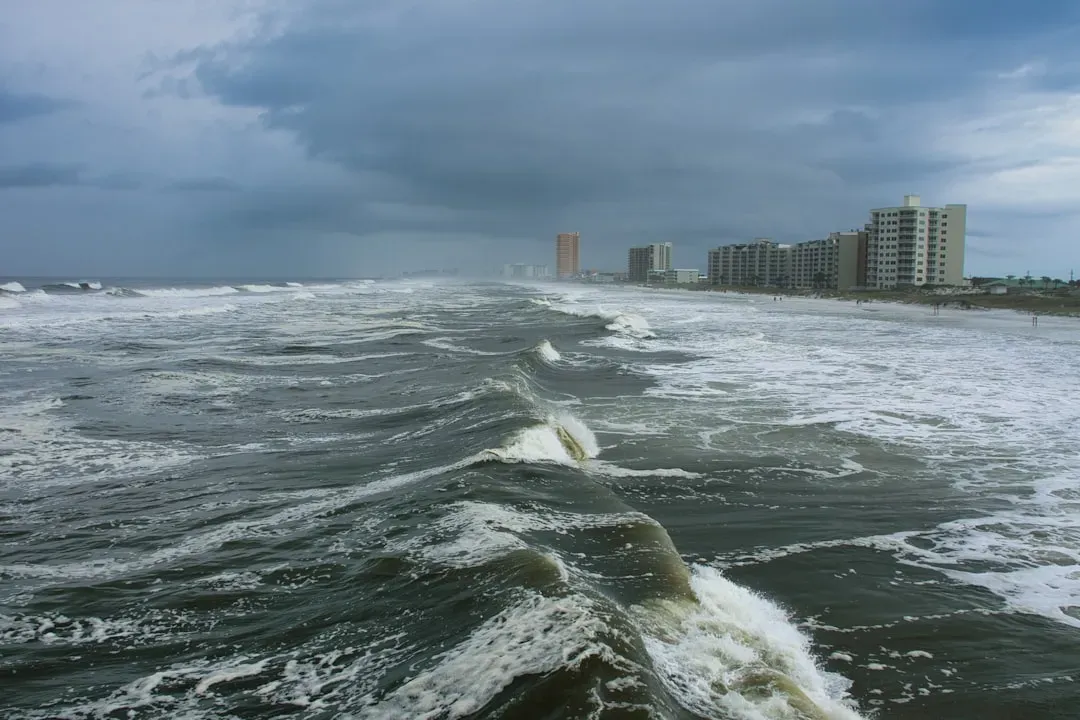
Perhaps the most telling number of all concerns which category of storm has been doing most of the damage. One of the drivers of rising hurricane costs is that the U.S. has been impacted by landfalling Category 4 or 5 hurricanes in five of the last seven years, including Hurricanes Harvey, Irma, Maria, Michael, Laura, Ida, and Ian. That’s a remarkably tight clustering of the most destructive storm categories within a short window.
Thirty years ago, a Category 4 or 5 landfall on the U.S. mainland was treated as a rare, generational event. Now it’s closer to a once-every-couple-of-years occurrence, at least based on the recent record. Whether that clustering continues, eases, or worsens through the rest of this decade is exactly the kind of question that keeps hurricane researchers, and coastal insurers, up at night.
