

Why the same question got three different answers
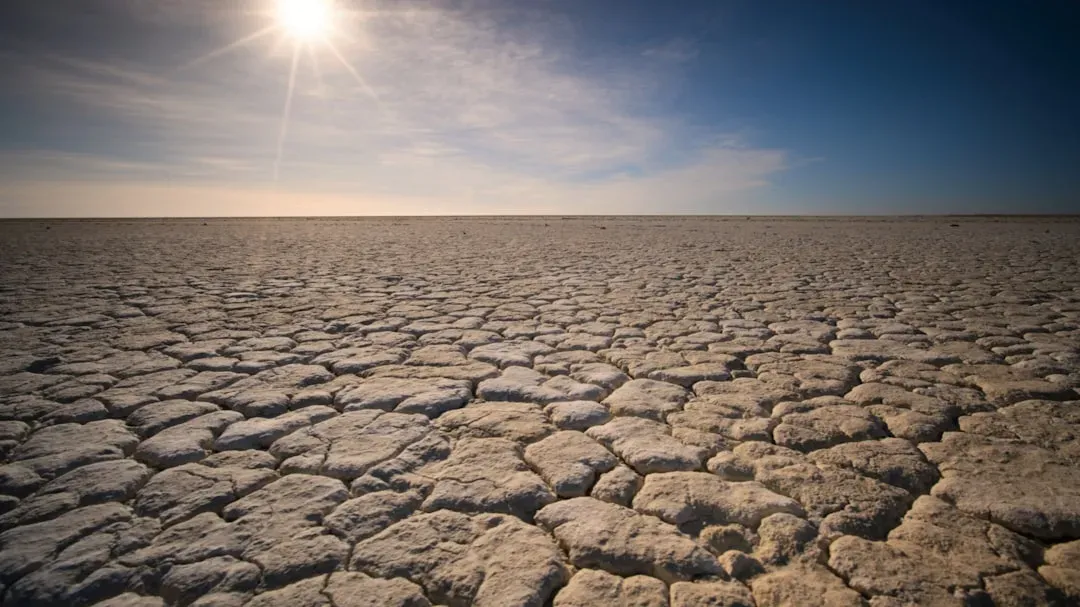
Water engineering isn’t a single discipline. A reservoir operator, a groundwater hydrologist, and a municipal supply planner all deal with drought, but they’re tracking entirely different variables and working on entirely different timelines. One watches elevation gauges update in real time. Another watches aquifer levels that shift over decades, not months.
That’s part of why their forecasts didn’t line up. Each person answered the question honestly, using the data closest to their own job, and the data itself tells slightly different stories depending on where you’re standing in the system.
The reservoir engineer’s view: the numbers are already historic
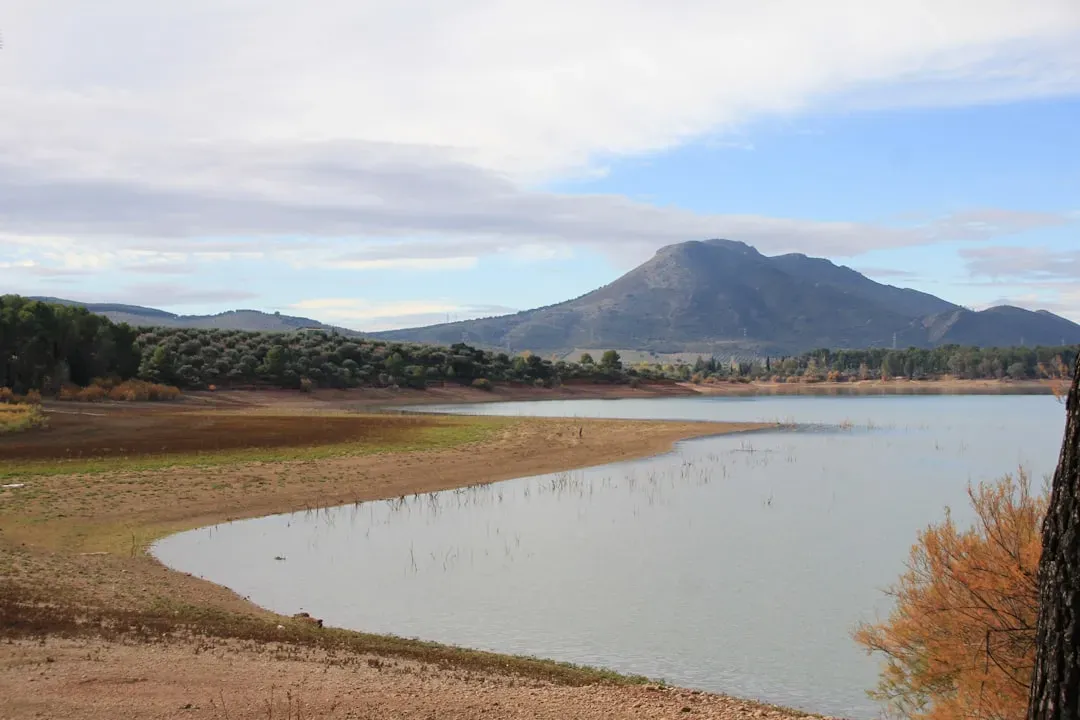
For someone who spends their days tracking surface water storage, the picture is grim in a very concrete, measurable way. The combined water level in Lake Powell and Lake Mead fell to a historic low in July 2026, with the two reservoirs not this low since 1957, before Lake Powell even existed. That’s not an abstract projection. It’s a number on a gauge.
By late July, Lake Mead was 27.0% full at 1,041.10 feet and Lake Powell was 23.1% full at 3,522.27 feet, together holding 12.44 million acre-feet, about 25.2% of their combined capacity. A reservoir engineer reading those figures isn’t speculating about a future drought. They’re describing one that’s already underway, with researchers predicting the two reservoirs will set a new record low for combined storage every day until spring runoff begins.
The groundwater hydrologist’s view: the slower emergency underneath
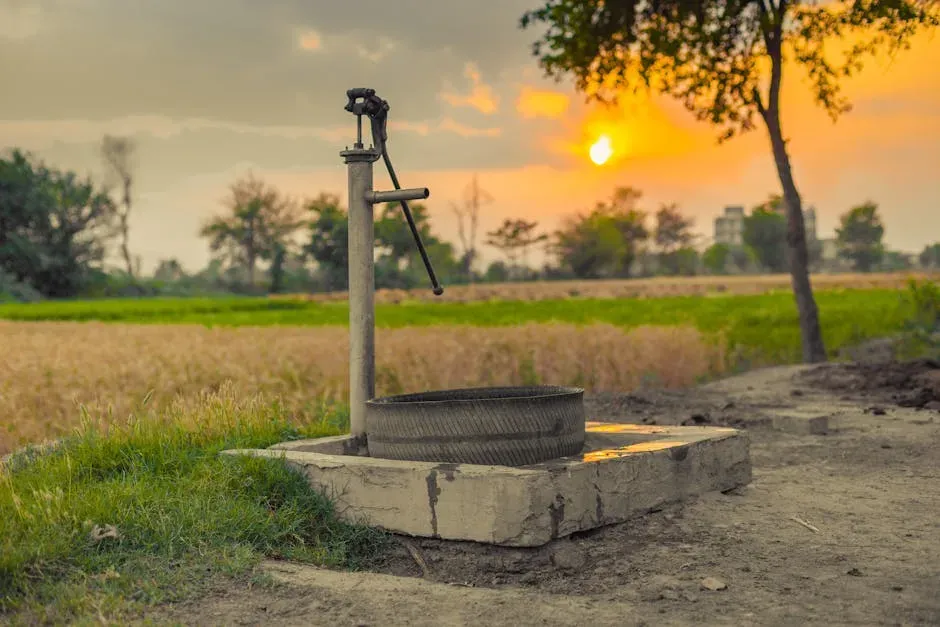
A groundwater specialist tends to answer the same question with more hesitation, and for good reason. Aquifers don’t respond to a single bad winter the way a reservoir does. They accumulate stress over years, sometimes decades, and the depletion doesn’t show up on the evening news the way a shrinking lake does.
This is where the disagreement starts to make sense. A hydrologist focused on groundwater will often say the surface water crisis is dramatic but comparatively fast moving, while the aquifer decline underneath farming regions is quieter and harder to reverse. Both things can be true at once, which is exactly why one engineer’s “moderate concern” can sound like another’s “five alarm fire.”
The municipal engineer’s view: it’s about demand, not just rain
A third kind of answer comes from the people who run city water systems. Their job isn’t to predict rainfall. It’s to make sure taps keep running regardless of what the sky does, which means their drought forecast is filtered through infrastructure capacity, storage contracts, and population growth.
From that seat, the question shifts from “how dry will it get” to “how much slack is left in the system.” A municipal engineer worried about demand growth in a fast growing suburb will describe risk very differently than one managing a shrinking rural town, even if both cities pull from the same drought stricken river.
Where all three actually agreed
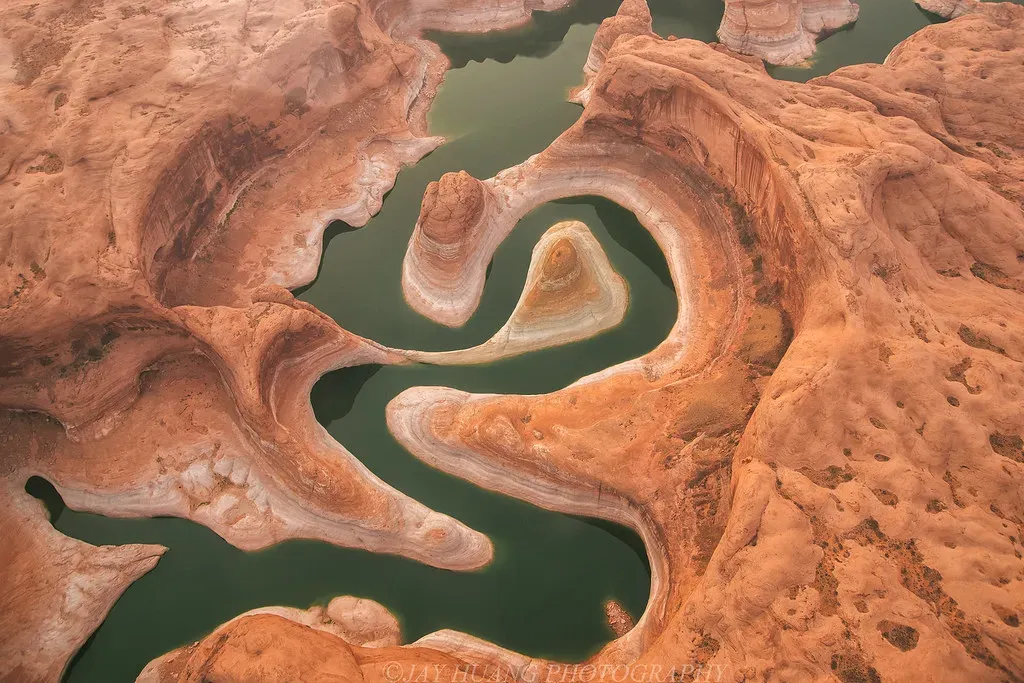
Despite the different emphasis, there was real common ground. All three pointed to the same root cause: the Colorado River has shrunk rapidly over the past 25 years as water demand has boomed and climate change has delivered hotter, drier weather and dwindling snow. Nobody disputed that the underlying trend is real and ongoing.
They also agreed on scale. Ninety-five percent of the basin is currently in drought, a figure none of them treated as debatable. The disagreement wasn’t about whether conditions are bad. It was about which measurement best captures how bad, and what happens next.
Where the forecasts genuinely diverged
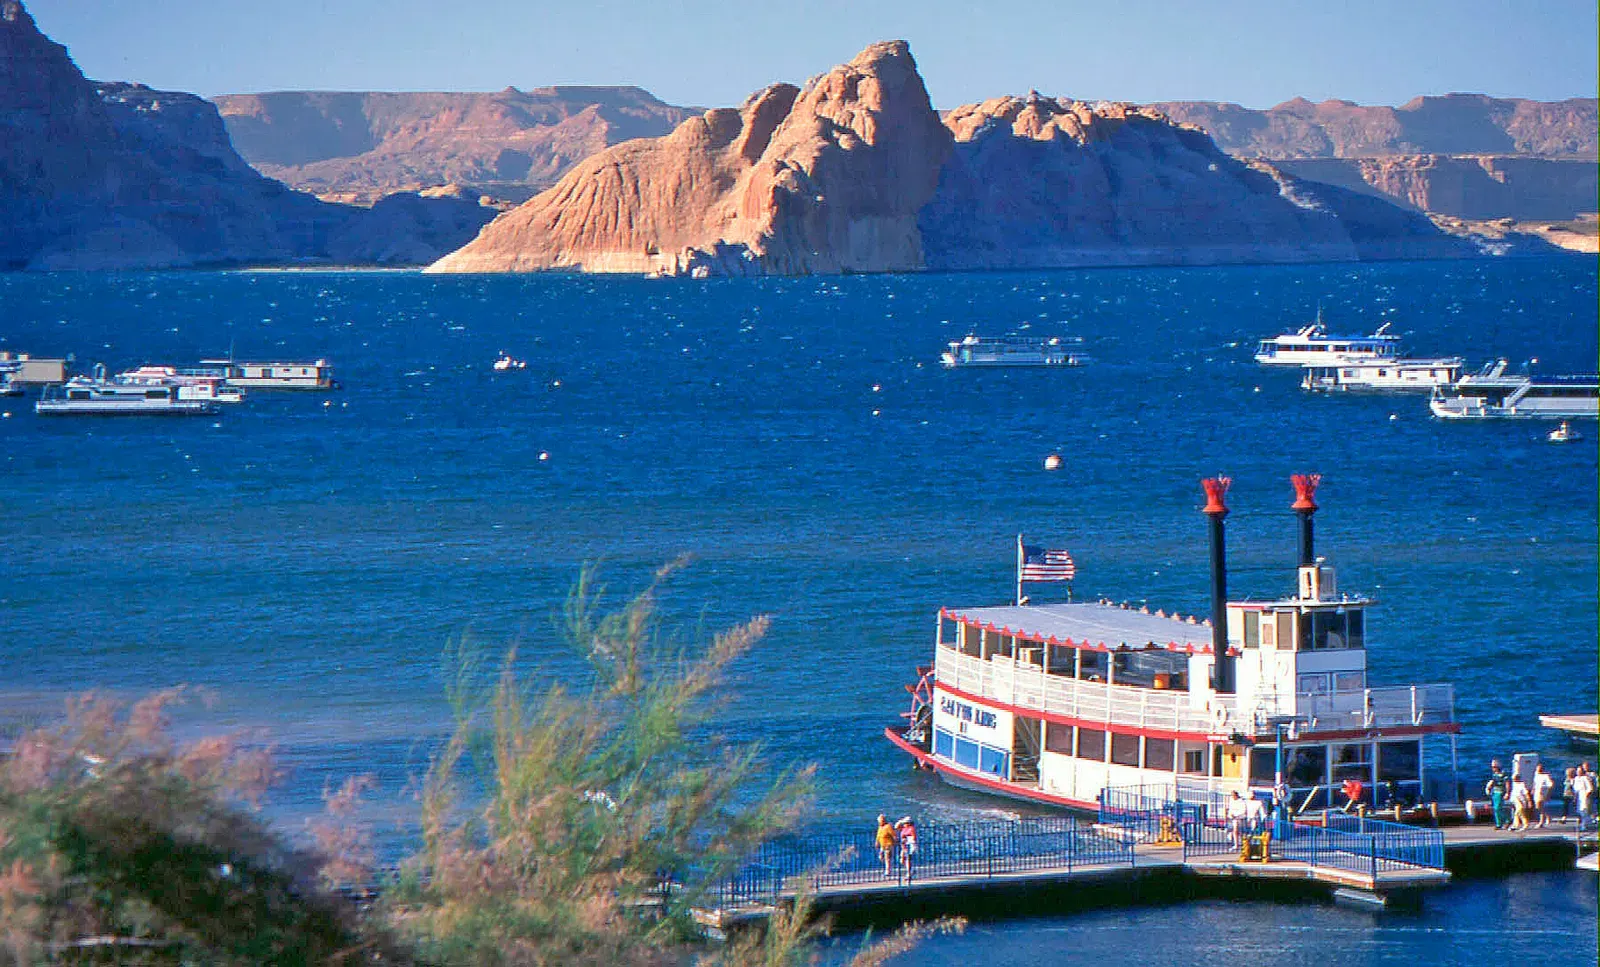
The sharpest disagreement showed up around timing and severity of recovery. A July report from the Bureau of Reclamation noted Lake Powell could fall so low by spring 2027 that it reaches minimum power pool, meaning the dam would no longer generate hydropower. The reservoir focused engineer treated that as close to inevitable without major intervention.
The groundwater and municipal perspectives were less alarmed about that specific threshold, partly because their own systems have more buffer built in. That’s a real structural difference, not just a difference in personality or pessimism. Some parts of the water system have almost no cushion left. Others still have room to absorb another bad year.
The snowpack numbers that started all of this
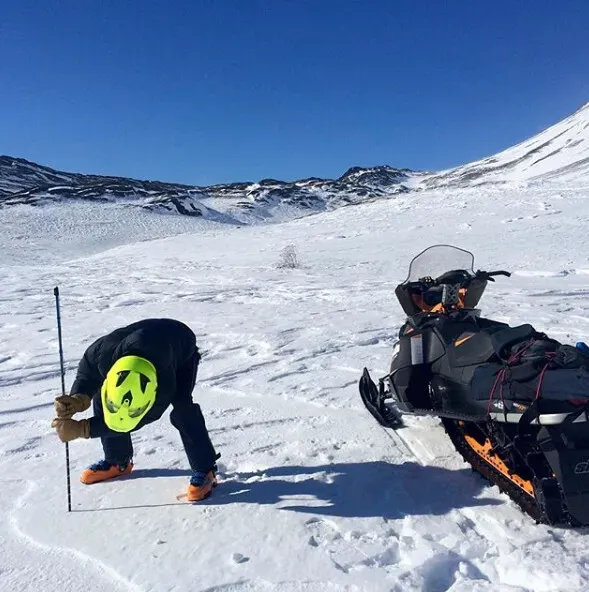
Much of the current disagreement traces back to one brutal winter. This year’s peak snowpack set a new benchmark low for Wyoming, Utah, Colorado, and New Mexico, with snow water equivalent around April 1 running 32 to 53 percent lower than the previous record low during the SNOTEL era. That’s not a modest shortfall. It’s a record breaking one across four states at once.
Basin wide, snow accumulation above Lake Powell peaked at just 8.9 inches, only 60% of the 30-year peak median of 14.8 inches. Every engineer I spoke with cited that number, but they weighted it differently depending on how directly their part of the system depends on snowmelt versus stored water or groundwater reserves.
Why the same data still produces different forecasts
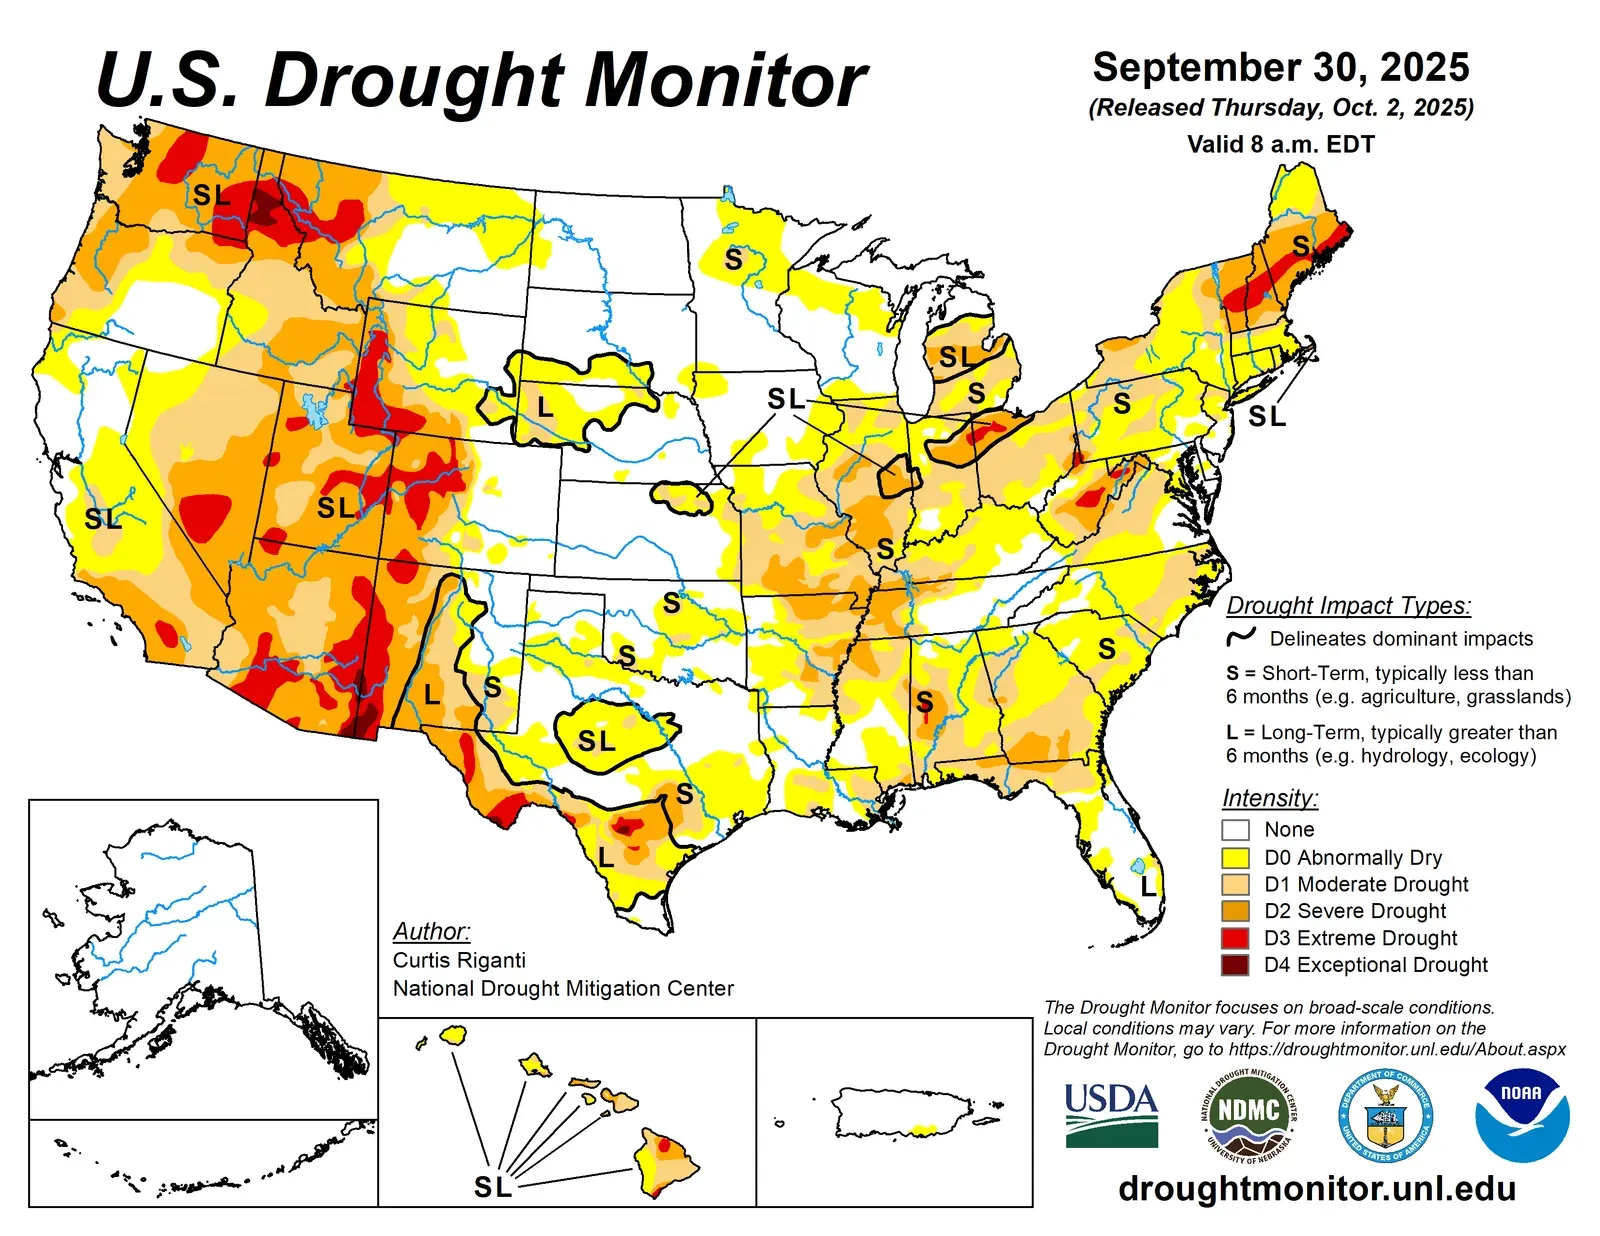
Drought forecasting isn’t a single calculation. Predicting drought depends on forecasting precipitation and temperature within the context of complex climate interactions, and many different datasets and maps exist that predict how those variables may change. Different engineers reasonably lean on different models built for different purposes.
Even official government outlooks hedge their language for this reason. NOAA’s own spring assessment described conditions in terms of probability, not certainty, noting that drought was likely to persist across much of the West while developing in parts of the Pacific Northwest, Great Basin, central Rockies and Southwest, while dry conditions were expected to improve in parts of the Midwest and Atlantic seaboard. That kind of regional patchwork forecast almost guarantees that specialists focused on different regions or different water sources will land on different conclusions.
What history says about trusting any single drought forecast
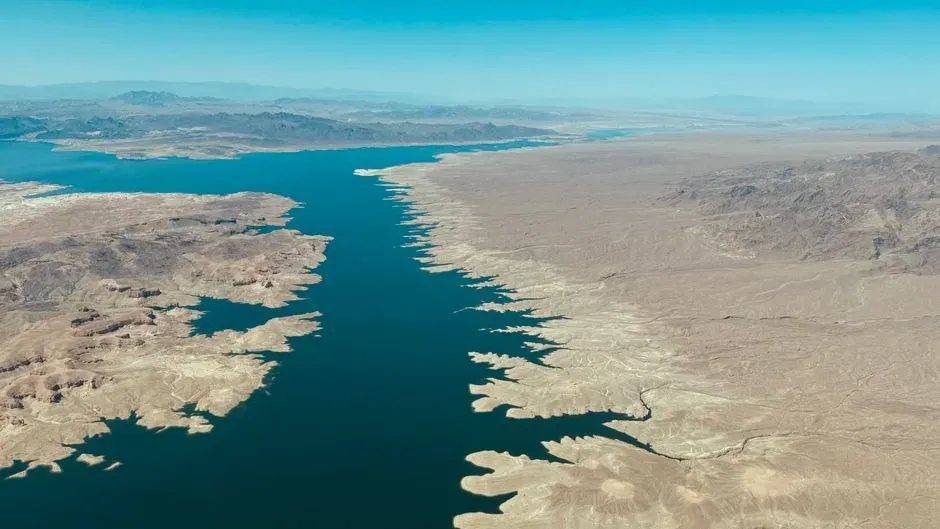
The Colorado River basin has a track record of surprising the people who study it closely. Over the past 27 years, the river’s flows have dropped 20% compared with the 20th century average, and since 2020 the river’s flow has averaged about 10.2 million acre-feet a year, a 33% decline. Those are the kinds of numbers that outpace even cautious projections made just a few years earlier.
Inflow into Lake Powell this year illustrates just how far off a single season can run from expectations. The flow of water into Lake Powell sparked concerns this year, with about 950,000 acre-feet entering the reservoir according to federal officials, roughly 15% of normal. When actual inflow lands that far below typical projections, it’s a reminder that even well built models carry real uncertainty, and that any single engineer’s estimate is really a probability, not a promise.
What this means if you’re not an engineer at all
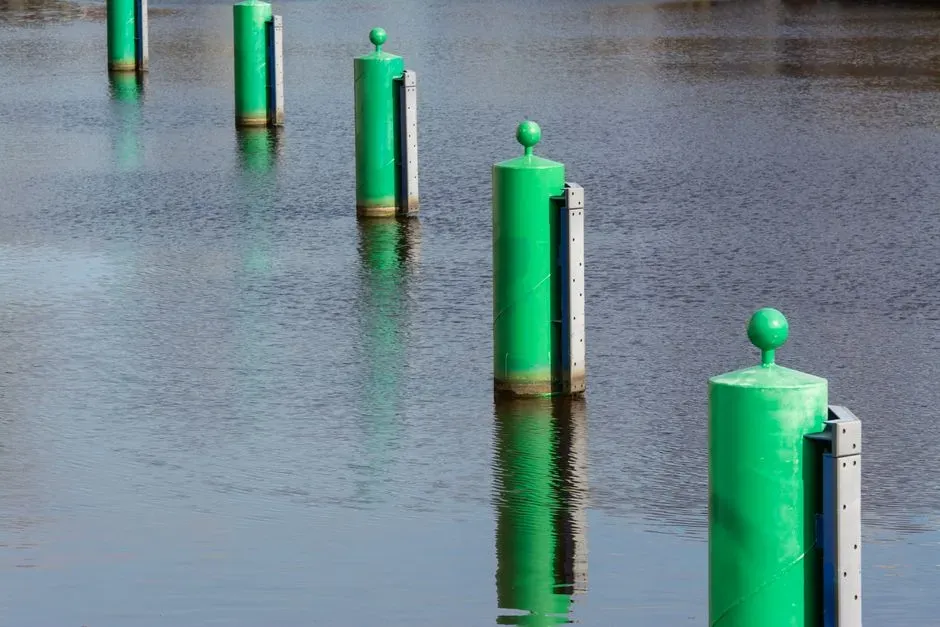
For most people, the practical takeaway isn’t which specialist is “right.” It’s that the water system relied on by tens of millions of people, with more than 40 million relying on the river system according to the Bureau, is being stretched from multiple directions at once, not just one. Surface storage, groundwater, and demand growth are three separate pressure points, and they don’t necessarily peak at the same time.
That’s worth remembering the next time a single headline number, a reservoir percentage or a snowpack figure, gets treated as the whole story. It’s one piece of a much larger and more complicated system, and the people who manage that system every day still don’t fully agree on how the next chapter plays out.
The takeaway
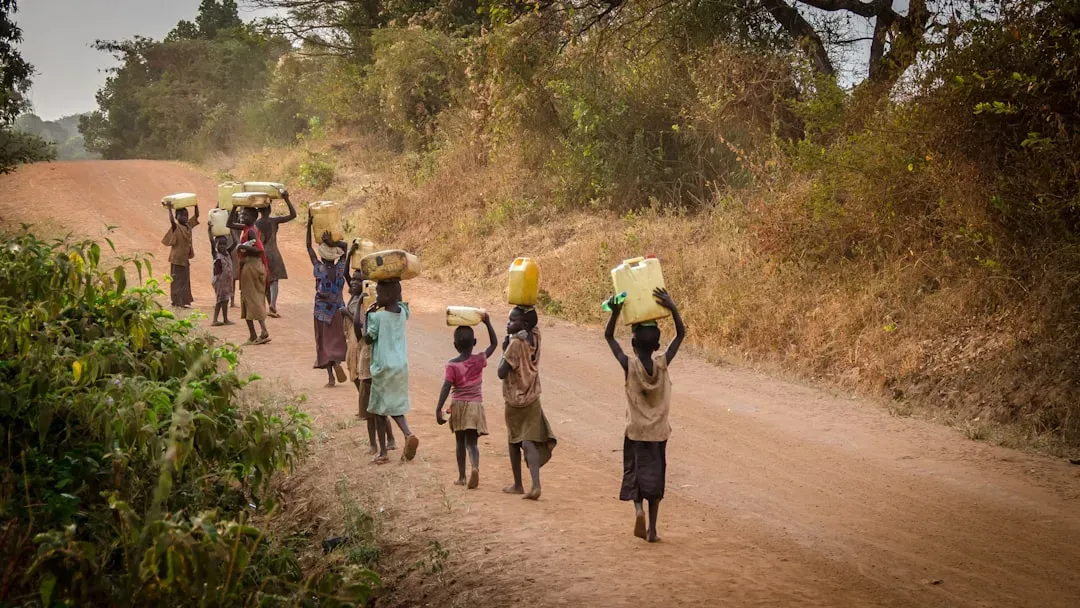
Three engineers, three vantage points, three honest but different readings of the same crisis. That’s not a failure of expertise. It’s an accurate reflection of how fragmented and regionally specific water management actually is in the American West right now.
If there’s a lesson in the disagreement, it’s that drought planning has to account for more than one kind of scarcity at once, because the reservoirs, the aquifers, and the pipes serving growing cities aren’t all running out of slack at the same speed.

- The Shoreline Sucked Dry in Seconds – 5 Tsunami Signals Beachgoers Mistake for Low Tide - November 14, 2026
- 9 Dark-Sky Destinations Around the World Where the Stars Look Unreal - November 14, 2026
- The Fault Line That Never Slips – 7 Locked Seismic Zones Overdue for a Massive Release - November 14, 2026
