

- NASA invites students to design a moon base in $1 million challenge - November 11, 2026
- Why Some People Can Feel a Storm in Their Joints, According to Experts - November 11, 2026
- 7 Foods That Taste Better on a Rainy Day, According to Chefs - November 11, 2026
1. Ocean temperature signatures are opposite by design
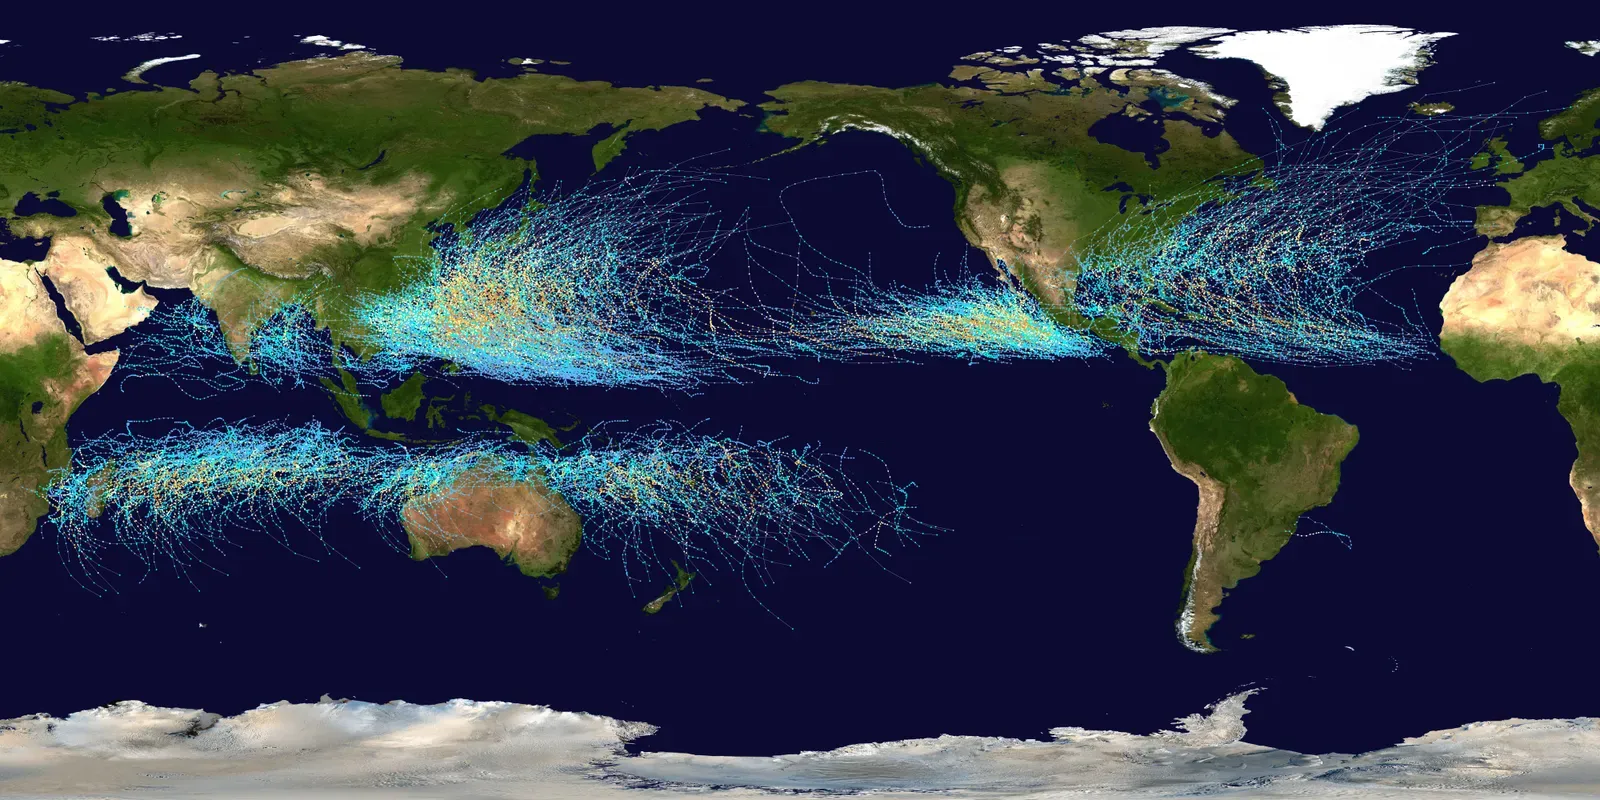
The most basic distinction between the two patterns comes down to sea surface temperature in the central and eastern tropical Pacific. NOAA declares an El Niño has formed when temperatures in the equatorial Pacific are 0.5°C above average for several consecutive months. La Niña works the same way in reverse, with the same region running notably cooler than average for an extended stretch.
These shifts aren’t subtle background noise; they’re the engine driving nearly everything else on this list. El Niño and La Niña are the warm and cool phases of a natural climate pattern across the tropical Pacific known as the El Niño-Southern Oscillation, and the pattern shifts back and forth irregularly every two to seven years. That irregular timing is part of why forecasters watch the data so closely rather than assuming a fixed schedule.
2. Strength and intensity vary widely between events
Not every El Niño or La Niña behaves the same way, even within the same category. Some events barely clear the threshold and fade quickly, while others intensify into what NOAA classifies as strong or even very strong episodes. Forecasters have predicted a 63% chance of sea surface temperatures exceeding 2.0°C in the Niño-monitored region of the Pacific, and if that threshold is surpassed, NOAA considers the event a very strong El Niño.
The 2026 event is a good example of how quickly conditions can escalate. El Niño has been strengthening, with a greater than 90% chance of a very strong event during the Northern Hemisphere fall and winter 2026-27. La Niña events tend to follow a similarly wide range, from weak and short-lived to multi-year episodes that linger for several winters in a row.
3. Their global rainfall footprints run in opposite directions
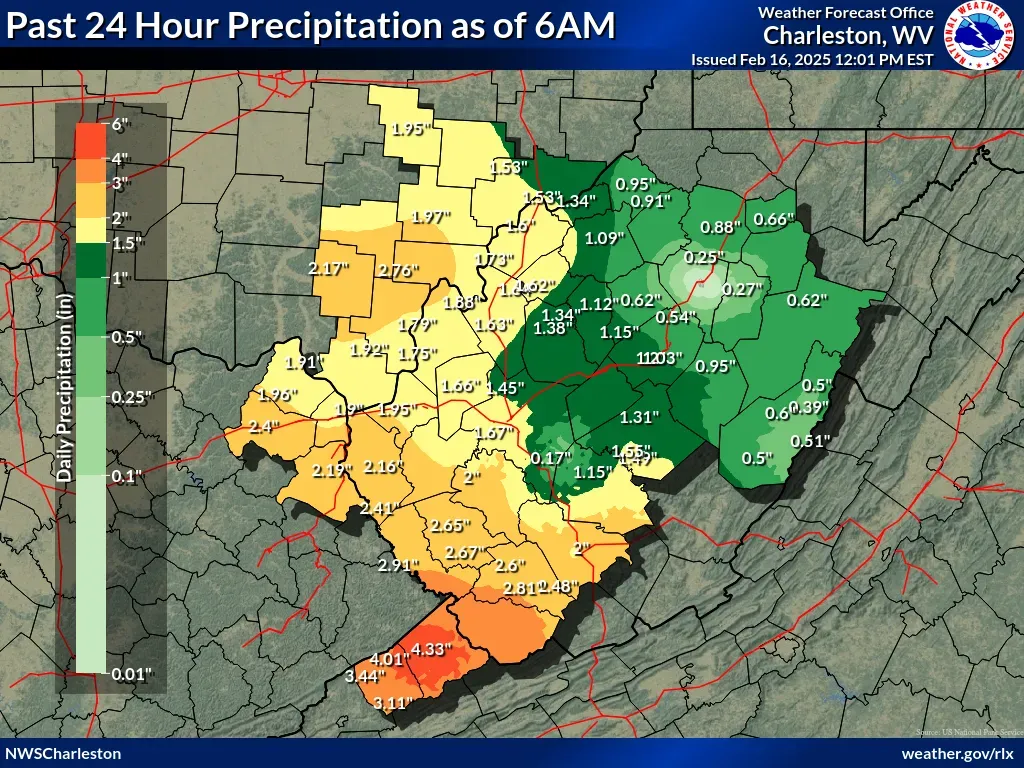
One of the clearest ways to tell these patterns apart is by looking at where the rain falls, and where it doesn’t. El Niño tends to shift moisture away from parts of the western Pacific and toward the central and eastern Pacific, often drying out regions like Indonesia and parts of Australia while soaking areas of South America. La Niña generally reverses that setup, favoring wetter conditions in the western Pacific and drier stretches elsewhere.
These shifts have real consequences for agriculture and water supply in affected regions. The pattern brings predictable changes in ocean temperature and disrupts the normal wind and rainfall patterns across the tropics, and these changes have a cascade of global side effects. Farmers and water managers in ENSO-sensitive regions often plan planting and irrigation schedules around whichever phase forecasters expect.
4. U.S. winter weather responds in nearly mirror-image ways
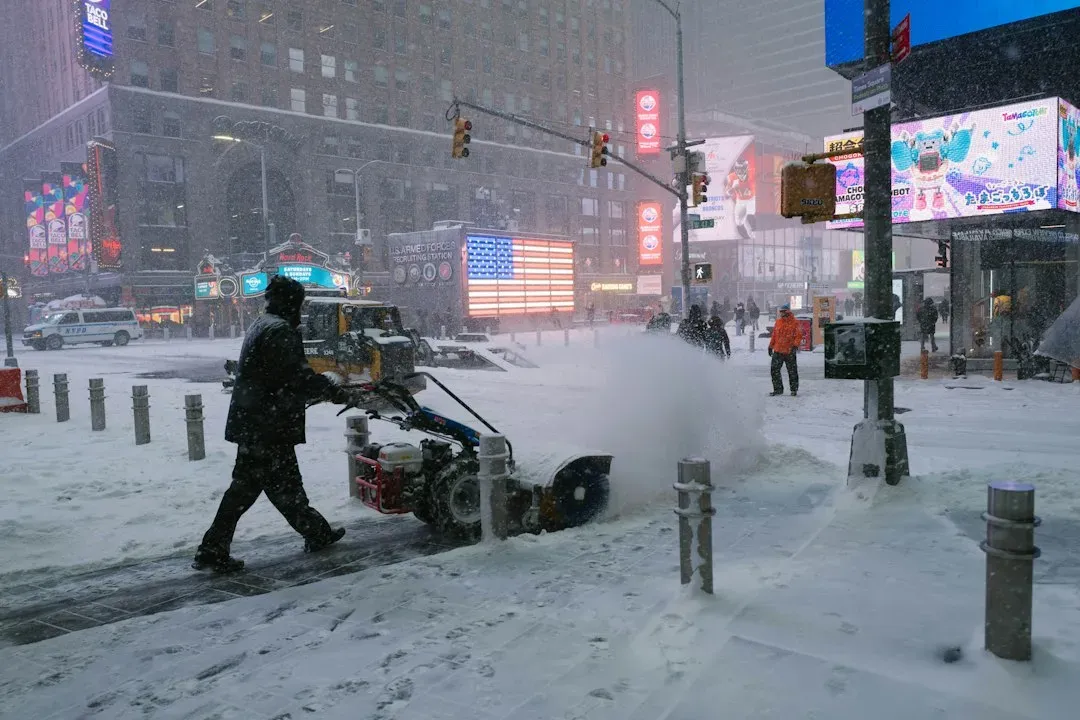
For people living in the United States, the most noticeable difference often shows up in winter forecasts. El Niño winters typically bring wetter conditions to the southern tier of the country and milder, drier weather to the northern states. La Niña tends to flip that script, often bringing drier conditions to the South and colder, stormier patterns to the Pacific Northwest and northern Plains.
These effects aren’t guaranteed every single year, since other climate factors can interfere. Without those strong patterns influencing the atmosphere, it’s harder to anticipate seasonal shifts in rain, storms, or temperatures. That’s part of why neutral years, like the stretch the Pacific moved through in early 2026 before El Niño began strengthening, tend to produce less predictable seasonal outcomes.
5. Hurricane season activity leans in opposite directions
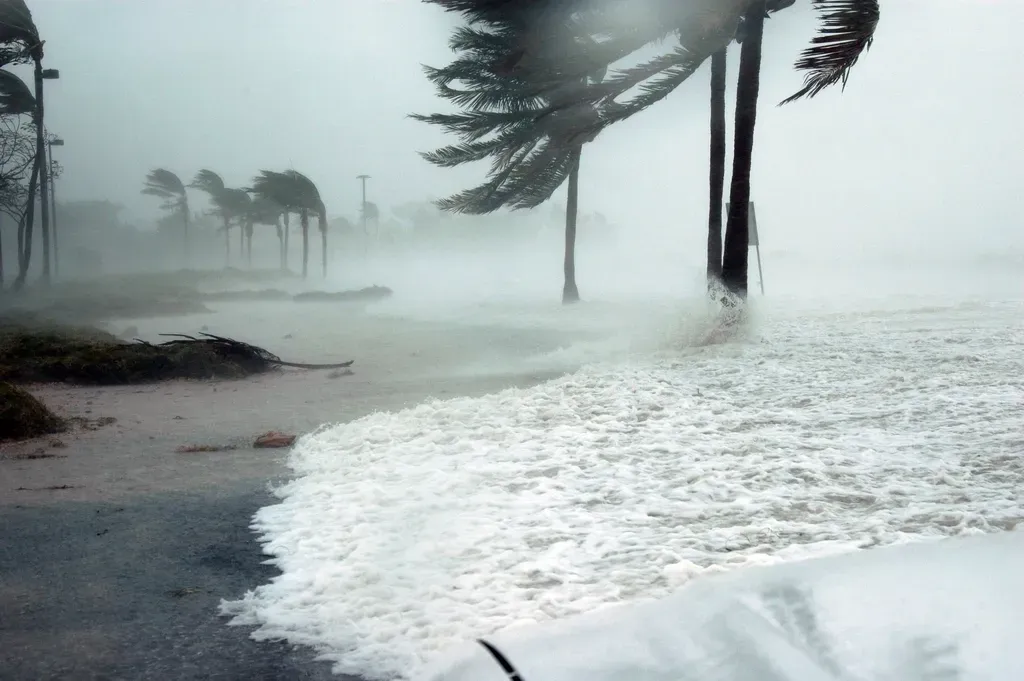
Atlantic hurricane activity is another area where the two patterns diverge sharply. La Niña years typically reduce wind shear over the Atlantic, which tends to support more active hurricane seasons. El Niño years usually do the opposite, increasing wind shear that can suppress storm development in the same basin.
The Pacific side of the ledger often behaves in reverse, with El Niño years sometimes supporting more tropical activity in the eastern and central Pacific basins. Forecasters weigh these tendencies heavily when putting together seasonal hurricane outlooks each year, adjusting expectations based on which phase of ENSO is active or developing.
6. Forecast confidence and predictability differ noticeably
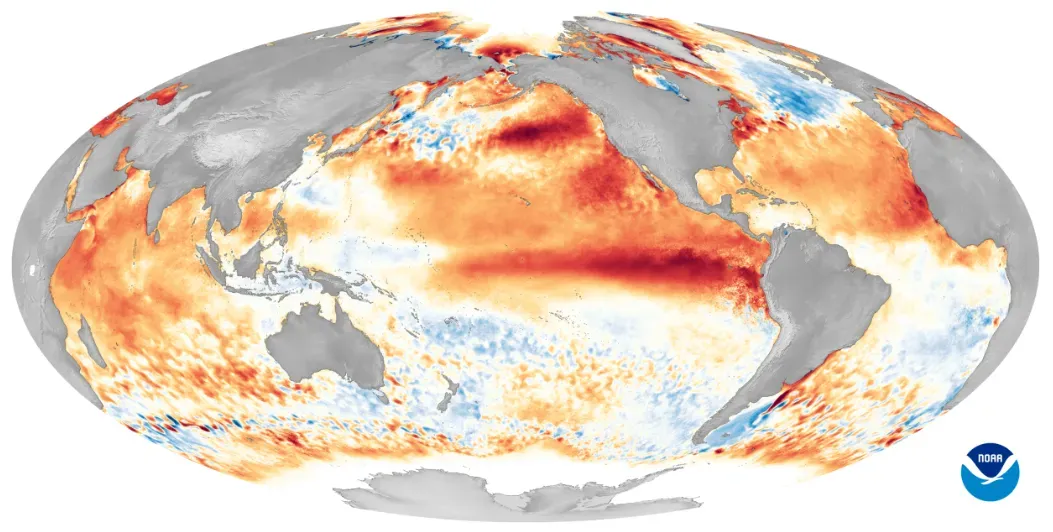
El Niño and La Niña aren’t just different in their effects; they’re also different in how confidently scientists can predict them. Strong, well-developed events tend to be easier to forecast months in advance, while weaker or transitional phases carry more uncertainty. Models can indicate that an event may be strong, but the so-called spring predictability barrier remains a challenge for forecast certainty at that time of year, with confidence generally improving after April.
The 2025 into 2026 stretch illustrated this uncertainty well. The IRI ENSO plume forecast indicated a moderate probability of La Niña conditions developing, expected to persist through the boreal winter, before ENSO-neutral conditions were forecasted to return with probabilities ranging from 55% to 74%. That kind of back-and-forth in the data is normal for ENSO forecasting, especially during transition periods between phases.
Where things stand heading into late 2026