
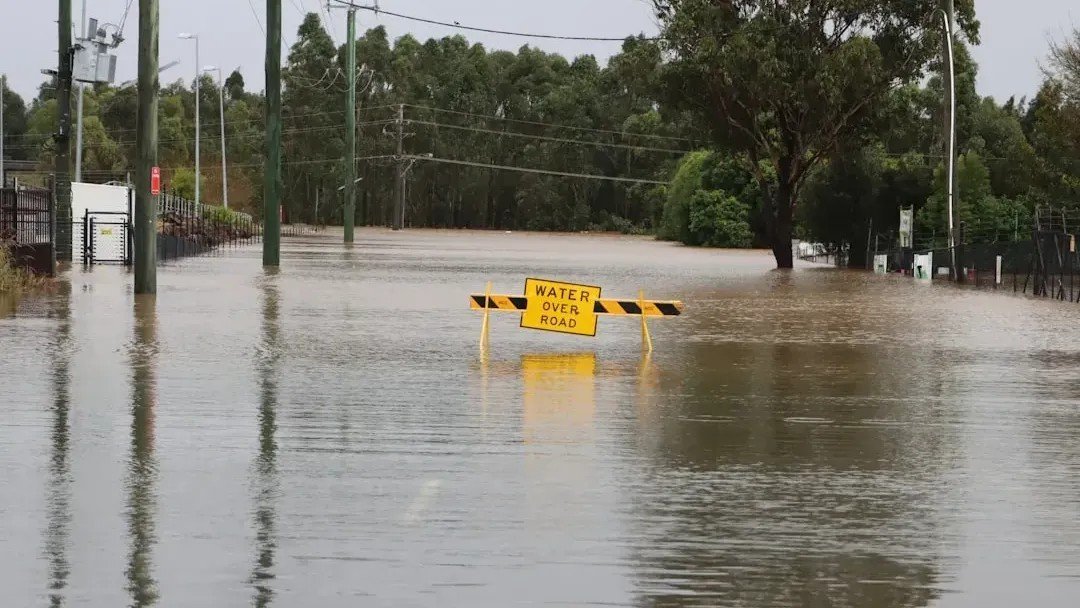
Most Americans who buy a home near a river, a coast, or even in a quiet inland town check one thing to assess their flood risk: the official FEMA flood zone map. It’s the document that determines whether your mortgage lender requires flood insurance, and it shapes how communities build everything from subdivisions to storm drains. The problem is that for a significant portion of the country, that map is wrong – not marginally wrong, but wrong by decades.
What’s emerged from independent research groups, university studies, and hard-won disaster data is a picture of flood exposure in America that looks almost nothing like what the official maps describe. The gap matters enormously to real families, local governments, and the financial system that underwrites American homeownership. Here’s a detailed look at what the new data actually shows.
How Old Are the Maps, Exactly?
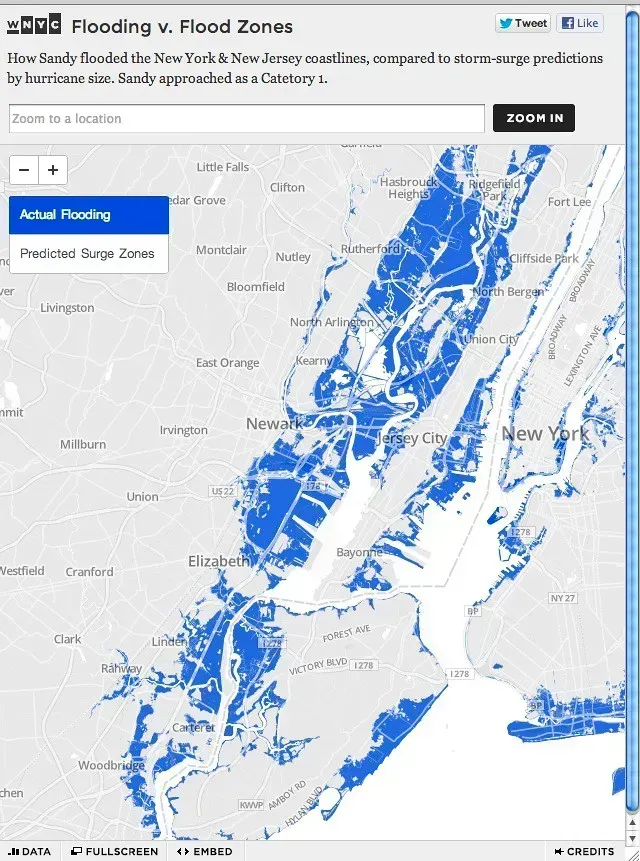
The U.S. Federal Emergency Management Agency’s flood maps are intended to be the nation’s primary tool for identifying flood risks. Originally developed in the 1970s to support the National Flood Insurance Program, these maps – known as Flood Insurance Rate Maps, or FIRMs – are used to determine where flood insurance is required for federally backed mortgages, to inform local building codes and land-use decisions, and to guide floodplain management strategies.
The people of Key West, Florida, are living with flood maps based on studies that are more than 30 years old. So, too, are some of the people in the rural counties of Latimer and Pushmataha, Oklahoma, East Carroll Parish, Louisiana, and Chautauqua, New York. In Buncombe, Yancey, Avery, and Burke counties in western North Carolina – where flooding in the aftermath of Hurricane Helene devastated communities – the most recent maps date back to anywhere from 2007 to 2010. That’s a striking mismatch between official risk designations and the world as it actually exists today.
FEMA Is Required to Review Maps – But Not to Update Them
While FEMA is required to review flood maps every five years, updates are not mandated on that same schedule. That distinction matters more than it might seem. A review can conclude that no update is needed, leaving communities with maps that reflect conditions from a very different era of land development and rainfall patterns.
Many of the maps that dictate the country’s flood zones – and decide who has to buy flood insurance – are significantly outdated. Efforts to change them, however, keep hitting a roadblock: the people who live there. FEMA’s mapping process is often shaped by political pressures. Local governments and developers sometimes fight to avoid high-risk designations to avoid insurance mandates or restrictions on development, leading to maps that may understate actual risks.
The Coverage Gap: 40 Percent of the Country Is Simply Not Mapped
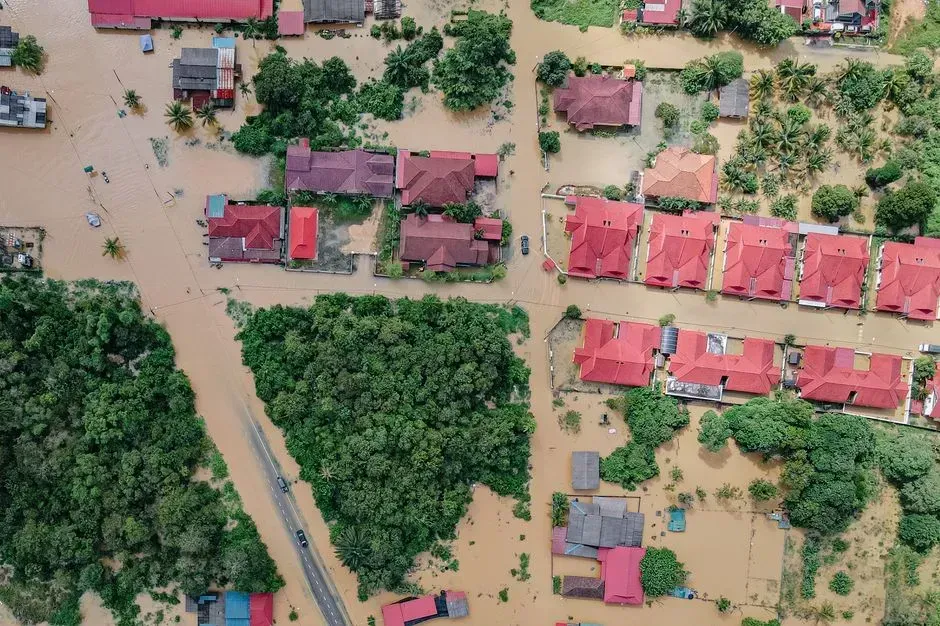
A study led by researchers at Fathom found that 41 million Americans are at risk from flooding rivers, which is more than three times the current estimate – based on regulatory flood maps – of 13 million people. The study is based on a new high-resolution model that maps flood risk across the entire continental United States, whereas the existing regulatory flood maps produced by FEMA cover only about 60 percent of the continental U.S.
The increase in numbers of those at risk is a result of the expanded coverage of the map combined with its ability to estimate flooding on small streams – something that wasn’t adequately captured in previous flood-risk models. Smaller creeks and streams are precisely the kind of waterways that overflow rapidly during intense rain events, often in areas where residents feel perfectly safe because they’re nowhere near a designated flood zone.
The 100-Year Floodplain Is Far Larger Than FEMA Thinks
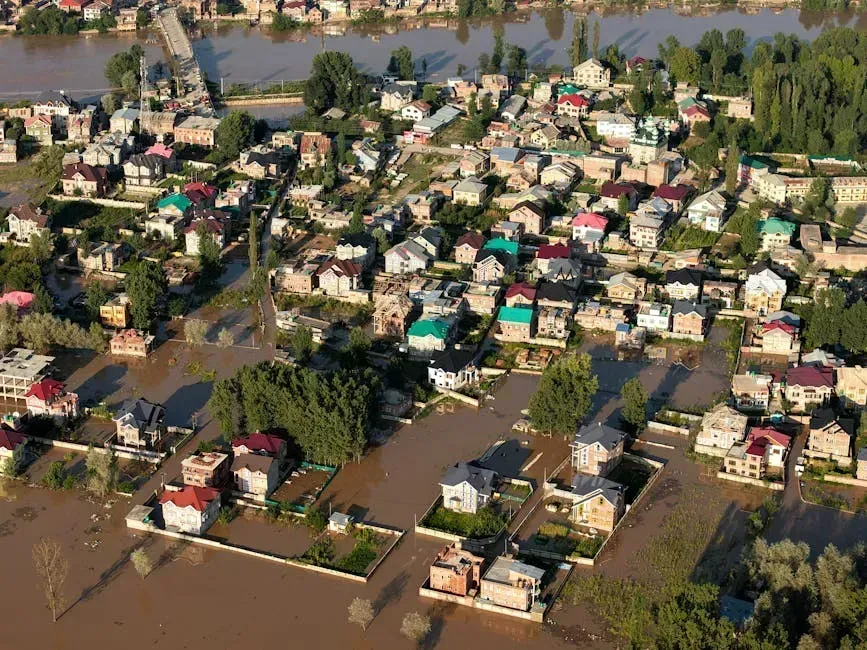
In a 2023 assessment using newly modeled flood zones with climate-adjusted precipitation records, researchers found that more than twice as many properties across the country were at risk of a 100-year flood than the FEMA maps identified. That’s not a minor statistical discrepancy – it means millions of homeowners are making purchasing and insurance decisions based on risk assessments that the latest science has already rendered obsolete.
When researchers at North Carolina State University ran computer models to determine flood damage risk, they found a high probability of flood damage for more than 1.01 million square miles across the United States, while the mapped area in FEMA’s 100-year floodplain is about 221,000 square miles. They noted that their machine-learning-based model assessed damage from floods of any frequency, while FEMA only includes flooding that would occur from storms with a 1% chance of happening in any given year.
Six Million Properties Don’t Know They’re at Risk
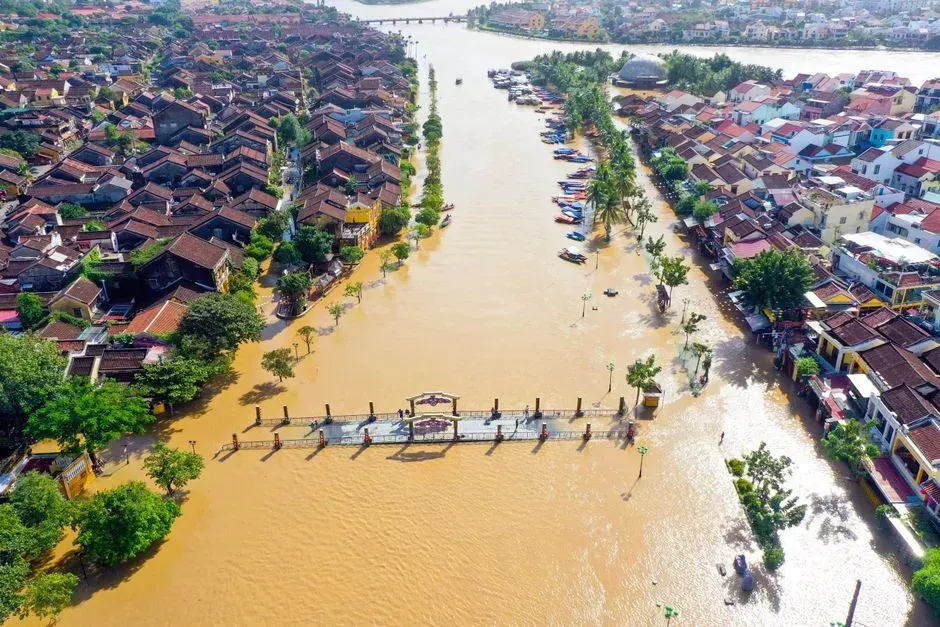
A peer-reviewed model created by the First Street Foundation found 14.6 million properties in the U.S. face significant flood risk, while federal flood maps only identified 8.7 million properties in the 100-year floodplain. The First Street model shows that nearly 70 percent more properties have substantial flood risk than current federal flood maps identify. As a result, nearly 6 million property owners don’t know their properties are at risk of flooding.
First Street’s Flood Model uniquely considers the risk of flooding from rainfall and climate change, finding 6 million properties face substantial risk unaccounted for by FEMA. The inclusion of environmental changes that impact flood risks – such as sea level rise and heavy precipitation patterns – is an essential trademark of the First Street model. FEMA’s maps, by contrast, largely reflect historical conditions without accounting for how the climate has already shifted precipitation behavior.
The Equity Problem Hidden Inside the Data
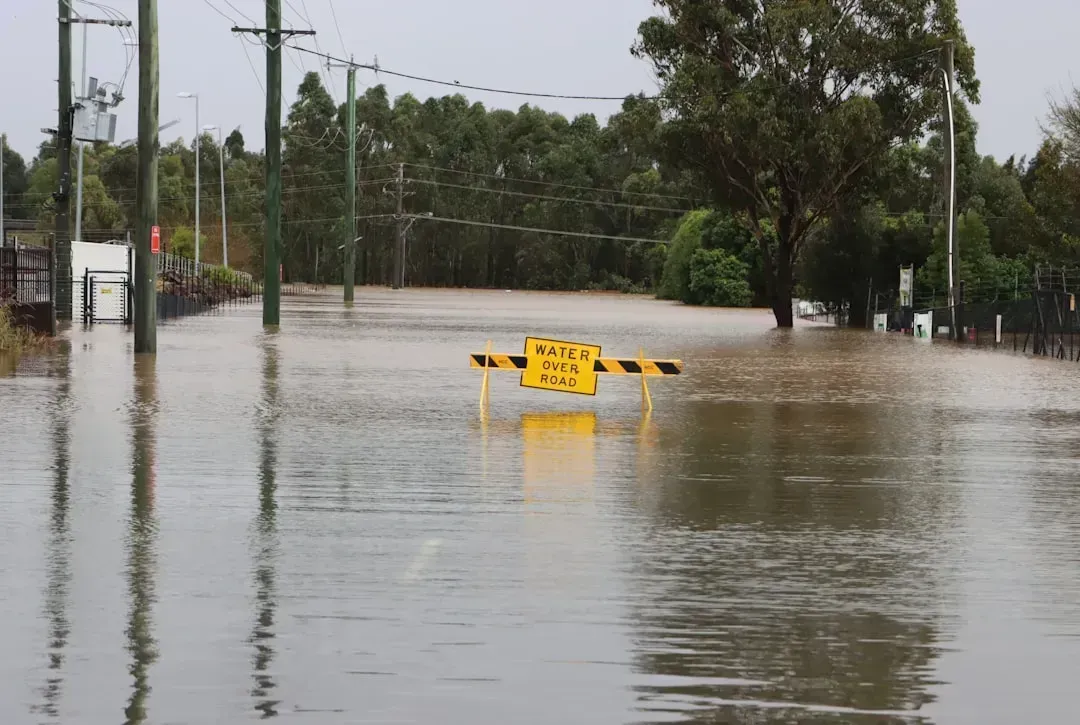
Results from a 2025 study published in Scientific Reports indicate that 26 million U.S. residents live in federally-overlooked 100-year floodplains. Lower income is associated with elevated risk of federally-overlooked 100-year flooding for all flood types across the urban-rural continuum.
Research suggests that FEMA underestimates flood risk in socially vulnerable areas and overestimates it in socially advantaged areas. NFIP numbers focus on the highest-risk coastal communities while overlooking a significant portion of inland properties that face damage from rising rivers and streams. The communities least financially prepared to absorb flood damage are, in many cases, the ones whose risk is most systematically undercounted by the maps.
Hurricane Helene Made the Gap Impossible to Ignore
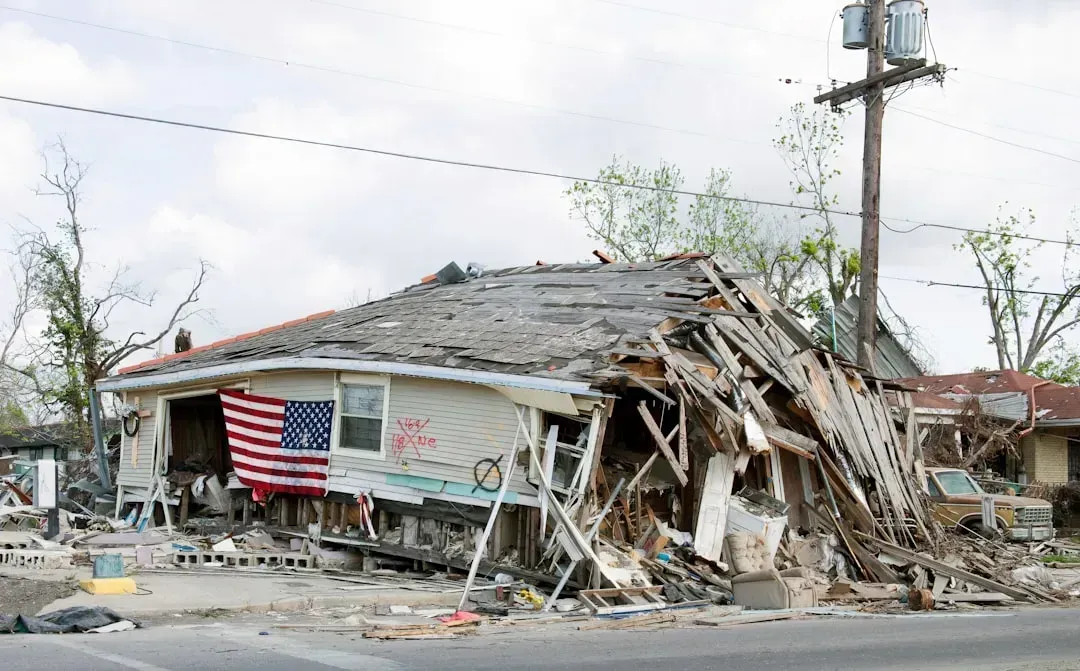
When flooding from Hurricane Helene hit unmapped areas around Asheville, North Carolina, in 2024, it caused a huge amount of uninsured damage to properties. Projections by the First Street Foundation show that cities like Asheville – which was overwhelmed by Helene – have a far greater flood risk than FEMA maps suggest. While only 2 percent of Asheville properties are within the Special Flood Hazard Area, First Street projects that 15.8 percent are at flood risk.
When Hurricane Helene hit in September 2024, Asheville received rainfall that exceeded what a 1-in-1,000-year event would be expected to produce. Analysis found that Buncombe County had a flood insurance protection gap of 88 percent – meaning 88 cents of every dollar in flood losses were uninsured, regardless of the event’s severity. In Buncombe County, N.C., where an entire town disappeared beneath floodwaters, less than 1 percent of households had flood insurance.
The Inland Insurance Blind Spot
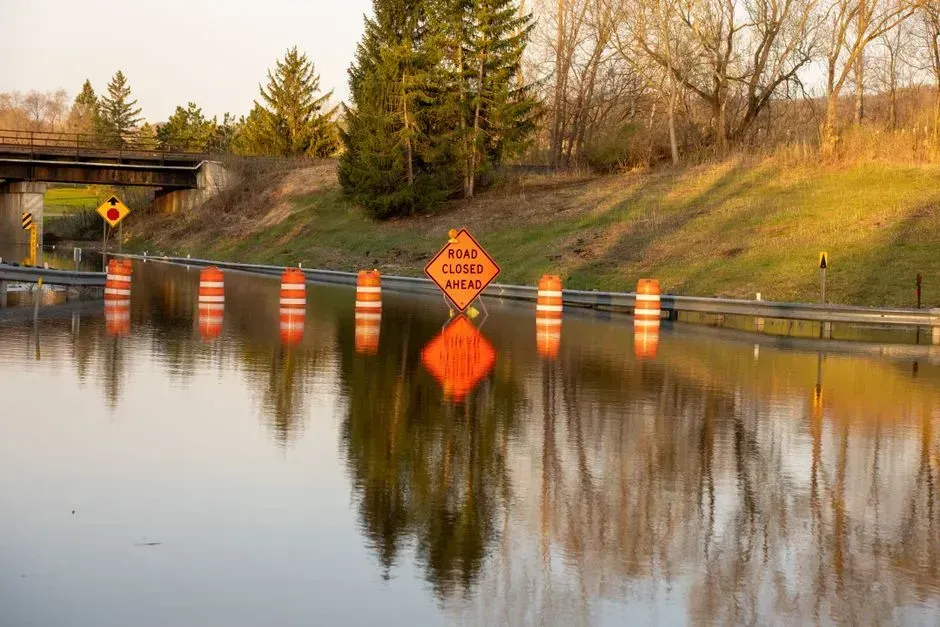
Most FEMA maps don’t consider pluvial flooding – flooding from rain. That’s likely one reason why flood-insurance uptake away from the coasts is negligible. In many inland counties in the Southeast and Appalachia, coverage under the federal program stands at 2.5 percent or lower.
Research conducted by First Street Foundation suggests there may be at least 440,000 more homes at risk than what NFIP numbers show. In a 1-in-100-year flood event, analysis found that nationwide uninsured losses would reach $375 billion. The protection gap is 65 percent – meaning for every dollar in flood losses a major event would cause, 65 cents would land on homeowners, local governments, and the federal disaster fund rather than on an insurance company.
What Better Data Actually Looks Like
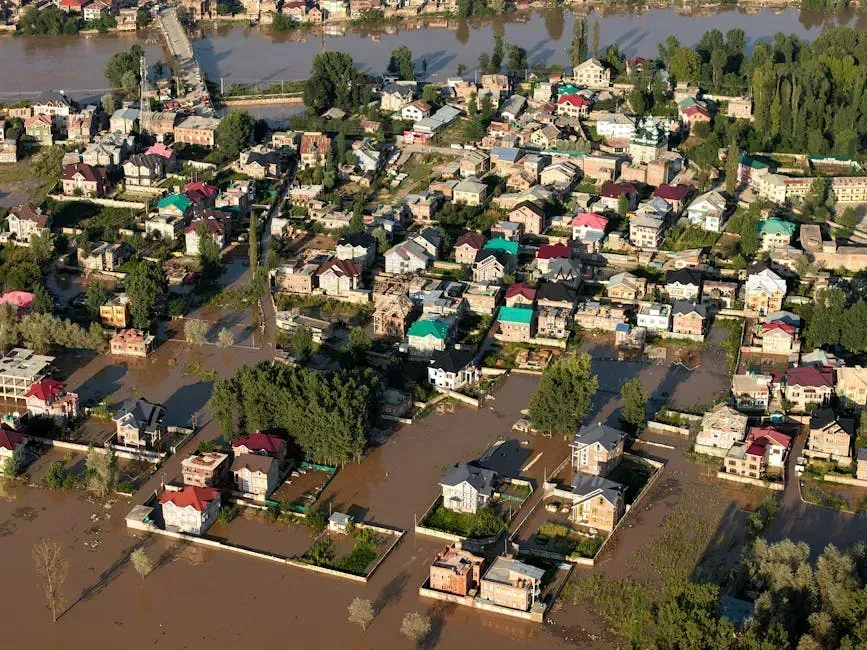
The First Street Foundation Flood Model is a nationwide model that determines the potential flood risk from rain, streamflow, sea level rise, tide, and storm surge for any location. It is a complex system built on decades of peer-reviewed research and can forecast how flood risks will change over time due to environmental changes.
Public access to accurate fine-resolution hazard data, combined with greater public trust in its accuracy, could help to increase participation in the National Flood Insurance Program, could aid private insurance companies in the identification of insurable properties, and could help property owners design vulnerability reduction measures such as flood proofing. The challenge is that better models exist but don’t yet drive the regulatory decisions that affect real families at the point of buying or insuring a home.
The Real Estate Market Is Starting to Absorb the Risk

A First Street Foundation study estimates that real estate values could lose $1.4 trillion over the next 30 years due to climate-related risks. Climate change is now causing many to recalibrate the value proposition of homeownership, as insurance costs now represent a higher proportion of mortgage costs than ever before.
Homeowners in South Dakota, Nebraska, and New Mexico, for example, could see their flood risk increase five-fold in the next 70 years. First Street Foundation’s report also shows that properties with substantial risk across the U.S. will increase to 16.2 million by 2050. Markets that have historically been treated as flood-safe are being quietly repriced as better data reaches lenders, appraisers, and insurers – even when the official FEMA maps haven’t changed at all.
What Needs to Change
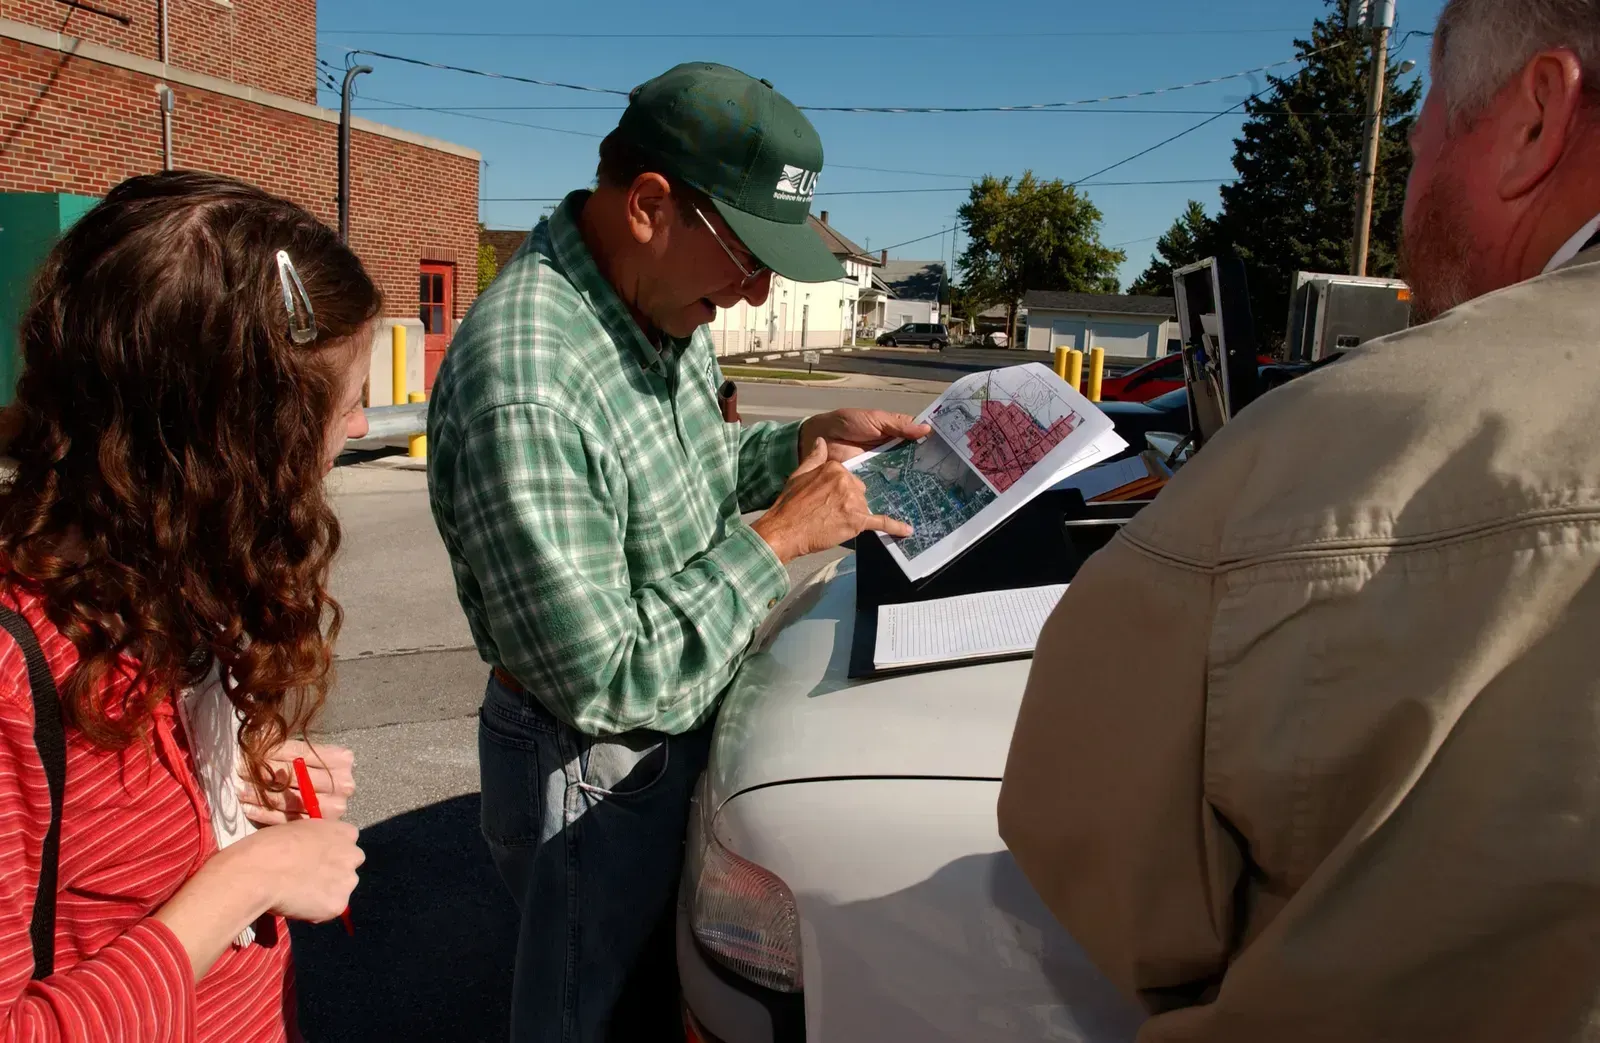
While FEMA has improved the accuracy and accessibility of the maps over time with better data, digital tools, and community input, the maps still don’t capture everything – including the changing climate. The federal government has an important role to play in ensuring that accurate risk assessments are available to communities and Americans everywhere. As better tools and models evolve for assessing risk, FEMA’s risk maps need to evolve, too.
According to FEMA administrators, FEMA’s flood maps don’t currently reflect the environmental changes affecting the country. FEMA flood zone maps weren’t built to reflect real-time flood risk. They’re often based on outdated data, making them static and slow to update. The technology to do far better already exists. The harder question is whether the political and financial will to use it can catch up before the next Helene arrives somewhere else that the maps said was safe.

- The Shoreline Sucked Dry in Seconds – 5 Tsunami Signals Beachgoers Mistake for Low Tide - November 14, 2026
- 9 Dark-Sky Destinations Around the World Where the Stars Look Unreal - November 14, 2026
- The Fault Line That Never Slips – 7 Locked Seismic Zones Overdue for a Massive Release - November 14, 2026
