
- Phantom Energy Sucking Power 24/7 – 7 Home Electronics Quietly Inflating Utility Bills - November 14, 2026
- A Million-Mile Storm Raging for Centuries – 6 Violent Weather Wonders in Our System - November 14, 2026
- Animals Flee Hours Before the Tremor – 7 Natural Warnings Before Disasters Strike - November 14, 2026
Cascadia’s slow-motion countdown in the Pacific Northwest
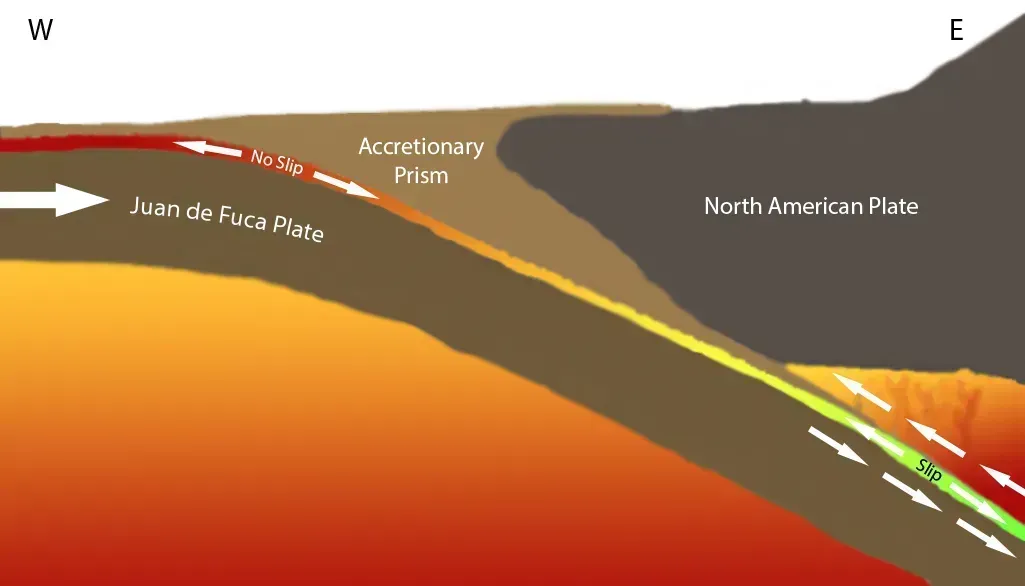
The Cascadia Subduction Zone stretches roughly 620 miles off the coast from northern California to Vancouver Island, where the Juan de Fuca plate is slowly forced beneath North America. It is capable of producing 9.0+ magnitude earthquakes and tsunamis that could reach 100 feet (30 m) high. The last full-margin rupture happened on January 26, 1700, and paleoseismic data shows at least 19 great magnitude 8 or greater Cascadia earthquakes over the past 10,000 years, with an average recurrence interval of approximately 500 years, though the variation is substantial, with recorded intervals ranging from 200 to 1,000-plus years between events.
Current federal estimates put the odds at an 85-percent chance of a magnitude 6.5 or greater deep earthquake in the Puget Sound region, a 10-15-percent chance of an approximately magnitude 9 earthquake on the Cascadia Subduction Zone, and a 17-percent chance of a magnitude 6.5 or greater crustal fault earthquake in the Puget Sound region in the next 50 years. Newer imaging off Vancouver Island found a tear in the subducting plate, but researchers concluded subduction and associated seismic hazards persist, with strain still accumulating in locked segments, and the increased complexity may affect earthquake behavior and predictability but does not reduce overall risk. If the southern portion alone gives way, FEMA-linked county planning documents note the resulting earthquake will have a magnitude between 8.0 and 8.6, which scientists predict there’s a 37%-43% chance of happening within the next 50 years.
Southern California and the overdue San Andreas rupture
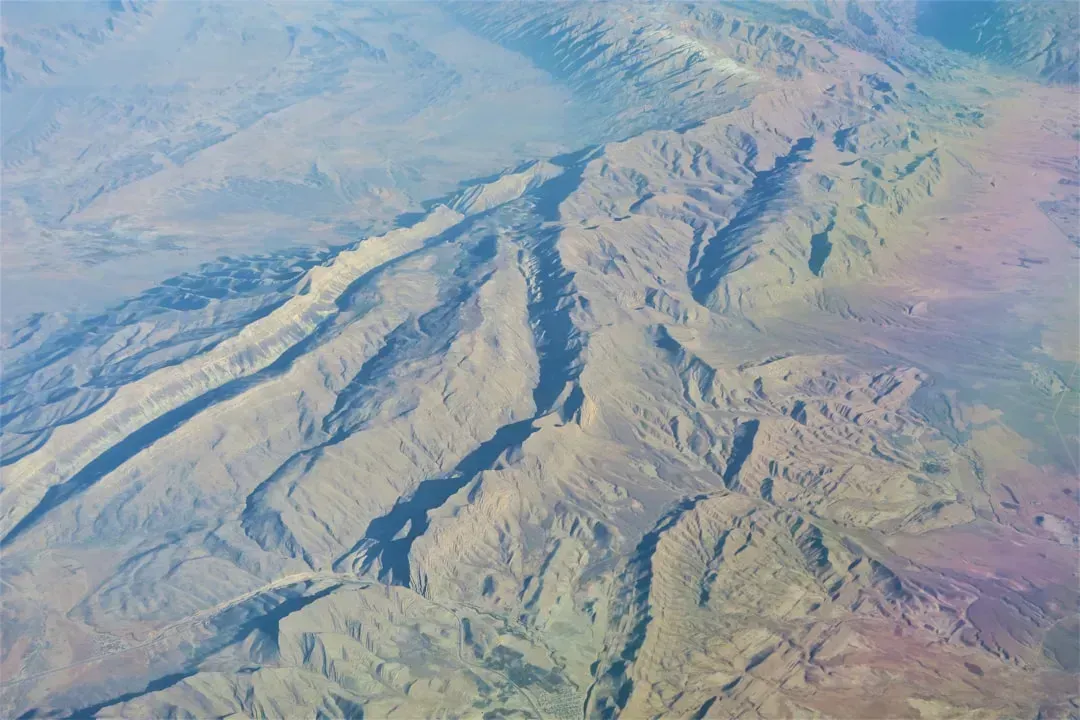
Southern California carries a different kind of weight. It isn’t one fault so much as a dense web of them, and sitting astride the Pacific-North American plate boundary at the Big Bend of the San Andreas Fault, the region has over 300 faults capable of producing magnitude 6 and larger earthquakes, affecting more than 20 million inhabitants. The southern segment hasn’t ruptured since 1857, and geologic evidence from sites like Wrightwood shows large earthquakes have occurred at about 150-year intervals on the southern San Andreas fault, and as the last one struck in 1857, that section is considered a likely location for an earthquake within the next few decades.
Federal scientists have quantified this concentration directly. USGS researcher Elizabeth Cochran told Newsweek that “overall, Southern California has a 36% chance of a M7.5 or greater earthquake in the next 30 years.” UCLA engineering professor Jonathan Stewart added that the Big One in California lacks a specific scientific definition but is generally considered a magnitude 8 event on the San Andreas Fault, with stress building since the last major events in 1906 in the north, 1857 in the central segment, and 1690 in the far south, meaning the southern segment is most likely to produce the next large event. New modeling beneath the Salton Sea reinforces the picture, since the Southern San Andreas Fault is one of the most closely watched seismic hotspots in the world, yet it hasn’t produced a major earthquake in more than 300 years.
Japan’s Nankai Trough and rising probability estimates
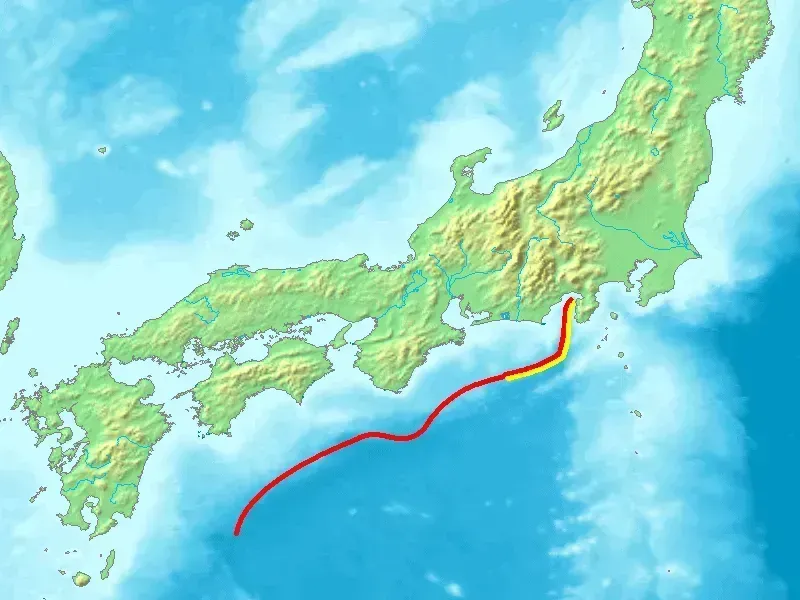
Off Japan’s Pacific coast, the Nankai Trough has generated magnitude 8 to 9 earthquakes roughly every century for well over a thousand years. Historical records indicate that since the Hakuho earthquake in 684, great earthquakes of magnitude 8 or above have occurred at the Nankai Trough approximately every 100 to 200 years over the past 1,400 years. The last major event was the 1946 Showa-Nankai quake, and by 2025 the government’s long-running probability estimate had climbed to roughly 80 percent over 30 years before an even more striking revision arrived.
In September 2025, Japan’s Earthquake Research Committee widened its 30-year probability estimate considerably, reporting that it now thinks a huge earthquake will occur along the Nankai Trough with a probability of 60% to 94.5% or higher within the next 30 years. Officials were careful to stress this recalibration reflected methodology, not new danger, noting the change does not imply that seismic risk has increased. The human stakes remain enormous regardless, since a March 2025 government damage projection found up to 298,000 people could die, with economic damages reaching 292 trillion yen.
Istanbul’s locked seismic gap beneath the Sea of Marmara
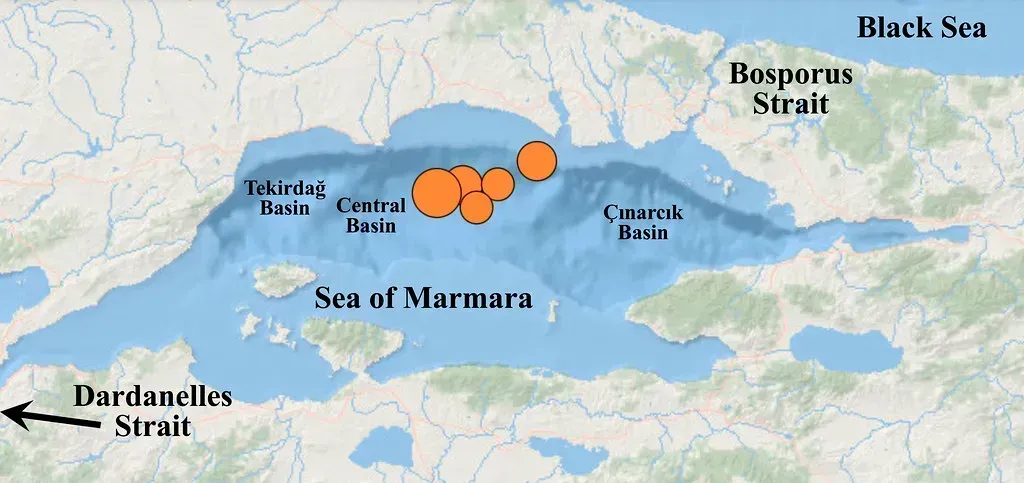
Few cities illustrate concentrated risk as clearly as Istanbul. Where the North Anatolian fault zone cuts into the Sea of Marmara, just south of Istanbul, lies the only western segment left unruptured over the past century. A magnitude 6.2 earthquake struck the area in April 2025, and researchers led by Patricia Martínez-Garzón found that the epicenters and ruptures of moment magnitude greater than 5 earthquakes, including the 2025 event, have generally migrated from west to east, as have their aftershock sequences, breaching formerly quiet fault segments in what looks like a steady march toward a city of 18 million people.
German researchers at GFZ Helmholtz confirmed the pattern in December 2025, noting that the main earthquake threat for Istanbul remains under the Sea of Marmara because a key part of the Main Marmara Fault is locked and storing strain. Probability estimates vary depending on the model used, ranging from a 35 percent chance of a magnitude 7.3 or larger earthquake near Istanbul in a 30-year period, rising to 47 percent in models that include time dependence and stress transfer from the 1999 İzmit earthquake. A separate 2026 study using thermal and sediment data concluded the fault likely won’t snap all at once, since it is unlikely to rupture in a single, catastrophic event, and will instead likely break in segments, with maximum earthquake magnitudes reaching about 7.3.
The Himalayan front and its buried strain
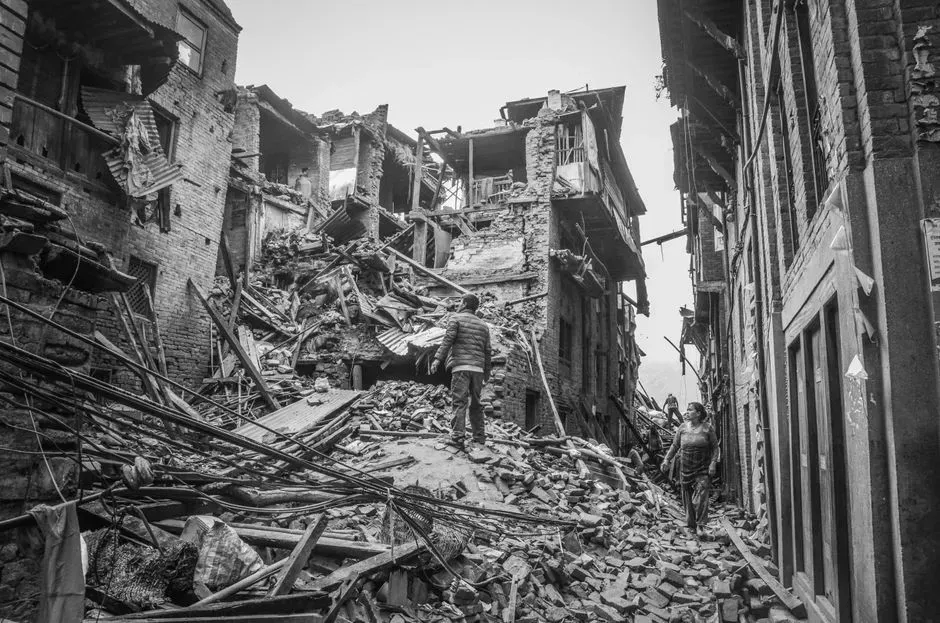
Along the roughly 1,550-mile Himalayan arc, the concentration of risk centers on what scientists call the Central Himalayan seismic gap. Researchers using GPS satellite data have identified specific danger zones, since scientists from Caltech, using GPS satellite measurements, have identified four such high-locking, high-risk segments along the 2,000-km Himalayan arc, located in parts of India, Nepal, and Bhutan, that are the most likely sources of the next great Himalayan earthquake. A 2021 modeling study in Nature Communications added an unsettling twist, finding that moderate quakes may not be relieving pressure at all, since rather than releasing seismic tensions in the crust, the 2015 quake likely loaded the surrounding region for an even more destructive mega-earthquake, which could clock in at magnitudes of 8.5 or higher.
India responded to this accumulating evidence with a sweeping policy shift. In late 2025, regulators released an updated new seismic zonation map, placing the entire Himalayan region under Zone VI, the highest risk zone, for the first time. That single change meant around 75% of the Indian population now lives in seismically active zones, and 61% of India’s landmass is now under seismic risk. Not every scientist agrees the region is simply “overdue,” however, a nuance worth sitting with before assuming the countdown is straightforward.
When two faults move together: the Cascadia-San Andreas link
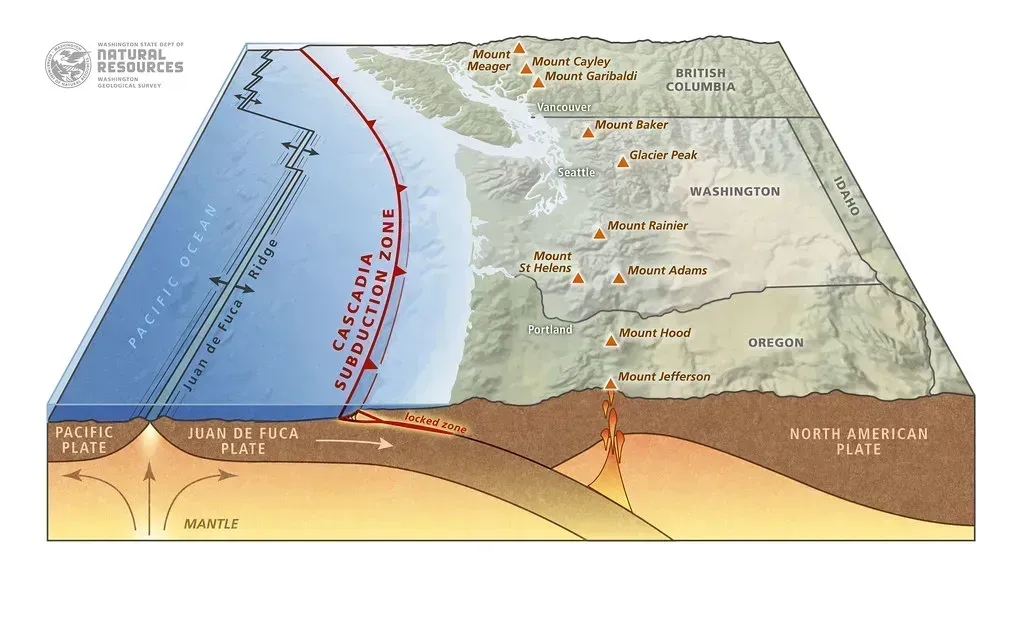
One of the more unsettling findings of the past year came from Oregon State University geologist Chris Goldfinger’s long-running sediment core research. New analysis published in Geosphere in 2025 suggests the Cascadia subduction zone and the San Andreas fault can “sync up,” triggering earthquakes within minutes or hours of each other, and this rare synchronization could dramatically increase the scale of a major West Coast disaster. The discovery traces back to an accidental 1999 research cruise, when Goldfinger’s team drifted off course near the Mendocino triple junction and pulled a sediment core that didn’t match the usual pattern.
That anomalous core turned out to be evidence of a two-part rupture sequence, since the pattern was reversed, with coarse, sandy material sitting above finer, silty sediment, an unusual structure suggesting a two-step process, where the lower, finer layer likely formed first during a major Cascadia earthquake. The practical implication is straightforward but sobering. Instead of a single massive quake confined to one region, multiple regions could be hit at nearly the same time, meaning the next Big One could be a multi-city disaster unfolding all at once.
Reading the fault: locked, creeping, and transitional zones
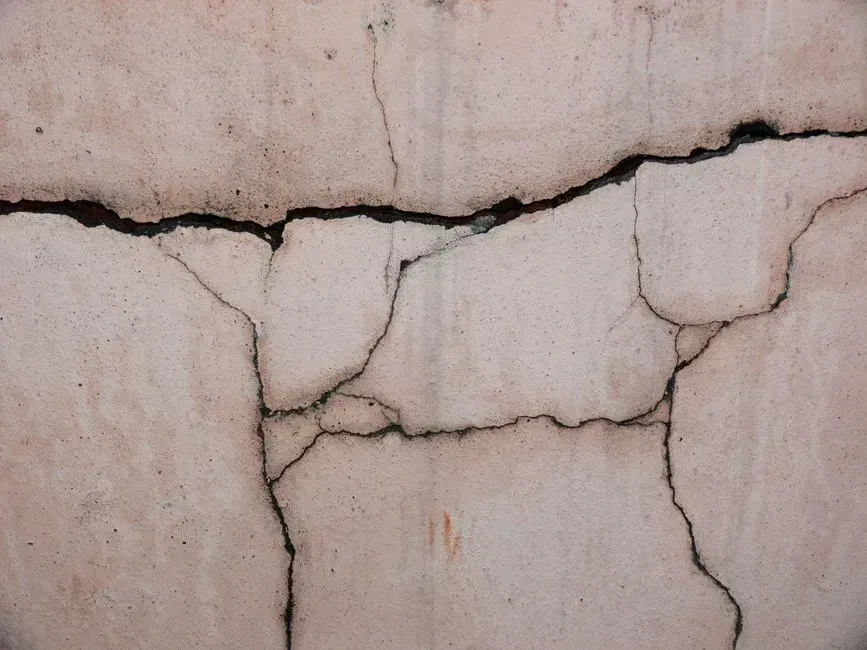
Much of the recent progress in pinpointing risk comes down to distinguishing how different fault sections actually behave, not just where they sit on a map. Seismologists divide segments into categories, and off Istanbul, GFZ researchers described the pattern plainly, noting blue for creeping areas, orange for transition areas, and red for locked areas with the risk of stronger earthquakes. A locked segment is the one to watch, since it accumulates strain silently for decades or centuries rather than releasing it in small, frequent tremors.
This kind of segmentation explains why the Marmara Sea gap draws so much attention specifically, rather than the North Anatolian Fault as a whole. GFZ’s mapping found large parts of the Marmara Sea south of the megacity Istanbul form a so-called seismic gap along a fault segment more than 100 kilometres long, meaning there have been no severe earthquakes in this gap for a long time and that tension is therefore building up there. The same locked-versus-creeping framework is now standard practice for assessing Cascadia, the Himalayan front, and California’s southern San Andreas alike, giving researchers a consistent language for comparing wildly different tectonic settings.
Why “overdue” doesn’t mean “due”: rethinking earthquake timing
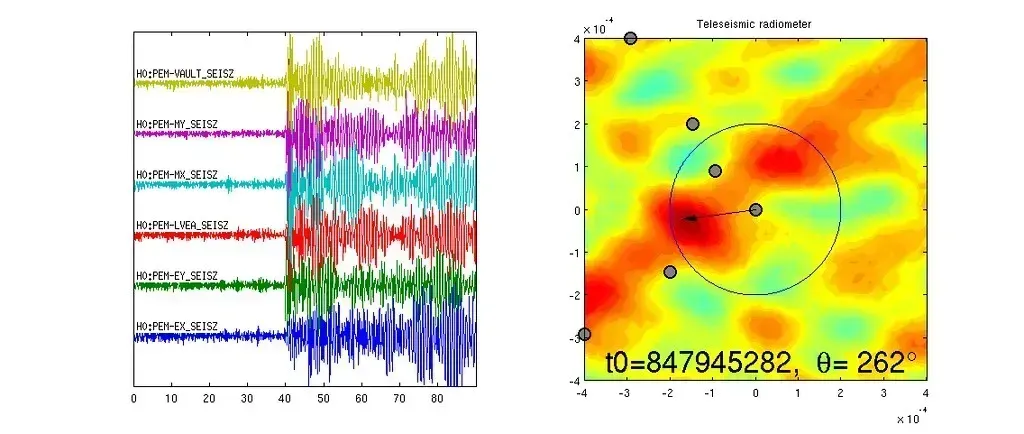
Not every long quiet period signals an imminent rupture, and a striking 2026 study out of western Nepal makes that case with unusual clarity. Sediment cores from Rara Lake spanning more than six thousand years revealed that over the past 6,527 years, there were 50 earthquakes of magnitude greater than 6.5 in the region, and these earthquakes did not occur at long, regular intervals, instead happening in clusters over short periods. That directly challenges the popular idea that a fixed number of quiet centuries automatically means a rupture is coming due.
Researchers found the timing pattern matched something closer to statistical randomness than a predictable cycle, concluding across six millennia of sediment record, recurrence matches what statisticians call a Poisson random distribution, with events occurring independently of how much time has passed since the last one. They tested this against other subduction zones too, and found comparing it with long-term paleoseismic datasets from New Zealand, Indonesia, Chile, and the Cascadia subduction zone showed the same statistical randomness, with only short-term clustering of smaller events. None of this makes any region safer. It simply means elapsed time alone is a poor substitute for the more detailed strain and locking data scientists are now gathering.
Turning risk maps into safer buildings and cities

Identifying where risk concentrates only matters if it changes how communities build and prepare. Oregon and Washington counties are already treating the Cascadia threat as an infrastructure planning problem, since a Multnomah County emergency director described it in stark terms, noting this isn’t an “if,” it’s an absolute “when,” and fifty years may seem like a long time, but from a geological sense, it’s nothing. Even the recovery timeline is now baked into planning documents, with officials expecting people living in coastal counties along the Cascadia subduction zone will have to be self-sufficient for at least two weeks, the time it’ll take for external aid to come in.
Istanbul offers a parallel case study in translating hazard maps into hard policy. Automated safety systems there already responded to the 2025 quake, since both the Istanbul Earthquake Rapid Response and Early Warning System and the Istanbul Natural Gas Network automated earthquake shutoff system activated and functioned as designed. Japan, meanwhile, is running well behind its own preparedness targets, since the original goal to largely eliminate houses with insufficient earthquake resistance by 2025 is behind schedule, with the achievement date postponed to 2030. India’s blanket Zone VI reclassification of the Himalayan belt fits this same pattern, forcing all new buildings in the Himalayan belt to follow far stricter earthquake-resistant design codes, with hospitals, schools, and bridges built to remain functional even after a major earthquake.
The bigger picture on where risk really sits