

- Phantom Energy Sucking Power 24/7 – 7 Home Electronics Quietly Inflating Utility Bills - November 14, 2026
- A Million-Mile Storm Raging for Centuries – 6 Violent Weather Wonders in Our System - November 14, 2026
- Animals Flee Hours Before the Tremor – 7 Natural Warnings Before Disasters Strike - November 14, 2026
Most people have heard the number by now. It shows up in news headlines, climate summit communiqués and political speeches, usually without much explanation of where it came from or what it measures.
The figure is simple to say and surprisingly easy to misread. A single hot year doesn’t break it, and a cool year doesn’t save it. What the number actually describes, and how near we are to it, is worth setting out carefully.
Where the 1.5°C Number Came From
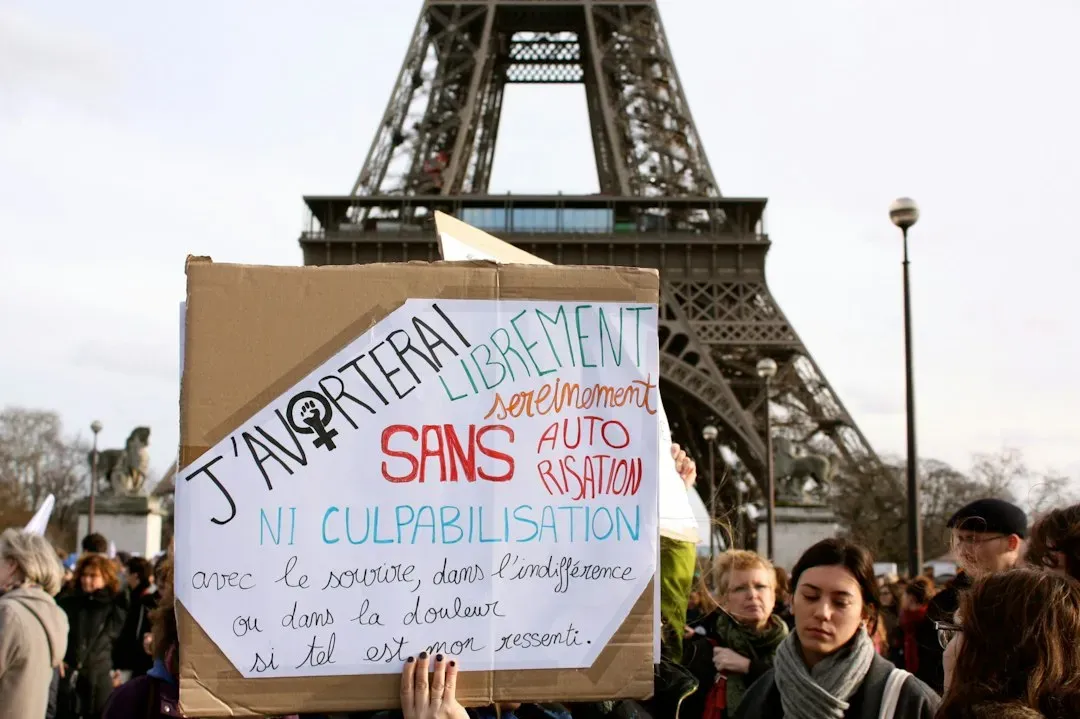
The target comes from the Paris Agreement of 2015. Countries committed to holding global warming well below 2°C above preindustrial levels and to pursue efforts to limit it to 1.5°C, as the UN Framework Convention on Climate Change describes it.
The lower figure was a late addition, pushed hard by small island states and other vulnerable countries. They argued that 2°C would still be dangerous for them. The agreement then asked scientists to assess what a 1.5°C world would actually look like.
What Counts as the Baseline
Preindustrial doesn’t mean a single exact year. Scientists usually use the average of 1850 to 1900, the earliest period with reasonably reliable global instrument records. Warming is then measured as how far current temperatures sit above that average.
Different datasets handle this slightly differently. Copernicus, which relies on a blend of observations and modeling, often reports figures a little higher than the World Meteorological Organization’s consolidated analysis. That explains why two reputable sources can give slightly different numbers for the same year.
A Long Term Limit, Not a Single Year

This is the part that gets lost most often. The WMO says the Paris levels refer to long term warming sustained over an extended period, typically assessed over twenty years. Individual years above 1.5°C don’t mean the goal is out of reach.
Axios made the same point in early 2024, when a twelve month stretch first ran above the line. The Paris target refers to an average over twenty to thirty years, so the agreement had not formally been breached then. Still, those temporary excursions are a warning sign about the longer trend.
What 2024 and 2025 Showed
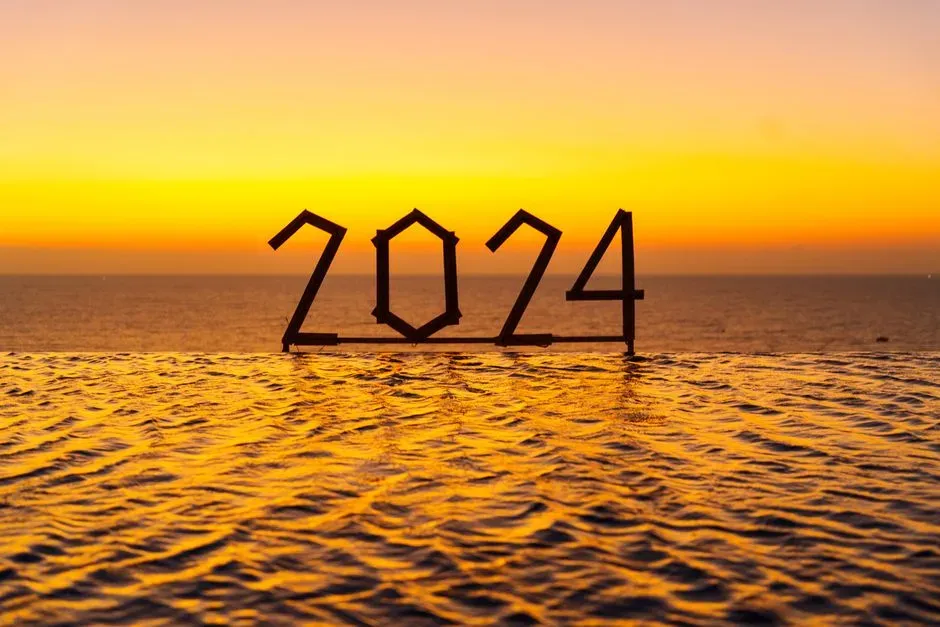
The year 2024 was the hottest on record. Copernicus put it at about 1.6°C above preindustrial levels, while the WMO assessed it at roughly 1.55°C. Either way, it was the first calendar year clearly over the threshold.
For 2025, Copernicus reported 1.47°C, and the WMO’s analysis came in at 1.44°C with an uncertainty margin of 0.13°C. The WMO’s consolidated average for 2023 to 2025 was 1.48°C. Copernicus said the three year average exceeded 1.5°C, so the datasets differ slightly, but they point the same way.
How the Countdown Has Shortened
Copernicus runs a trend monitor that extrapolates the long term average forward. When the Paris Agreement was approved in December 2015, it projected the 1.5°C mark would be reached around March 2045. Updated for the tenth anniversary in late 2025, the same tool estimated May 2029.
That is roughly twenty three years closer in a decade. It’s a simple linear extrapolation, so it’s not a forecast of exact timing. Even so, it shows how quickly the picture has shifted.
What the Latest Forecasts Say
The WMO’s Global Annual to Decadal Climate Update, released on 28 May 2026, covers the years 2026 to 2030. It gave a ninety one percent chance that at least one of those years will exceed 1.5°C. It also gave a seventy five percent chance that the five year mean will exceed that level.
The same report found an eighty six percent chance that a new record year will arrive within the period. Exceeding 2°C in any single year is considered exceptionally unlikely, with a chance below one percent. Last year’s update had put the five year mean chance at seventy percent, so the odds keep rising.
Why Emissions Haven’t Turned the Corner
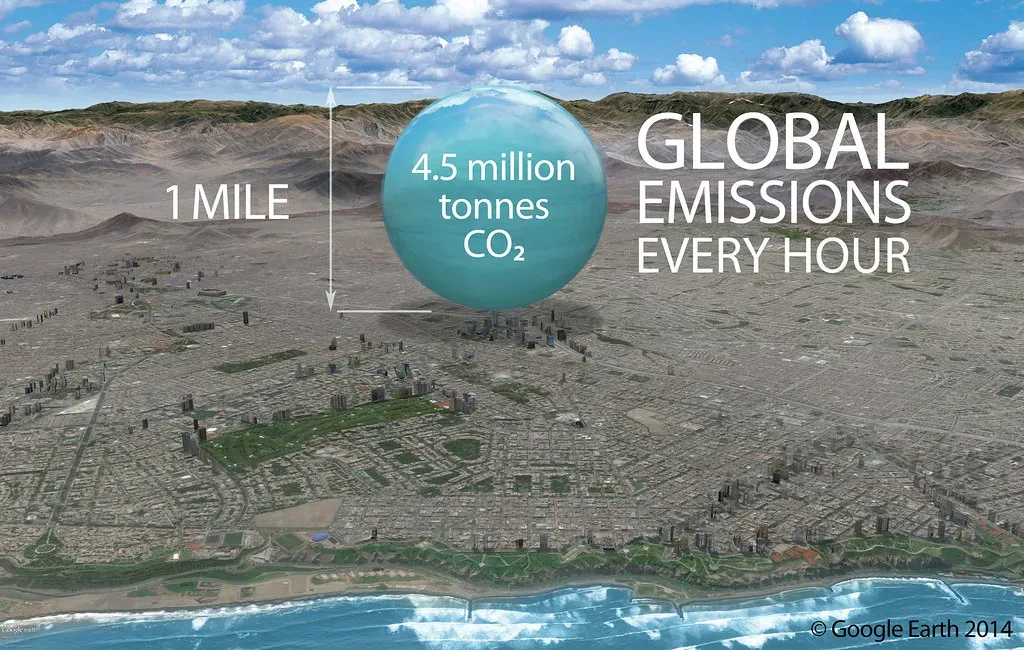
The UN Environment Programme’s Emissions Gap Report 2025 found that global greenhouse gas emissions grew by 2.3 percent in 2024, reaching 57.7 gigatons of carbon dioxide equivalent. To stay on a 1.5°C path, emissions in 2030 would need to be about forty percent below 2019 levels. Only five years remained for that when the report came out.
Among the six largest emitters, only the European Union reduced its emissions in 2024, according to a summary of the report. Also, by 30 September 2025 only sixty parties, covering about sixty three percent of global emissions, had submitted new 2035 targets. That left a large share of the picture unfinished.
Where Current Policies Are Heading
UNEP’s projections for this century are higher than 1.5°C even if countries deliver on their pledges. Full implementation of national pledges points to 2.3 to 2.5°C, while current policies alone lead to about 2.8°C. A year earlier, those figures were 2.6 to 2.8°C and 3.1°C.
There is real progress in the long view. Projections under current policies were just below 4°C when the Paris Agreement was adopted, and they now sit just below 3°C. UNEP cautions that comparisons across a decade are complicated by changes in method.
Overshoot and What Comes After

UNEP’s central finding is that the long term average will exceed 1.5°C, at least temporarily, and very likely within the next decade. It says stringent near term cuts could delay the onset of overshoot but not avoid it entirely. Reversing overshoot would require faster and larger emissions reductions.
The report also warns against leaning too heavily on carbon dioxide removal methods, which remain uncertain at scale. Copernicus’s director, Carlo Buontempo, has described passing the threshold as inevitable. The open questions now are how high temperatures climb beyond 1.5°C and how long they stay there.
