

If your eyes have been itchier and your tissue box emptier than usual these past few springs, you are not imagining things. Across the country, the window for sneezing, coughing, and watery eyes has been stretching in both directions, starting earlier in the year and hanging on longer into fall.
New data from climate researchers and allergy specialists released in 2026 shows this is not a uniform trend. Some regions are seeing modest shifts, while others have picked up weeks, even months, of extra pollen exposure. Here is a region by region look at where the science says allergy season has changed the most.
The Northwest is leading the shift
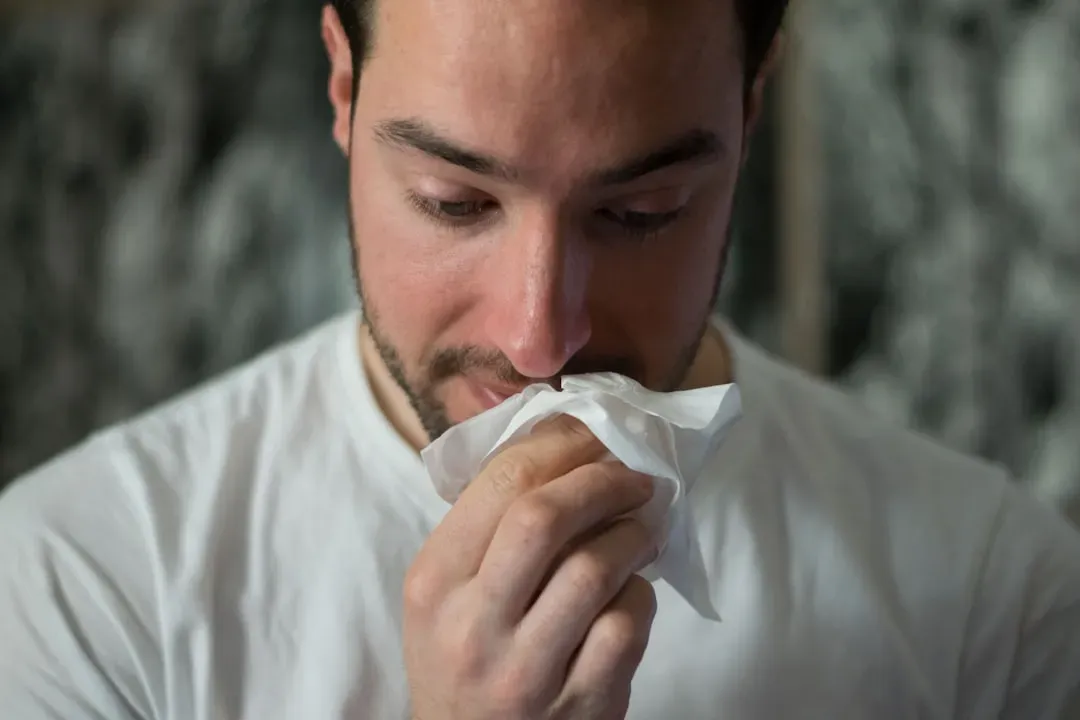
No region has changed faster than the Pacific Northwest. All U.S. climate regions have seen their freeze-free growing seasons lengthen, led by the Northwest, with an average of 31 more days compared to the early 1970s. That is more than a month of additional time each year for trees, grasses, and weeds to grow and release pollen.
The practical effect shows up in daily life. Allergy sufferers there now endure about 187 days of pollen between the first and last freeze of the year. Cities like Seattle and Portland have started seeing elevated pollen counts earlier in the calendar, a pattern meteorologists tie directly to milder winters and earlier springs settling into the region.
The Southwest has posted some of the biggest single city jumps
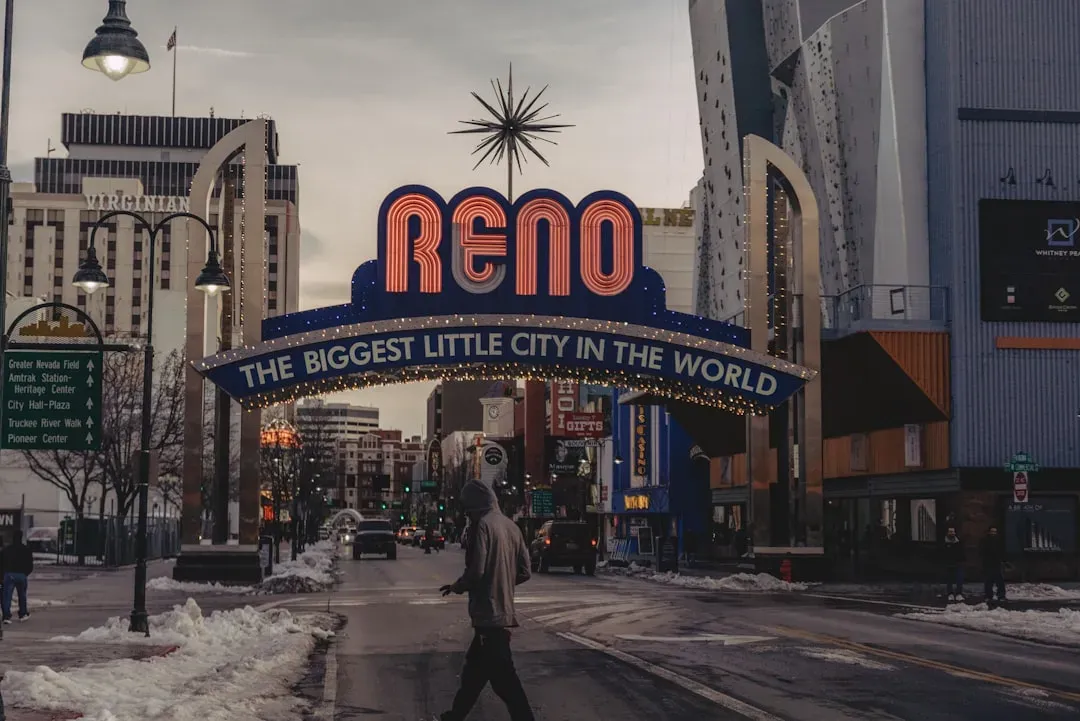
While the Northwest leads on a regional average basis, individual Southwest cities have recorded some of the most dramatic increases in the entire analysis. The growing season lengthened the most in Reno, Nevada, by 100 more days. That is a difference of more than three months compared to conditions in the early 1970s.
Earlier Climate Central data pointed to a similar story in New Mexico. The freeze-free growing season increased the most in Reno, Nev. (96 more days); Las Cruces, N.M. (66 more days); Medford, Ore. These are not small statistical blips. They represent entire extra seasons layered onto what used to be a shorter, more predictable allergy calendar.
The South is picking up extra weeks on both ends
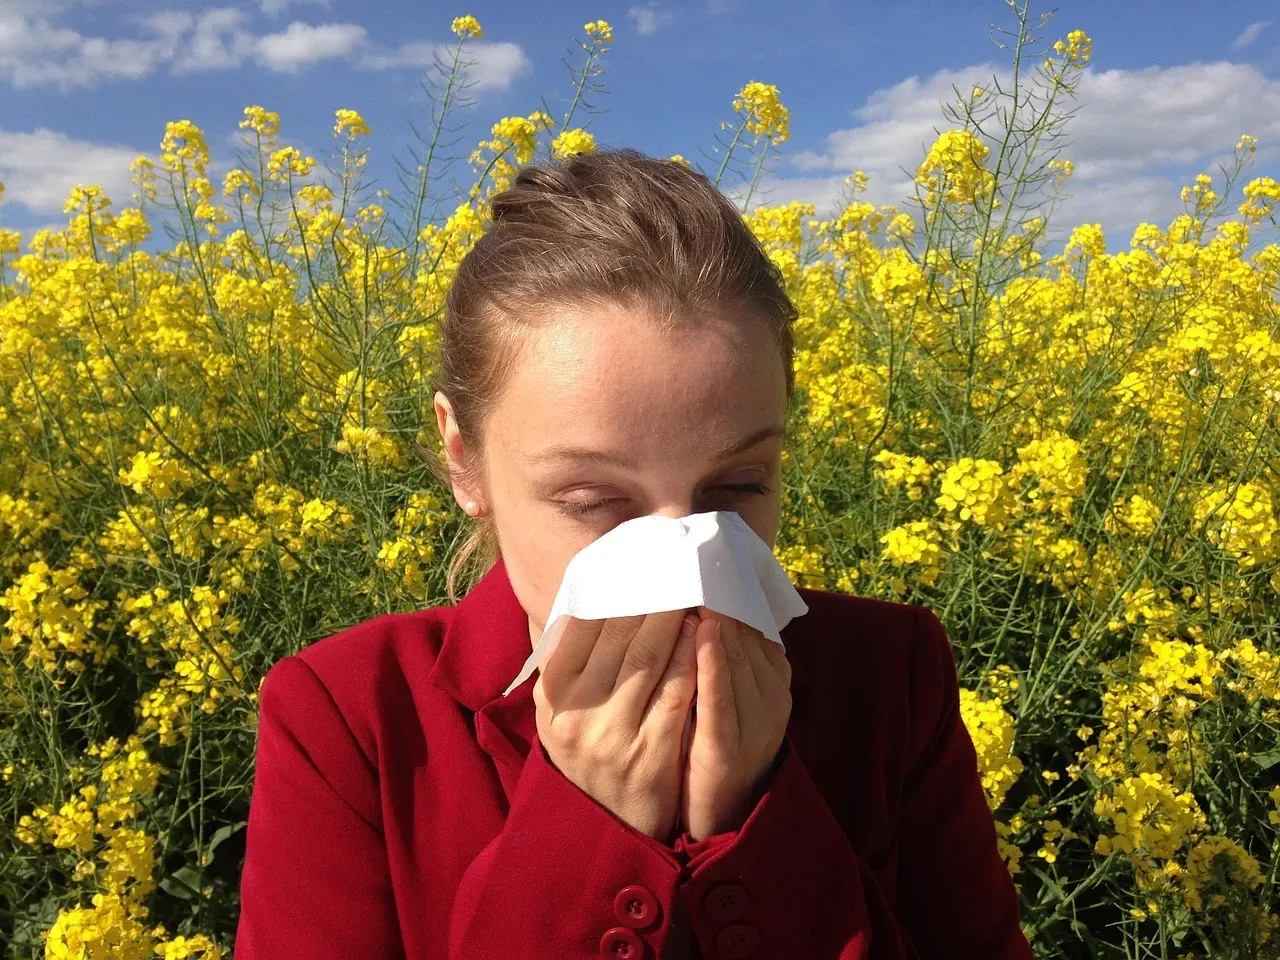
Southern cities have also seen notable extensions, even if the numbers are less extreme than in parts of the West. Across the map to the South, Tupelo, Mississippi, and Myrtle Beach, South Carolina, are both seeing 51 extra days of allergy season. That is nearly two additional months compared with several decades ago.
Regional averages back this up as well. The Northwest has gained 31 days, the Southwest 22, the Southeast 19, and the Northeast 17. For residents of Southeastern cities, this often means tree pollen arriving noticeably earlier in late winter and lingering well past the point it used to fade.
The Mountain West has produced a surprise new leader
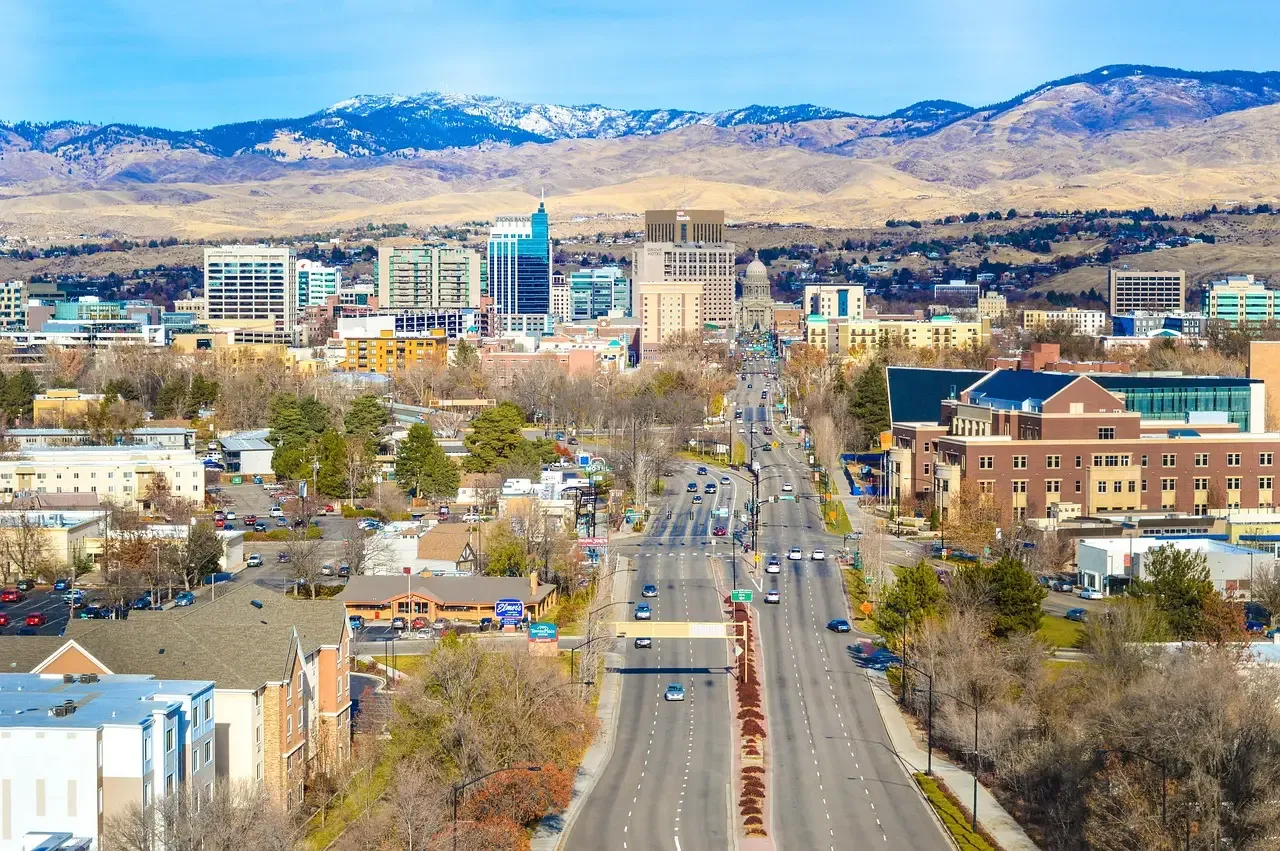
Perhaps the most striking development in 2026 came from a city that had never topped the allergy rankings before. Boise, Idaho, claimed the top spot due to higher-than-average pollen levels and relatively low availability of allergy specialists, moving into the top spot due to tree pollen peaking earlier and lasting longer as well as a significant increase in the number of days with high or very high grass pollen. A wet winter followed by an early warm spring created the conditions.
The shift was not limited to one city. The top cities were all over the map instead of focused in the Southeast, like in years past. Other Mountain West and interior cities including Provo, Ogden, and Salt Lake City in Utah, along with Colorado Springs, also broke into the top twenty for the first time, signaling a broader westward shift in where allergy sufferers face the toughest conditions.
The Northeast has gained weeks it did not used to have

Northeastern cities have not escaped the trend either, even though their regional average increase is smaller than the West’s. Physicians in New York have noted the practical impact directly, with one telling reporters that experts are expecting that allergy season is going to last 180 days in the Northeast, that’s 20 days longer than we’re usually used to.
Rochester, New York, ranked among the toughest cities nationally in the 2026 Allergy Capitals report, landing at number five on the list of the most challenging metro areas for pollen allergies. Combined with high pollen counts recorded in New York City and Boston during recent spring seasons, the region has moved from being a relatively mild allergy zone to one where symptoms now stretch well into what used to be considered the off season.
The Midwest and Ohio Valley are seeing grass and weed pollen climb
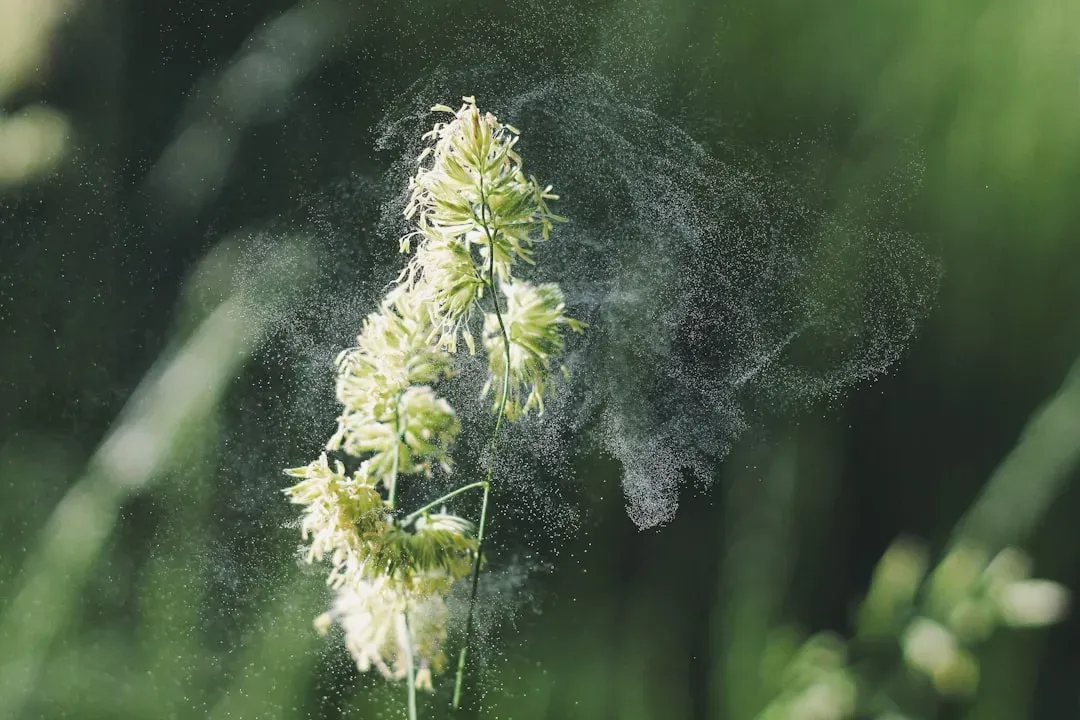
Cities in the Midwest and Ohio Valley region have also shown up prominently in the latest rankings. Minneapolis, Toledo, and Wichita all appeared in the top twenty of AAFA’s 2026 Allergy Capitals report, with forecasters noting that grass pollen levels are expected to run above average this spring and summer across parts of the region.
Wichita’s case is particularly telling. The Kansas city had held the number one spot in the national rankings for two consecutive years before slipping to sixth in 2026, according to Allergic Living’s coverage of the report, a reminder that even cities long associated with severe pollen seasons are being overtaken by newer hot spots as conditions shift regionally.
Northern cities are catching up fast on ragweed season
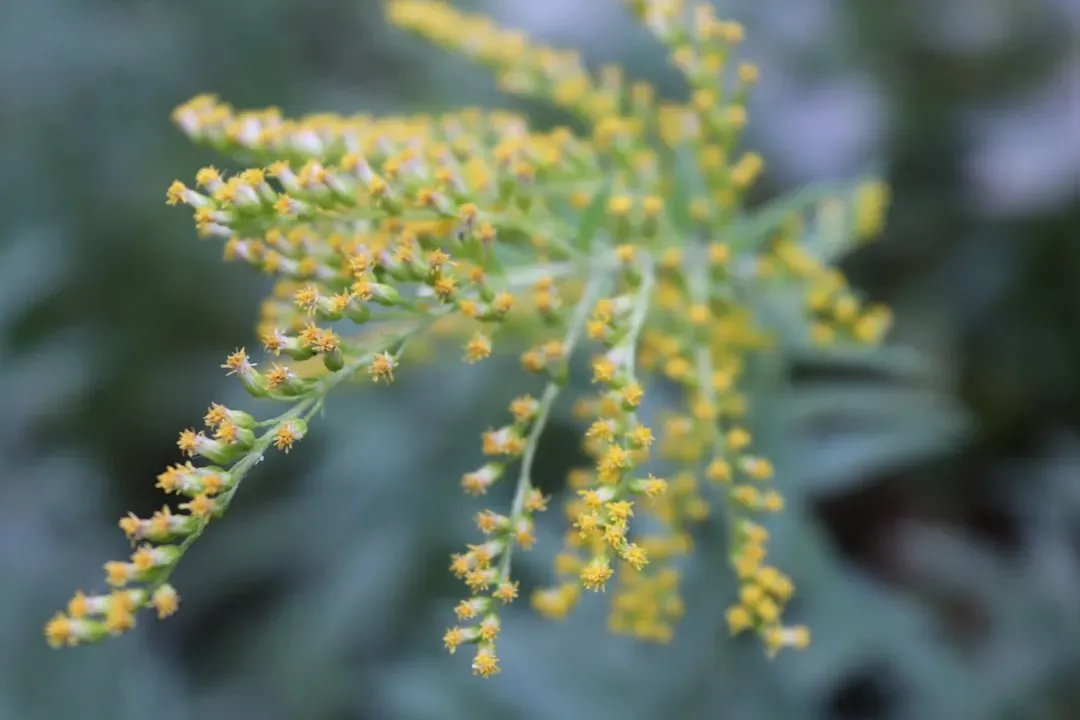
One of the clearest and longest running signals of change involves ragweed, the plant most responsible for fall allergy misery. Federal data shows the pattern is most pronounced at higher latitudes. The increase in ragweed season length generally becomes more pronounced from south to north, with ragweed season increasing by 25 days in Winnipeg, Manitoba, 24 days in Saskatoon, Saskatchewan, 21 days in Fargo, North Dakota, and 18 days in Minneapolis, Minnesota.
Researchers attribute this directly to later fall frosts. Northern areas have seen fall frosts happening later than they used to, with the delay in first frost closely matching the increase in pollen season. For residents of upper Midwest and northern Plains cities, this means the classic autumn allergy stretch now runs noticeably longer than it did for their parents’ generation.
California and the West Coast have joined the toughest tier
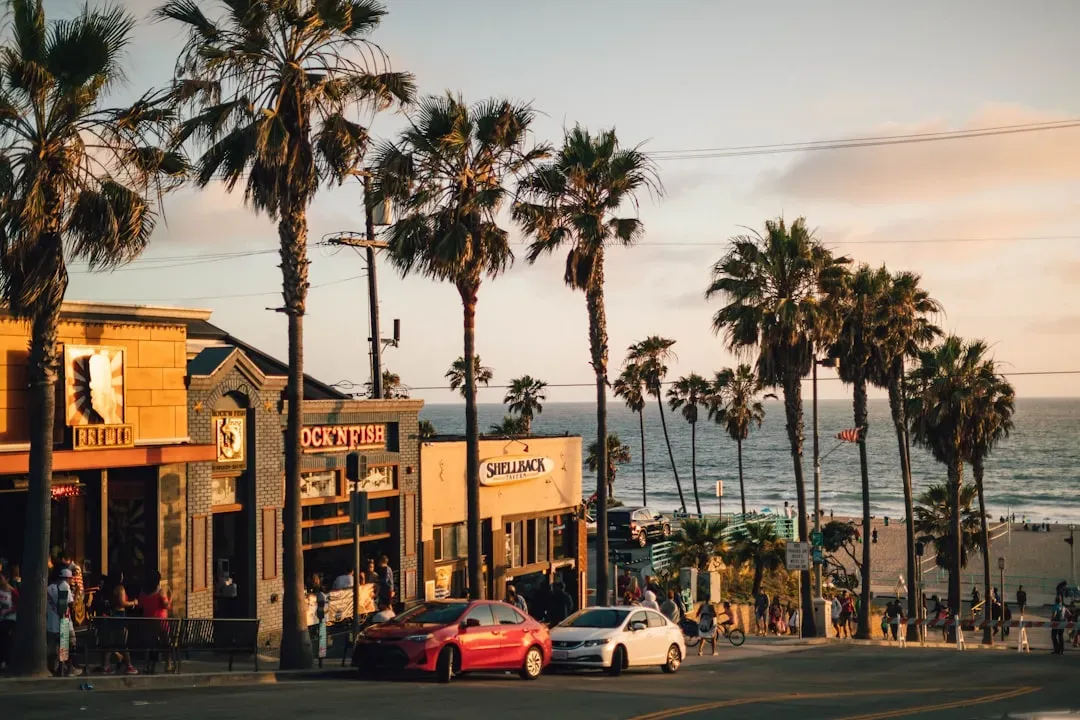
California cities made an unusually strong showing in the 2026 rankings, a shift researchers say reflects real changes in pollen conditions rather than a fluke year. San Diego jumped to the number two spot nationally, while San Francisco landed at number eleven, marking the first time multiple California metros have ranked so high simultaneously.
AAFA’s research director described the shift as unprecedented in the report’s history. “There were quite a few shake-ups this year,” AAFA’s research director Hannah Jaffee said, noting that “this year’s report features a number of cities in the Western U.S. among the Top 20 for the first time ever.” Warmer winters and increased precipitation variability along the coast appear to be driving the change.
The nationwide numbers explain why almost no region is exempt
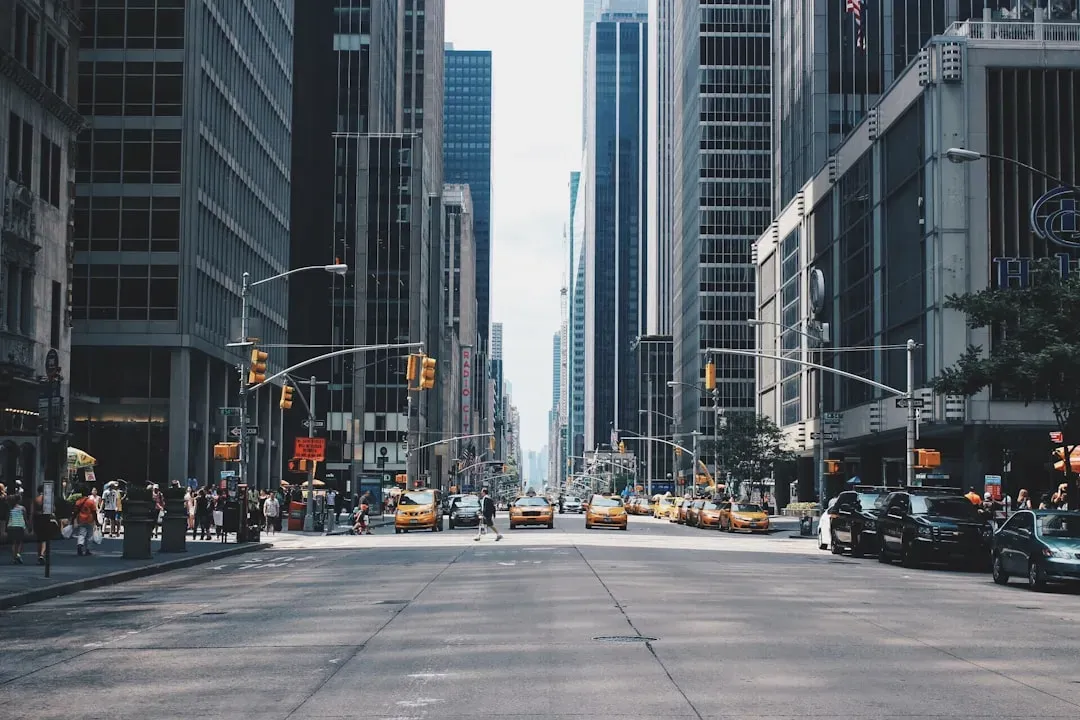
Stepping back from individual cities, the broader dataset makes clear this is a nationwide pattern rather than a handful of isolated hot spots. The freeze-free growing season lengthened in 87% (173) of the 198 U.S. cities analyzed, by 21 days on average from 1970 to 2025. That means the overwhelming majority of American cities studied are dealing with a longer pollen window than they were a half century ago.
Scientists point to a specific mechanism behind the trend. Rising carbon dioxide levels from fossil fuel emissions are contributing to higher temperatures and increased pollen production, a concerning trend for millions of Americans who struggle with seasonal allergies. Longer term projections suggest this is likely to continue rather than level off, since researchers have found that higher levels of carbon dioxide can increase pollen production, and one study predicts that we’ll be facing a 200% increase in pollen production by the end of the century.

- Insurers Ranked Every State by Climate Risk – This One Came in Dead Last - August 18, 2026
- I Asked 3 Water Engineers How Bad the Next Drought Will Be – Their Answers Didn’t Match - August 18, 2026
- The Real Reason Some Cities Are Becoming Unlivable in Summer – And It’s Not Just Heat - August 18, 2026
