


- Why Meteorologists Are Redrawing the Maps for Winter Superstorms - August 20, 2026
- Why the Next Major Blizzard Is Forecast Sooner Than History Predicts – And Where It Will Hit - August 19, 2026
- Why the Next Extreme Heat Wave Is Expected Sooner Than Usual – And Where It Will Hit First - August 19, 2026
Something has shifted in the American climate in a way that is hard to ignore. In cities across the United States, the average rate of extreme heat events increased from two per year in the 1960s to ten per year between 2010 and 2020. That fivefold jump is not a statistical curiosity – it is a sustained, structural change in how hot this country gets, and how often. The year 2024 was the hottest year on record, with global average temperatures more than 1.5°C above the 1850–1900 average. The heat is no longer coming. For millions of Americans, it is already here.
Extreme heat is the leading cause of weather-related deaths in the United States, resulting in an average of 238 fatalities a year between 1995 and 2024. Yet those numbers only capture official tallies. Researchers believe the true toll is considerably higher once indirect deaths – heart attacks, strokes, and organ failure triggered by heat stress – are counted in. The start of summer 2025 brought a massive heat dome over the United States, subjecting more than 255 million Americans to what meteorologists called “dangerous, life-threatening” conditions of triple-digit temperatures and high humidity. The map of risk is not uniform, however. Some regions are facing conditions that stand apart even within this alarming national picture.
The Desert Southwest: Where Temperatures Reach the Extreme
No region in the continental United States endures more raw, sustained heat than the Desert Southwest. Las Vegas set a new all-time record of 120°F on July 7, 2024, while Palm Springs hit an all-time high of 124°F on July 5, and Death Valley reached 129°F on July 7. These are not anomalies contained to a single afternoon – they represent a pattern of escalating extremes baked into the region’s summers. Las Vegas is one of the fastest-warming cities in the country, according to a study published by the nonprofit organization Climate Central.
Last year was particularly deadly for southern Nevada, with 527 heat-related fatalities, according to the Clark County Coroner and Medical Examiner’s office. The summer of 2024 was southern Nevada’s hottest in recorded history, according to the National Weather Service. The heat in this region is dry and relentless, compounding across days and nights without meaningful relief. Reno, Nevada, has seen average summer temperatures rise by 11.3 degrees Fahrenheit since 1970 – nearly double the increase seen in the next-highest cities, which include Boise, Idaho, and El Paso, Texas at +6.3 degrees, and Las Vegas at +6.2 degrees.
Phoenix and Maricopa County: The Nation’s Heat Death Capital
Phoenix occupies a category of its own when it comes to heat mortality. Residents of Phoenix suffered through 113 consecutive days of temperatures over 100 degrees in 2024 – the longest such streak ever recorded, a full month longer than the 1993 record of 76 days. The city sits in the Sonoran Desert and is further amplified by an intense urban heat island effect, where dense concrete and asphalt absorb and radiate heat long after sundown. Heat-related deaths in Maricopa County increased approximately tenfold from 61 in 2014 to 645 in 2023, and during 2019–2023 the county experienced an annual average of 36 days with a daily high temperature at or above 110°F.
Maricopa County recorded 602 heat-linked deaths in 2024, down from 645 in 2023 – a record-breaking number. The modest decline came despite 2024 being the hottest summer on record for metro Phoenix, suggesting that deliberate interventions such as 24/7 cooling shelters can make a real difference. In 2024, many of Maricopa County’s heat deaths involved unsheltered individuals, outdoor workers, people in poverty, or those unable to access air conditioning. The crisis is inseparable from housing instability and economic vulnerability – structural problems that no amount of shade trees can fully solve.
The Gulf Coast: When Humidity Makes Heat Deadly
High humidity transforms an already dangerous situation into a potentially unsurvivable one. When the air is saturated with moisture, sweat cannot evaporate efficiently, and the body loses its primary cooling mechanism. In the U.S., the South and Southeast face the highest burden of dangerous humid heat, and some areas of the Gulf Coast currently experience more than 100 such days annually, on average. That is not a few bad weeks in August – it is a third of the entire year spent in conditions where outdoor exertion becomes a genuine health risk.
The entire Gulf Coast saw a hotter-than-average season in 2024, and with Gulf of Mexico waters spiking to record highs, any cooldown may struggle to last. Heat warnings and advisories covered some of Texas’ biggest cities, from Austin to San Antonio and Houston. The problem is compounding: sea surface temperatures in the Gulf hit record highs in both 2024 and 2025, feeding warm, humid air into the region and keeping nighttime temperatures dangerously elevated. Tropical and coastal areas face the greatest risk of unbearable heat due to their high humidity, which can lead to extremely high heat indices – this is why Southeastern U.S. cities have the highest heat risks in the country, with the Southwest close behind.
Texas: A State Rewriting Its Own Heat Records

Texas is large enough to have multiple distinct climate zones, but extreme heat has become a unifying reality across nearly the entire state. Texas as a whole has warmed exceptionally quickly, becoming the hottest state in the country. Across the state, triple-digit heat has become the norm, and in the past ten years, there have been 1,000 more days of record-breaking heat than in a typical decade. Cities along the southern border – McAllen, Laredo, Brownsville – combine blistering temperatures with Gulf humidity to produce heat index values that can exceed 115°F.
Laredo saw a record-breaking summer in 2023, with July posting the hottest month in the city’s history. Further north, College Station illustrates how inland Texas is hardly safe from the heat’s grip. College Station endured a scorching 2024, with heat indexes of 110°F leading to nearly monthlong heat warnings and advisories in August. The state’s electrical grid faces repeated stress tests during these events, and the burden on public health systems grows steeper with every passing summer.
The Pacific Northwest: Unprepared for a New Reality
The Pacific Northwest built its identity around cool, misty summers. That identity has become dangerously out of date. The heat dome that descended upon the Pacific Northwest in late June 2021 met a population radically unprepared for it – almost two-thirds of households earning $50,000 or less and 70% of rented houses in Washington’s King, Pierce and Snohomish counties had no air conditioning. The consequences were devastating. The 2021 heat dome was Washington’s deadliest weather disaster on record, contributing to 441 deaths in the state between June 27 and July 3, and medical systems were overwhelmed.
Indoor overheating is a growing concern, particularly in parts of the inland West and Pacific Northwest where many homes were built for historically cooler climates and may lack air conditioning or adequate ventilation. The region’s rapid summer warming compounds this problem year by year. The cities at the top of the fastest-warming ranking are concentrated in the West and Southwest, and Climate Central found that summer warming has been strongest, on average, across the Northwest, Southwest and South. A region with little historical experience of extreme heat, and housing stock built accordingly, faces a particularly steep adaptation challenge.
Urban Heat Islands: The Hidden Layer of Risk
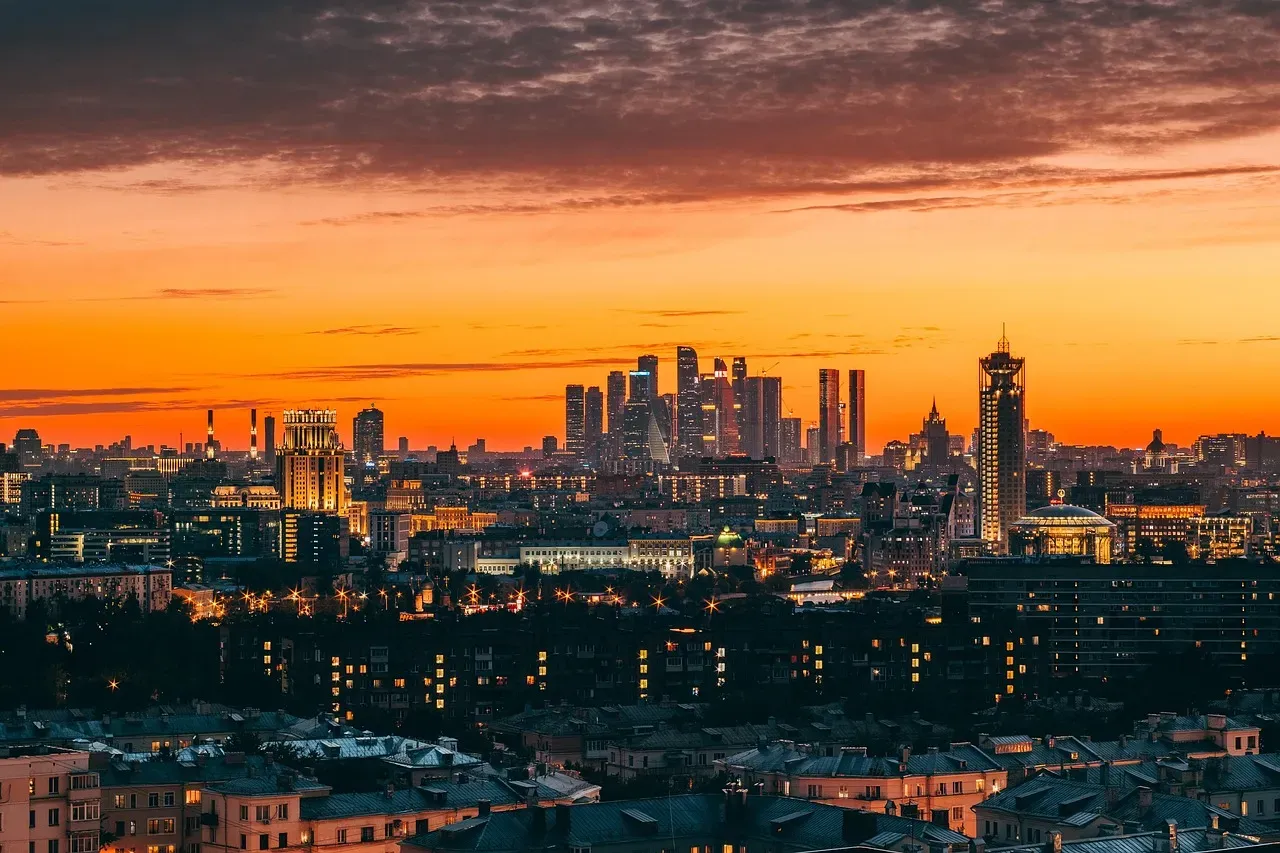
Wherever you look on the heat map, cities intensify the danger. Urban centers, which have fewer trees, less grass, and heat-absorbing pavement, can be up to 20 degrees hotter than nearby neighborhoods, according to the National Oceanic and Atmospheric Administration. That differential is not abstract – it means a low-income neighborhood with few trees in Phoenix, Houston, or Los Angeles can register conditions far beyond what the official city temperature suggests. According to a 2021 study, people of color and people living below the poverty line are disproportionately exposed to urban heat island intensity in 169 of the largest U.S. cities.
Recent analysis from Columbia University’s Grades of Heat project shows that historically redlined areas currently experience hotter summers than non-redlined areas in 84 percent of 179 major U.S. cities. In other words, decades-old housing discrimination has left a thermal fingerprint on American cities that is now costing lives. In Atlanta, data on the heat-mitigation potential of reflective roofs helped spur the city’s 2025 Cool Roof Ordinance – a policy expected to lower citywide temperatures by 1.4 degrees Celsius and cool the hottest and most vulnerable neighborhoods by up to 3.5 degrees Celsius. Targeted interventions work, but they require political will and adequate funding to scale.
Vulnerable Populations: Who Bears the Greatest Burden
The heat map of the United States is, in many ways, also a map of inequality. Extreme heat is particularly deadly for the elderly, young children, people with underlying health conditions, and people in disadvantaged communities. These groups face compounding risks: less access to air conditioning, greater likelihood of working outdoors, reduced ability to recognize early heat illness symptoms, and fewer resources to evacuate or adapt. High humidity and elevated nighttime temperatures are likely key ingredients in causing heat-related illness and mortality, and when extreme heat persists into the night, it can cause severe health problems – especially for people who lack access to cooling, often in low-income communities.
Homelessness – specifically unsheltered homelessness – is among the largest factors in the rise in heat-related deaths in Maricopa County. The county’s unsheltered homeless population rose from just over 1,000 in 2014 to nearly 5,000 in 2023. Outdoor workers, including farmworkers and construction crews, face a parallel threat. Humid heat is especially dangerous for weather-exposed workers, presenting health and safety hazards, causing heat-related illness, injury, or death, and impacting livelihoods through lost labor hours and wages. Protecting these populations requires more than public awareness campaigns – it demands enforceable standards and structural investment.
The Trajectory: What the Next Decades Look Like
If current trends continue, the heat map will not simply stay as it is. It will get worse, and it will spread. A Washington Post analysis estimated that the average number of Americans experiencing at least three consecutive days of temperatures 100 degrees or higher each year will climb from roughly 46 percent today to 63 percent over the next 30 years. Regions that have historically considered themselves safe from extreme heat – the upper Midwest, the mid-Atlantic, even parts of New England – are beginning to see days that push past dangerous thresholds. The average rate of heat waves in the United States has tripled since the 1960s, and record highs now occur twice as often as record lows across the continental United States.
As of 2024, the average length of heat-wave season in the U.S. has increased by 46 days since the 1960s. Longer seasons mean more cumulative exposure, more stress on bodies that never fully recover, and higher electricity demand during the hottest and most critical periods. When temperatures stay elevated after sunset, the body has less chance to recover from daytime heat, raising the risk of heat-related illness, hospitalization, and even death – and Climate Central notes that extreme heat is the leading cause of weather-related deaths in the United States. The map that should worry you is not the one showing today’s forecast. It is the one showing where the country is heading – and the communities that will be most exposed when it gets there.
