
Carbon footprints vary wildly depending on where you live, and nowhere is that more obvious than when you compare the biggest polluters in the United States with some of the cleanest performers in South America. On one side of the ledger, several U.S. states burn through fossil fuels at a scale that dwarfs entire countries, driven by heavy industry, coal-fired power plants, and sprawling transportation networks. On the other side, a handful of South American nations post remarkably low per capita emissions, thanks to hydropower, smaller industrial bases, and different economic structures.
This piece looks at six U.S. states that consistently rank among the nation’s top carbon emitters, whether measured by total output or emissions per person, and then turns to four South American countries that sit at the opposite end of the spectrum. The contrast says a lot about how energy choices, population size, and economic development shape a region’s climate impact.
1. Texas

Texas is not close when it comes to total carbon output. Texas currently leads with 669.9 million metric tonnes (MMT) emitted in 2023. That figure reflects the state’s massive energy sector, its refineries, and its sheer size as both the second most populous and second largest state in the country.
The breakdown by sector tells the story clearly. High electricity production across Texas placed it at the top of the electric power sector’s carbon emissions list in 2023. On top of that, in 2023, Texas produced 235.8 MMT of carbon dioxide for the industrial sector, more than twice the amount of any other state in the U.S. Texas also topped the charts for transportation emissions, a reflection of its long highways and heavy freight traffic.
2. Wyoming
When emissions are measured per person rather than in raw totals, Wyoming jumps to the very top of the list. Wyoming had the highest per capita energy-related carbon dioxide emissions in the U.S. in 2022, at 96.6 metric tons (tCO₂), a figure that dwarfs the national average. By comparison, the U.S. average stood at 14.8 tCO₂ per capita.
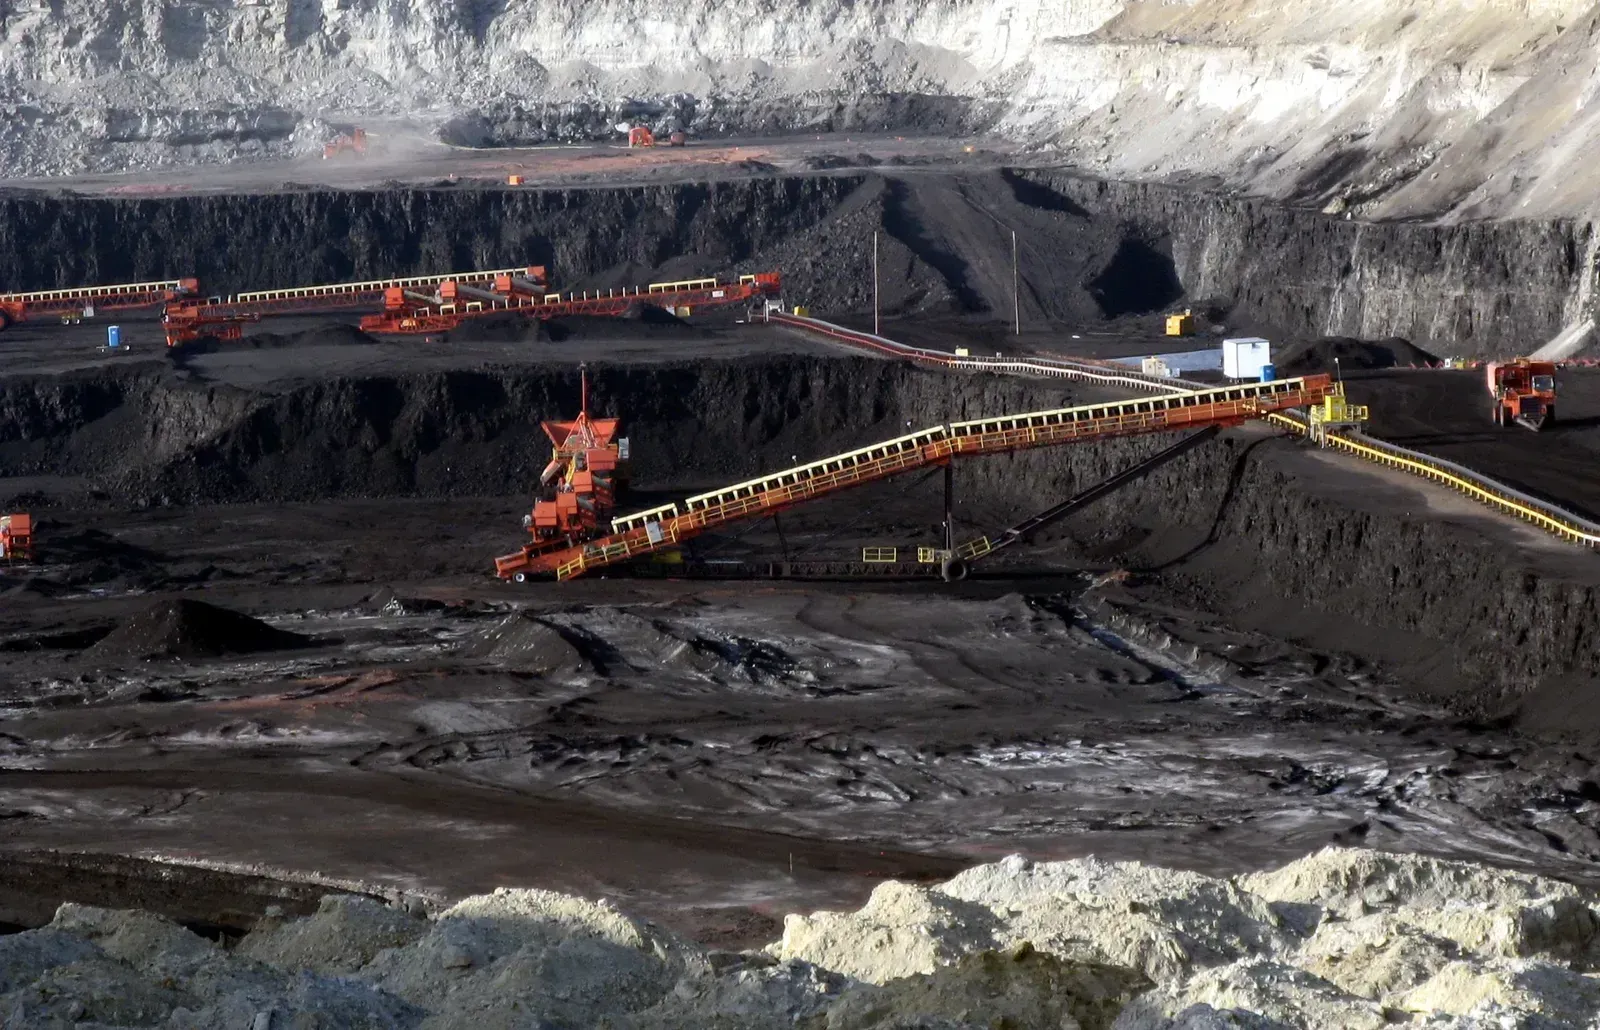
That gap exists mostly because of what the state produces rather than how many people live there. Wyoming’s large carbon footprint is mainly due to the state’s coal industry. With a tiny population spread across a state that mines and burns enormous quantities of coal, the math simply pushes Wyoming’s per capita numbers far above every other state.
3. North Dakota
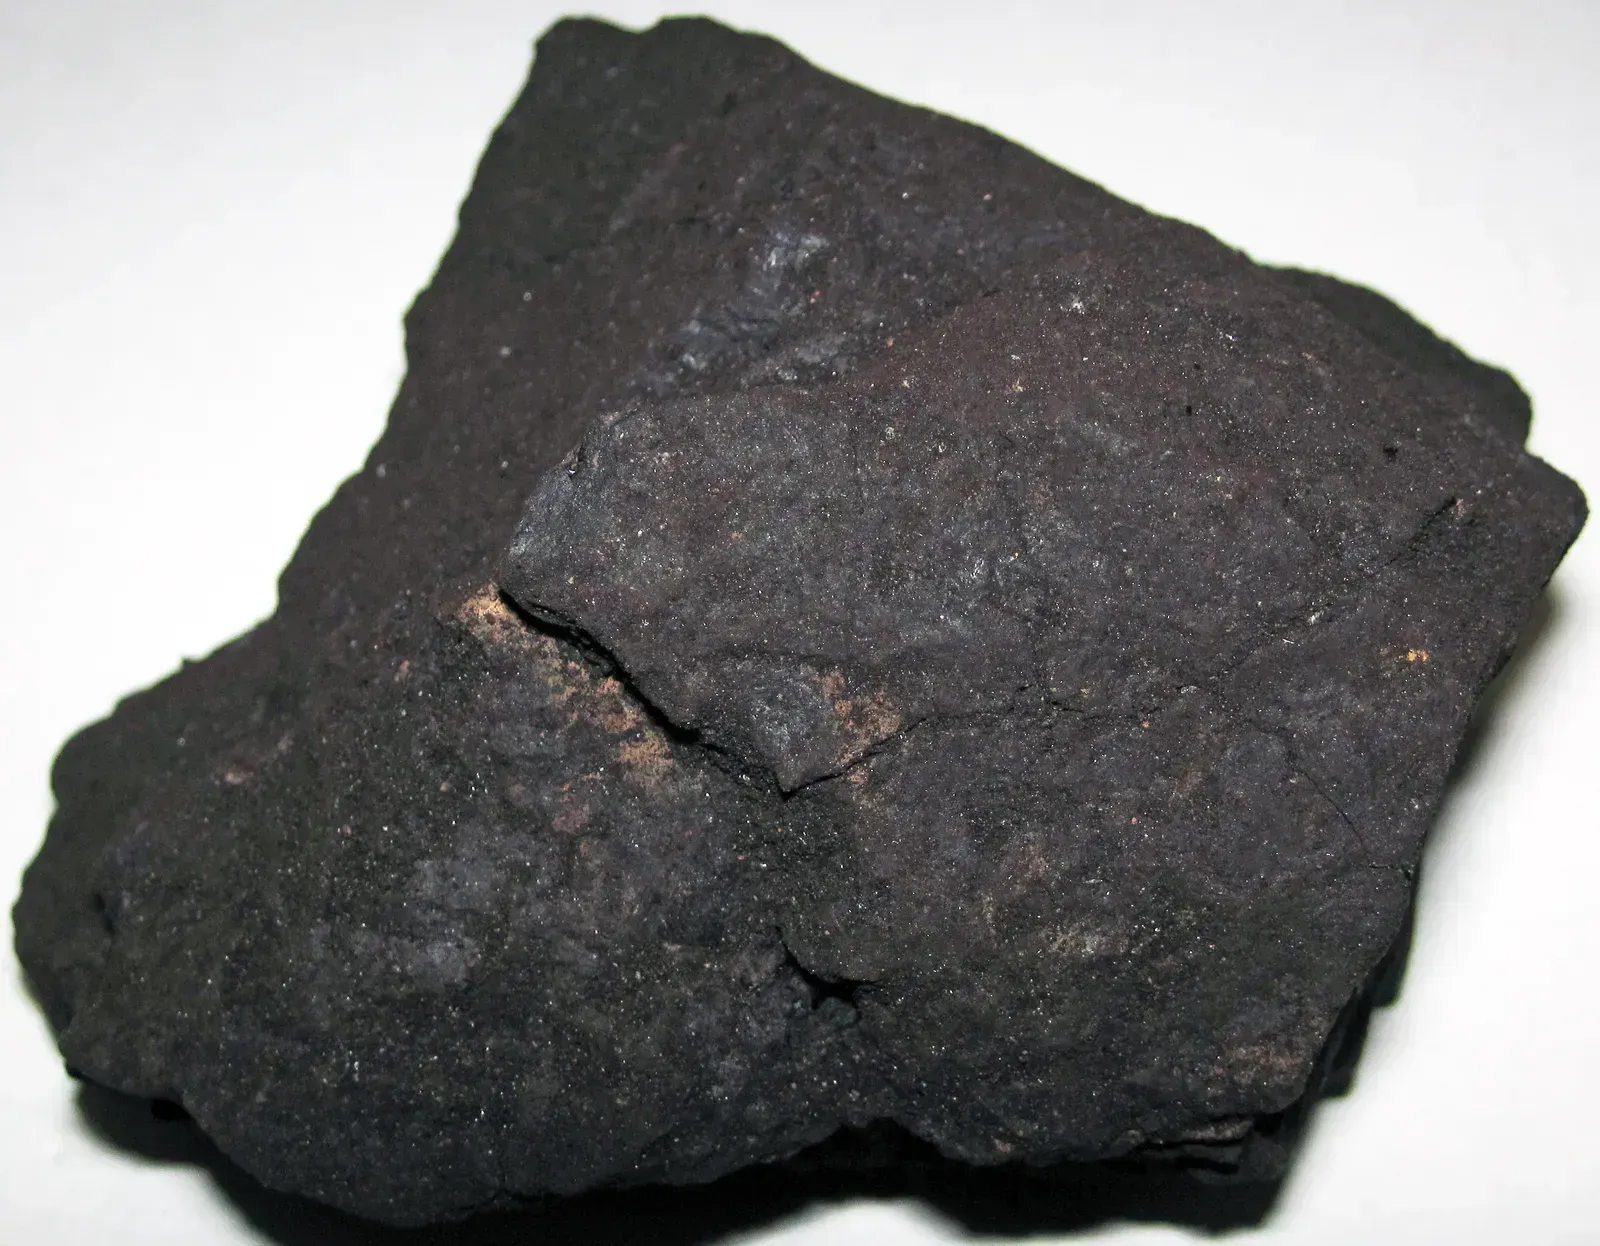
North Dakota consistently lands in second place for per capita carbon emissions. The second largest producer of carbon dioxide emissions is North Dakota, with 74.81 metric tons produced annually, as this state has a high energy intensity rating, consuming between 17,000 and 19,000 BTUs per dollar of the state’s gross domestic product. That intensity reflects an economy built heavily around energy extraction and processing.
Weather plays a role too. North Dakota also experiences extremely cold winters, which creates an increased demand for heating and energy. Combine that seasonal demand with a robust coal mining sector and an agricultural industry that runs plenty of fuel-burning equipment, and the state’s per capita numbers stay stubbornly high year after year.
4. West Virginia

West Virginia’s story is almost entirely about coal. West Virginia has the third highest level of carbon dioxide emissions, with residents producing 52.47 metric tons of carbon dioxide emissions per year. Few states in the country remain as dependent on a single fossil fuel for their energy mix.
The numbers back that up in striking detail. Approximately 98% of its energy comes from the following fossil fuels: coal (77%), natural gas (12.8%), and oil (8.6%). That reliance also shows up in the power sector specifically, where West Virginia had the highest power sector carbon intensity amongst all U.S. states in 2024, at pounds of carbon dioxide per megawatt hour of electricity produced.
5. Kentucky

Kentucky rounds out the group of states whose electricity generation leans heavily on carbon-intensive fuel sources. According to recent power sector data, ranking second that year was Kentucky, which generated a high volume of lbs CO₂/MWh, trailing only West Virginia among all states measured. That places Kentucky firmly among the dirtiest electric grids in the country.
Much like its Appalachian neighbor, Kentucky’s grid has historically leaned on coal for a large share of its power supply. While the state has been slowly adding more natural gas and renewable capacity, the transition has been gradual, and coal still plays an outsized role in keeping the state’s carbon intensity numbers stubbornly elevated compared to most of the rest of the country.
6. California
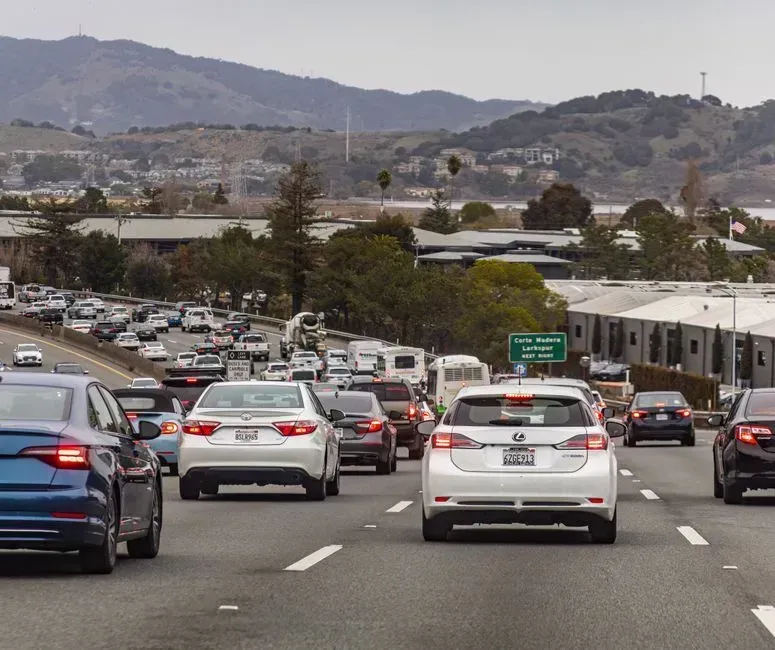
California is an interesting case because it combines a huge population with one of the largest transportation networks in the country, which keeps its total emissions high even though its per capita numbers are relatively low. Texas and California emitted the most carbon dioxide for the transportation sector, with 223 and 181.3 MMT, respectively, making California the runner-up nationally in that category.
Vehicle traffic, not heating or heavy industry, drives most of California’s footprint. In California, the transportation sector is responsible for the largest amount of carbon dioxide emissions, more than 50% of the state’s total. The state has made real progress on efficiency, and one of the reasons for the state’s low emissions per capita is that most of the state experiences mild weather in the winter, resulting in a lower demand for heating and energy, while California has managed to progressively decrease its energy intensity rating since 2000. Still, sheer population size and car dependency keep its absolute numbers near the top of the national rankings.
1. Paraguay
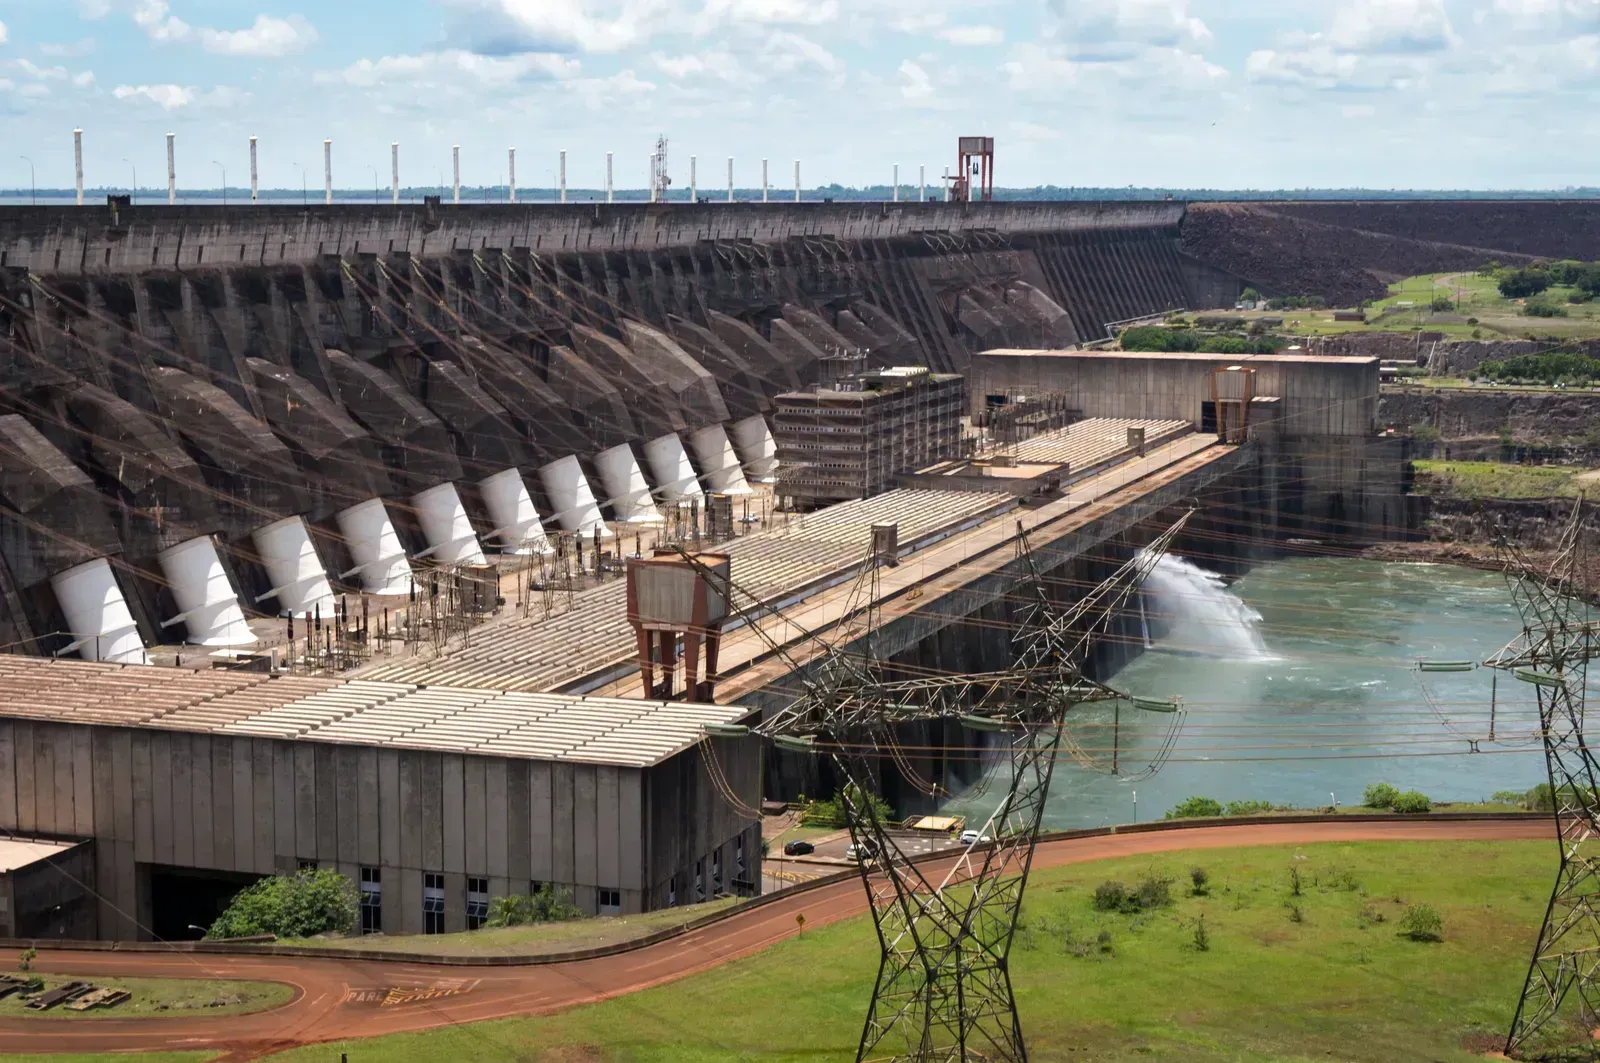
Paraguay sits at the very bottom of South America’s per capita emissions rankings, and it isn’t particularly close. The lowest value in the region was in Paraguay, at 1.21 metric tons of carbon dioxide equivalent per capita, well under half the regional average. That’s a remarkable figure for a country of its size and economic activity.
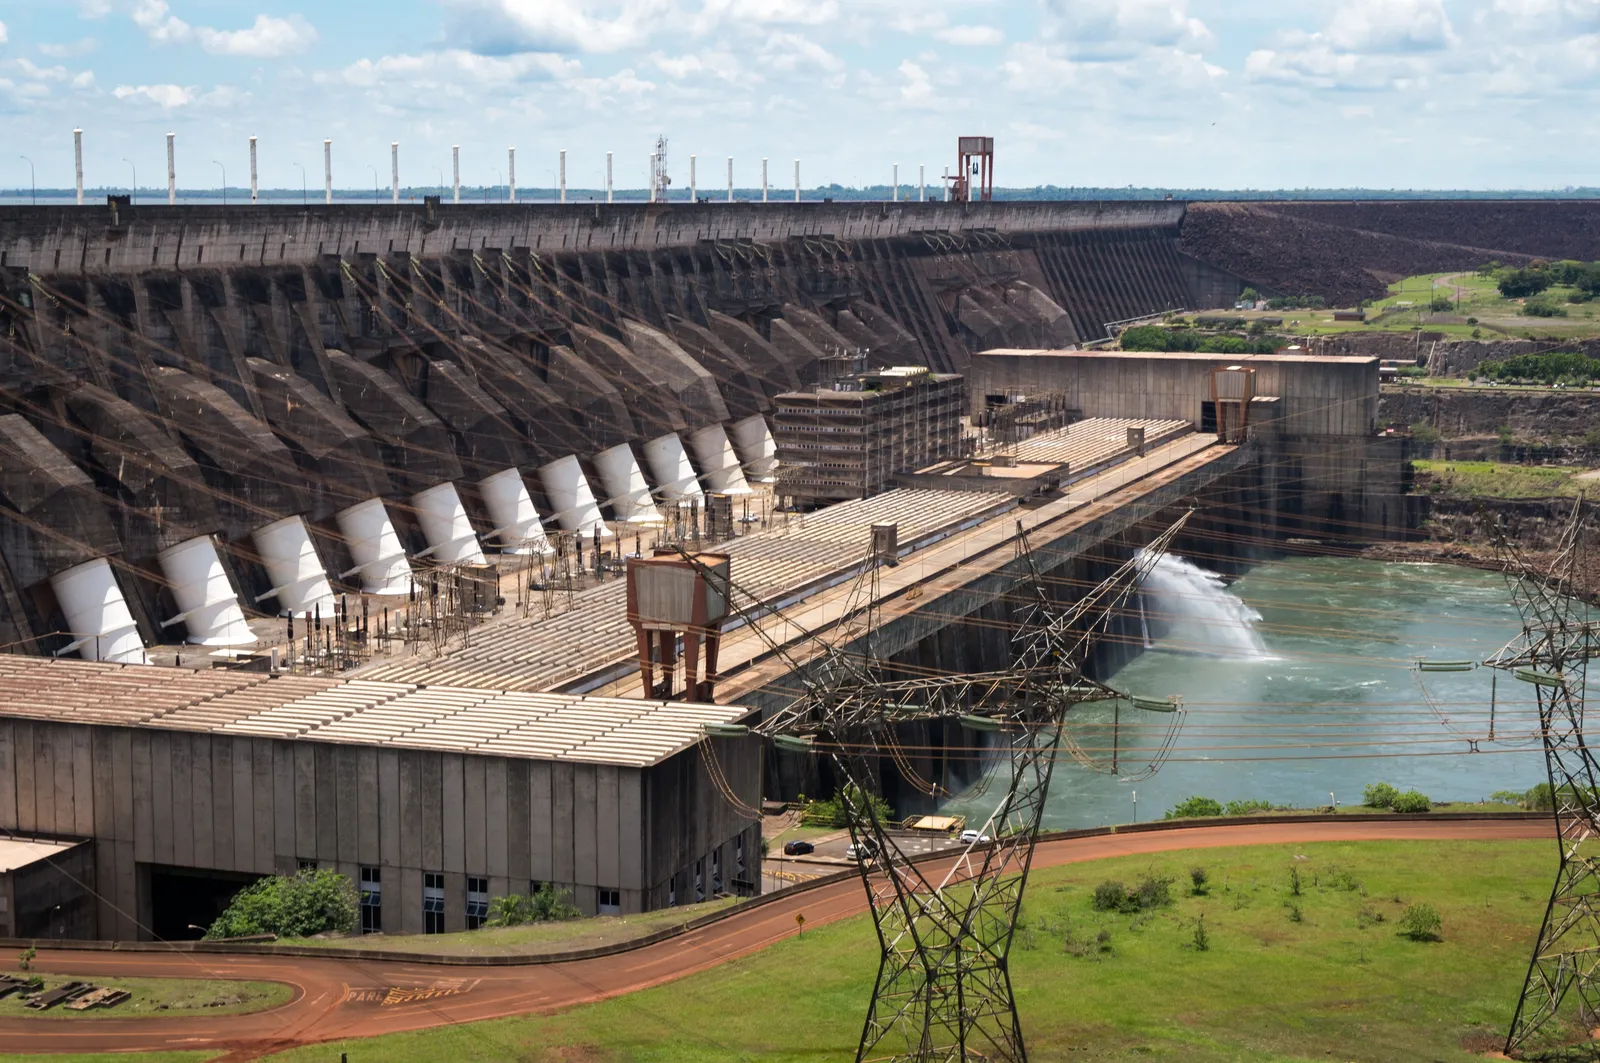
A big part of the explanation lies in Paraguay’s energy mix, which leans almost entirely on hydropower rather than fossil fuels, thanks to massive dams like Itaipú that the country shares with Brazil. With so little of its electricity coming from coal, oil, or gas, Paraguay avoids the emissions burden that weighs down many of its neighbors, even as its economy continues to grow.
2. Peru
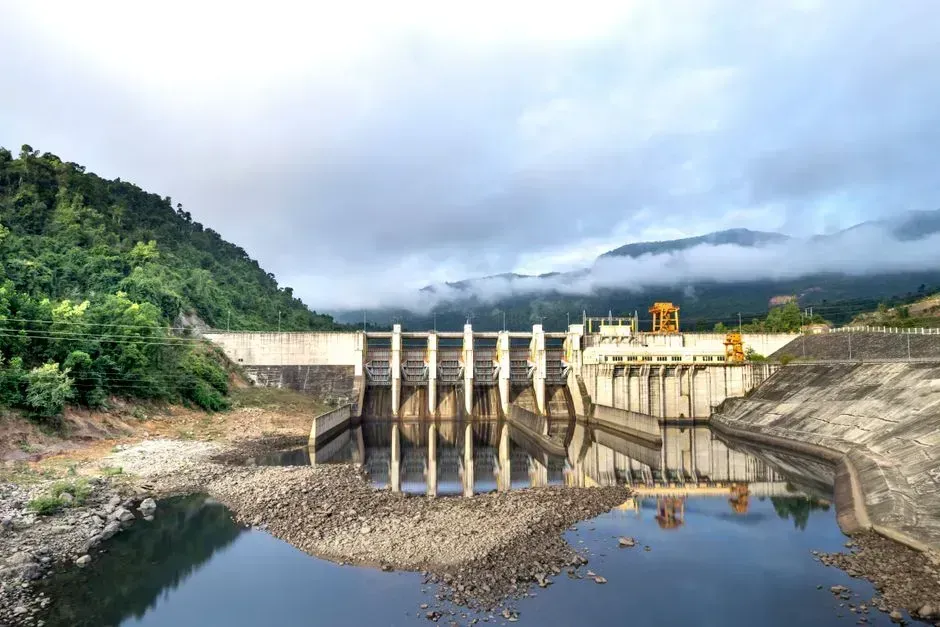
Peru ranks as the second lowest emitter per capita in the region. Regional data places Peru at 1.73 metric tons of carbon dioxide equivalent per capita, well below the South American average of roughly 2.8 tons. That keeps Peru firmly in the cleaner half of the continent’s emissions profile.
Peru’s relatively modest industrial footprint, combined with a significant share of hydroelectric generation in its power sector, helps explain the low reading. The country’s population is also spread across a wide range of income levels and regions, with large rural and Andean populations that consume far less energy per person than urban centers in more industrialized neighbors like Chile or Argentina.
3. Colombia

Colombia lands just behind Peru on the low end of the per capita scale. Colombia’s per capita figure comes in at 1.93 metric tons of carbon dioxide equivalent, still comfortably below the regional average despite being one of South America’s larger and more diversified economies.
Colombia benefits from a power grid that draws heavily on hydroelectric resources, which keeps electricity-related emissions in check even as the country’s population and economy expand. That said, other research notes that Colombia experiences an increase in emissions due to its energy structure, whereas a general trend towards decreasing emissions is noted elsewhere in the region, suggesting its low ranking today may not be guaranteed to hold in coming years without continued investment in clean power.
4. Bolivia

Bolivia rounds out the four lowest per capita emitters in South America. Bolivia’s per capita emissions sit at 1.94 metric tons of carbon dioxide equivalent, essentially tied with Colombia and well below wealthier, more industrialized neighbors such as Chile and Argentina.
Bolivia’s landlocked economy is smaller and less industrialized than most of its neighbors, which naturally limits energy demand from heavy manufacturing and large-scale transportation networks. Its natural gas reserves are significant, but domestic consumption remains modest relative to countries with bigger populations and more developed industrial and transportation sectors, which helps keep its emissions profile among the lowest on the continent.
The gap between these two groups is striking. A single U.S. state like Wyoming emits, per resident, dozens of times more carbon dioxide than an entire South American country like Paraguay. Some of that gap comes down to energy sources, since coal-heavy states simply cannot match the low-carbon hydropower that dominates much of South America’s grid. Population density, industrial makeup, and decades of infrastructure choices also play a huge role in shaping these numbers.
None of this means South American countries are free of climate challenges, since deforestation, agriculture, and land use changes create their own emissions pressures that don’t always show up in simple per capita energy statistics. Still, the contrast between coal-dependent U.S. states and hydropower-rich South American nations offers a useful reminder that a country’s or state’s energy mix, more than almost anything else, determines where it lands on the carbon footprint scale.

- The 6 Coldest Inhabited Places on Earth – Ranked by Average Winter Temperature - September 12, 2026
- 8 South American Climate Scientists Who Changed How We Understand the Amazon - September 12, 2026
- 6 Countries in the Americas Where Plastic Waste Per Person Is Highest - September 11, 2026
