

When a forecaster says tomorrow will be “five degrees above average,” the number has to be measured against something. That something is a climate normal, a long-term average for a specific place and time of year. It’s easy to miss, yet it frames nearly every weather headline about warm spells, cold snaps and soggy months.
The idea is simple, but the details matter. Which years count, who decides, and what does “normal” really tell us? Here’s how the baseline works and where it falls short.
What a Climate Normal Actually Is
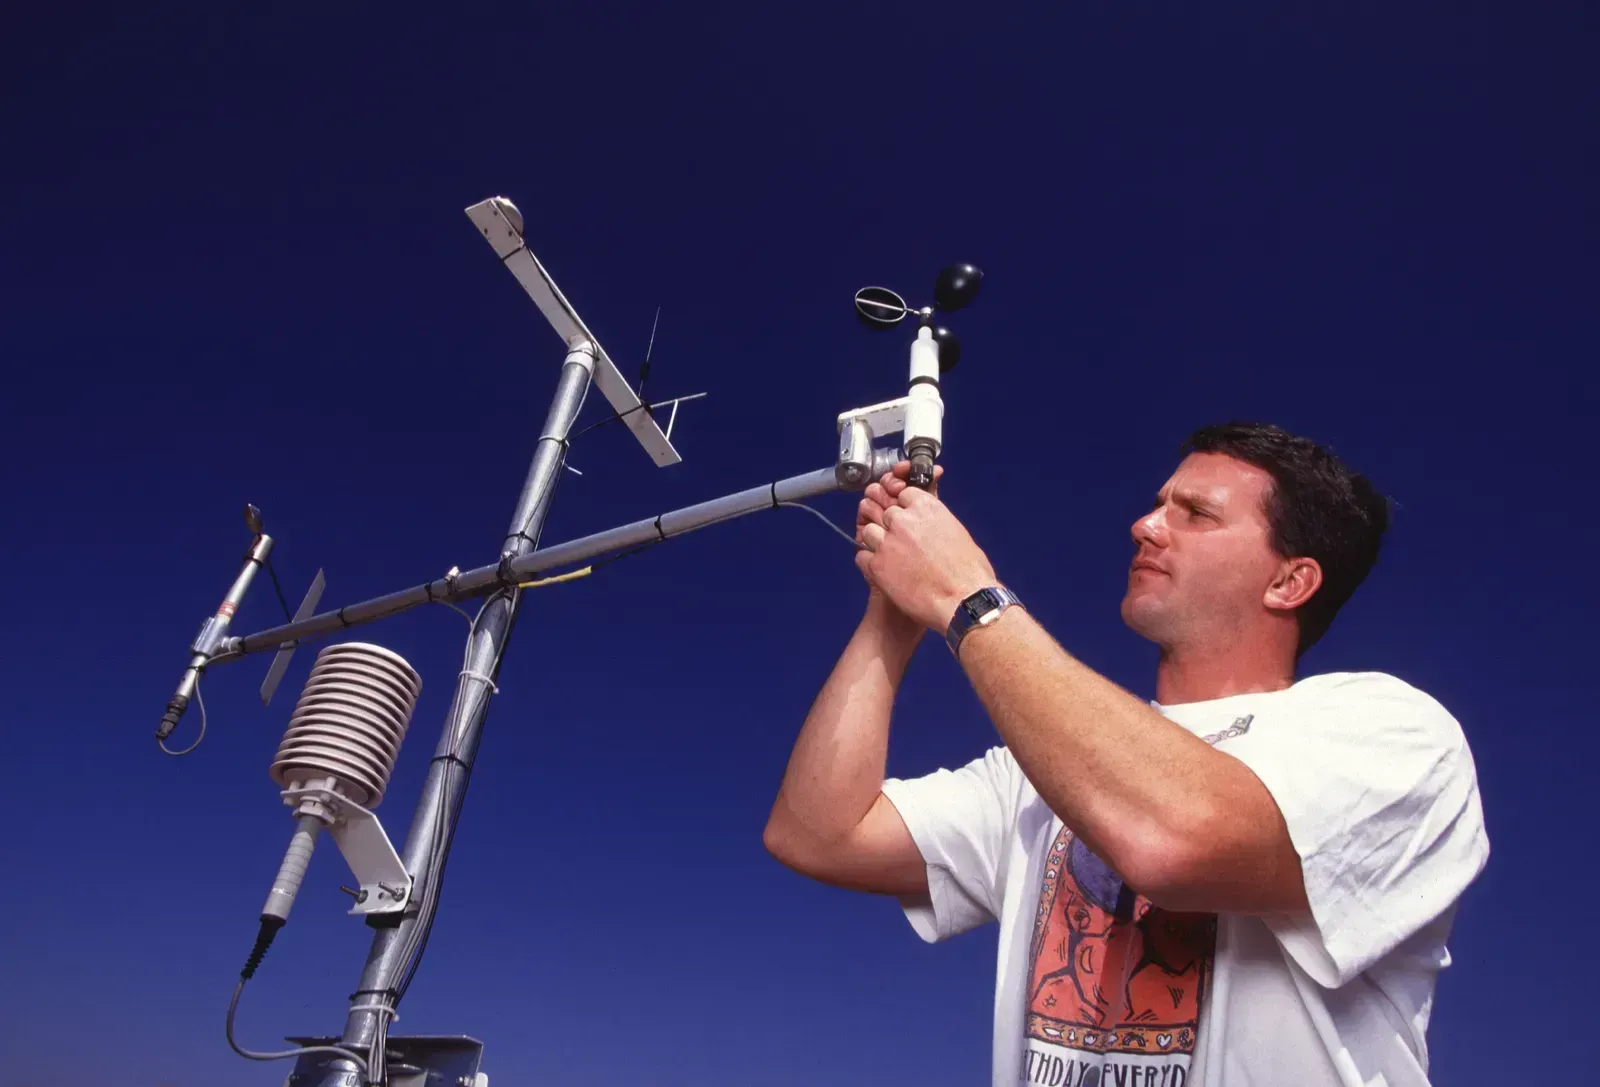
A climate normal is an average of a climate variable, such as temperature or rainfall, over a set period. NOAA describes the U.S. Normals as 30-year averages of key climate observations made at weather stations and corrected for bad or missing values and station changes over time. So the figure isn’t a raw tally. It’s a cleaned dataset.
The word “normal” can mislead. It doesn’t mean expected, ideal or unchanging. It’s a reference point, a way to say whether a given day, month or season sits above or below the recent typical pattern for that location.
Why Thirty Years?

The 30-year window is an international standard. The WMO defines climatological standard normals as averages computed for consecutive 30-year periods, such as 1981 to 2010 and 1991 to 2020. The length is a compromise. It’s long enough to smooth out year-to-year swings like El Niño and La Niña, yet short enough to stay relevant.
Shorter windows can be dominated by an unusual run of warm or cold years. Much longer ones would anchor the baseline in a climate that’s no longer quite the one people live in. Thirty years balances those pressures, though it’s a convention rather than a law of nature.
The Current Baseline: 1991 to 2020

Right now, the standard is the 1991 to 2020 period. The newest Climate Normals dataset for the United States, released in May 2021, spans 1991 to 2020. It replaced the 1981 to 2010 set that had served for the previous decade.
Globally, the WMO backed the same shift. Its Services Commission recommended that the 1991 to 2020 baseline be adopted worldwide. NCEI later published the Climatological Standard Normals for 1991 to 2020 on the WMO’s behalf, in a September 2023 notice. That means a “normal” in one country is calculated on the same footing as in another.
How Often the Reference Period Moves

The window slides forward every ten years. NCEI updates the Normals every 10 years in line with the WMO, which mandates the 30-year averages and recommends a decadal update. Each refresh drops the oldest decade and adds the newest one.
Don’t expect a new set soon. NOAA says it will update the Normals again in 2031. Until then, 1991 to 2020 remains the yardstick, even as 2024, 2025 and 2026 weather gets compared against it.
What Changed Between the Old and New Normals

The shift from 1981 to 2010 to 1991 to 2020 wasn’t uniform. NOAA’s preliminary analysis found the new Normals generally warmer in most seasons and regions of the United States, but not everywhere. The North Central region, for instance, came out somewhat cooler, especially in late winter and spring.
Precipitation moved too. Rainfall normals rose sharply in the Southeast and North Central U.S., while the Southwest has generally become drier. A local forecast can therefore be judged against a noticeably different bar than a decade earlier.
Normals Are Not a Forecast
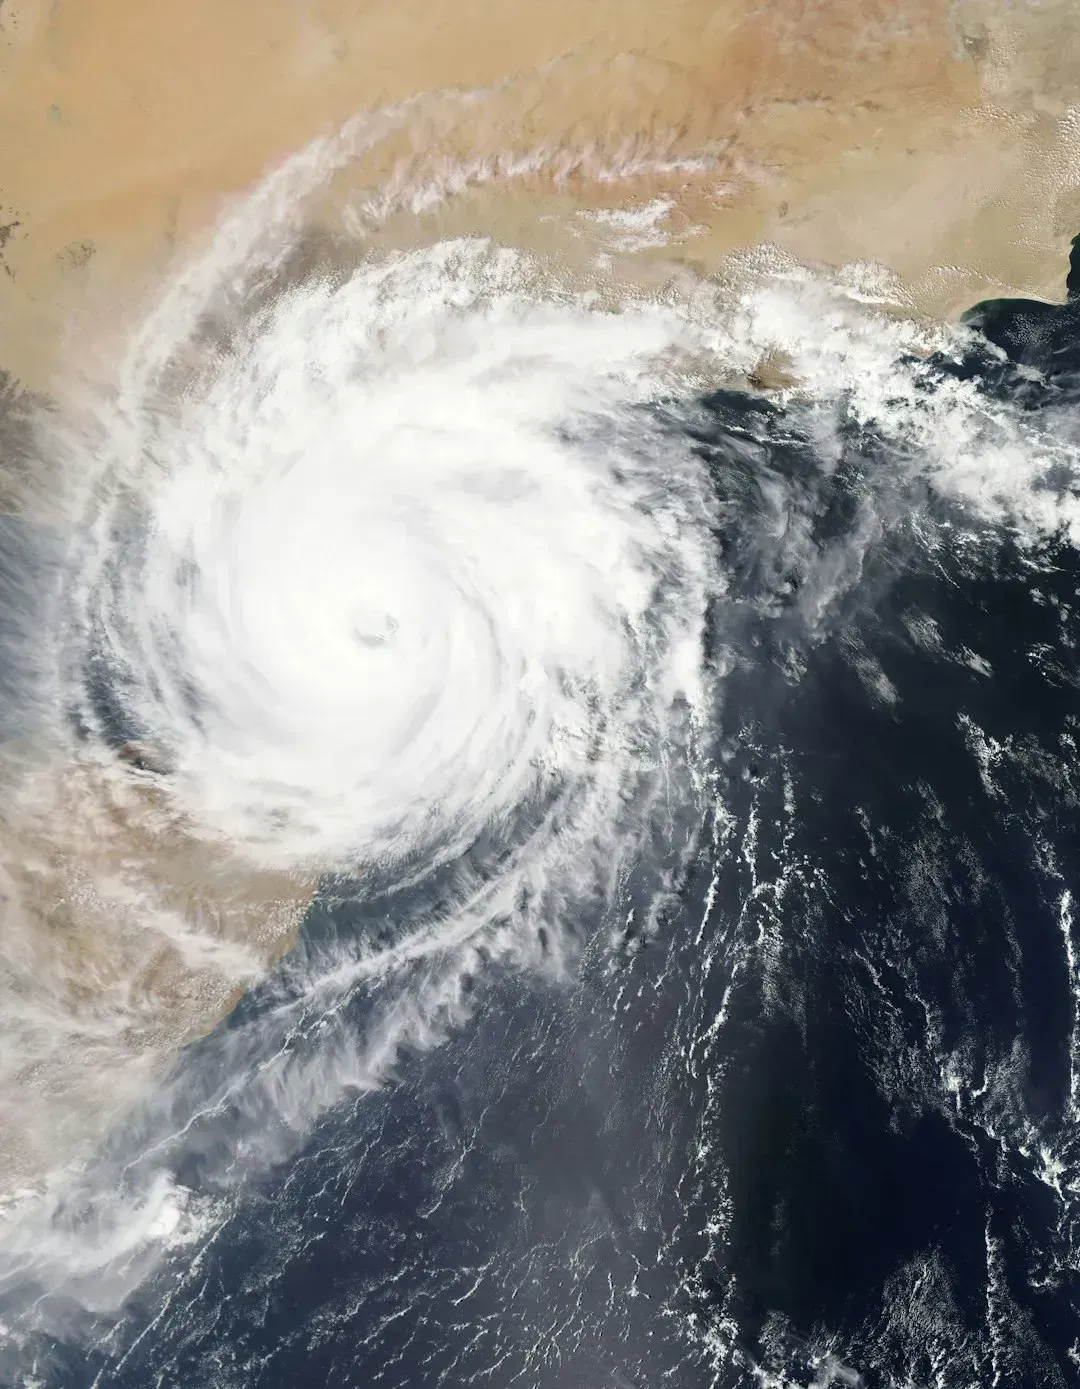
An average describes the middle of a spread, not the edges. A January normal of 38°F doesn’t prevent a day at 15°F or one at 55°F. Normals smooth out weather noise, and they don’t predict what next July will do.
That’s why “above average” is so common. Weather varies around the mean all the time, so roughly half of days in a stable climate would land on each side. When a place runs above its normal far more often than below it, that pattern says something more interesting about the climate itself.
A Moving Target in a Warming World
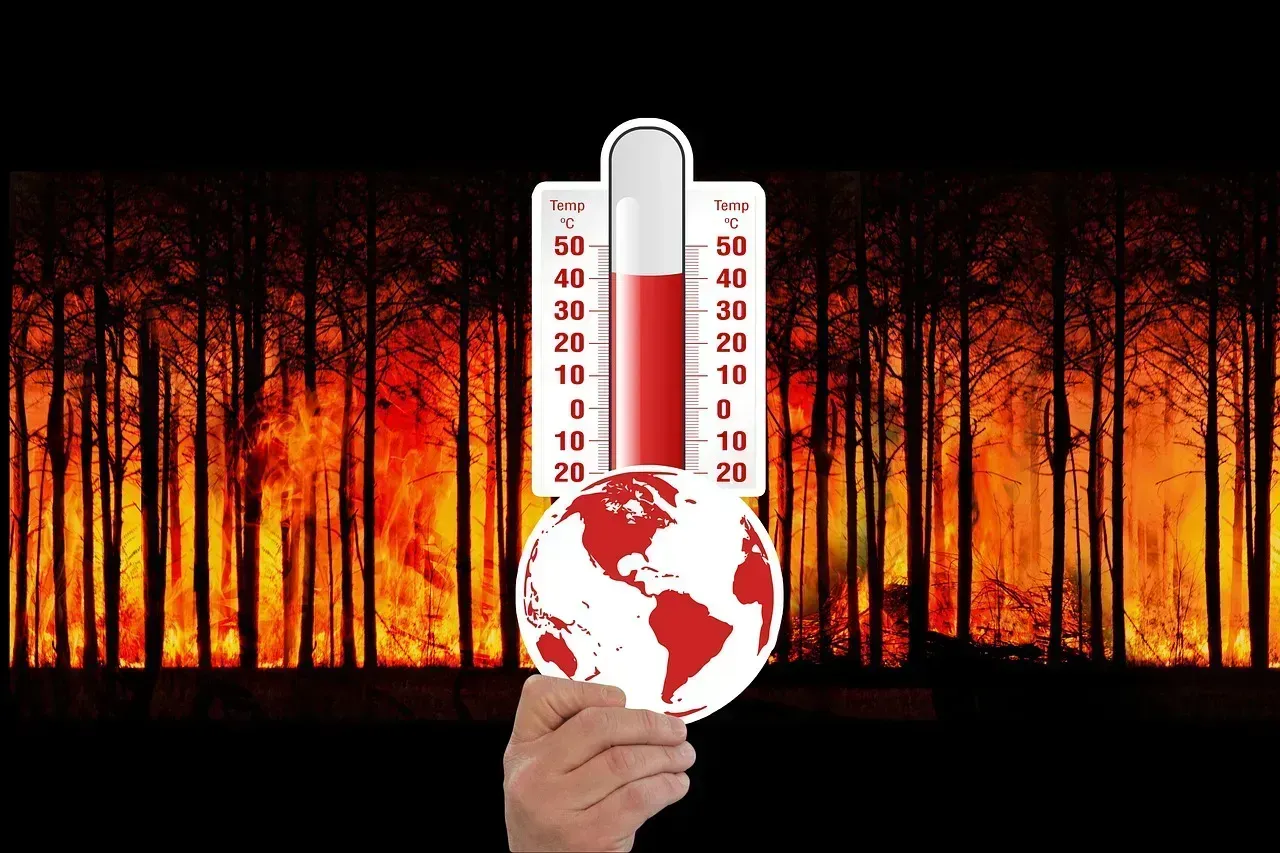
Because the window rolls forward, the baseline gradually absorbs warming. The once-per-decade update means these products come to reflect the “new normal” of climate change caused by global warming. A day that counts as warm against 1961 to 1990 may look merely typical against 1991 to 2020.
NOAA is open about the intent. The purpose of the Normals is to provide context on what climate is like today, not how it’s changing over time. It’s a design choice, and it explains why the same temperature can be called above average in one report and ordinary in another.
Which Baseline for Which Question
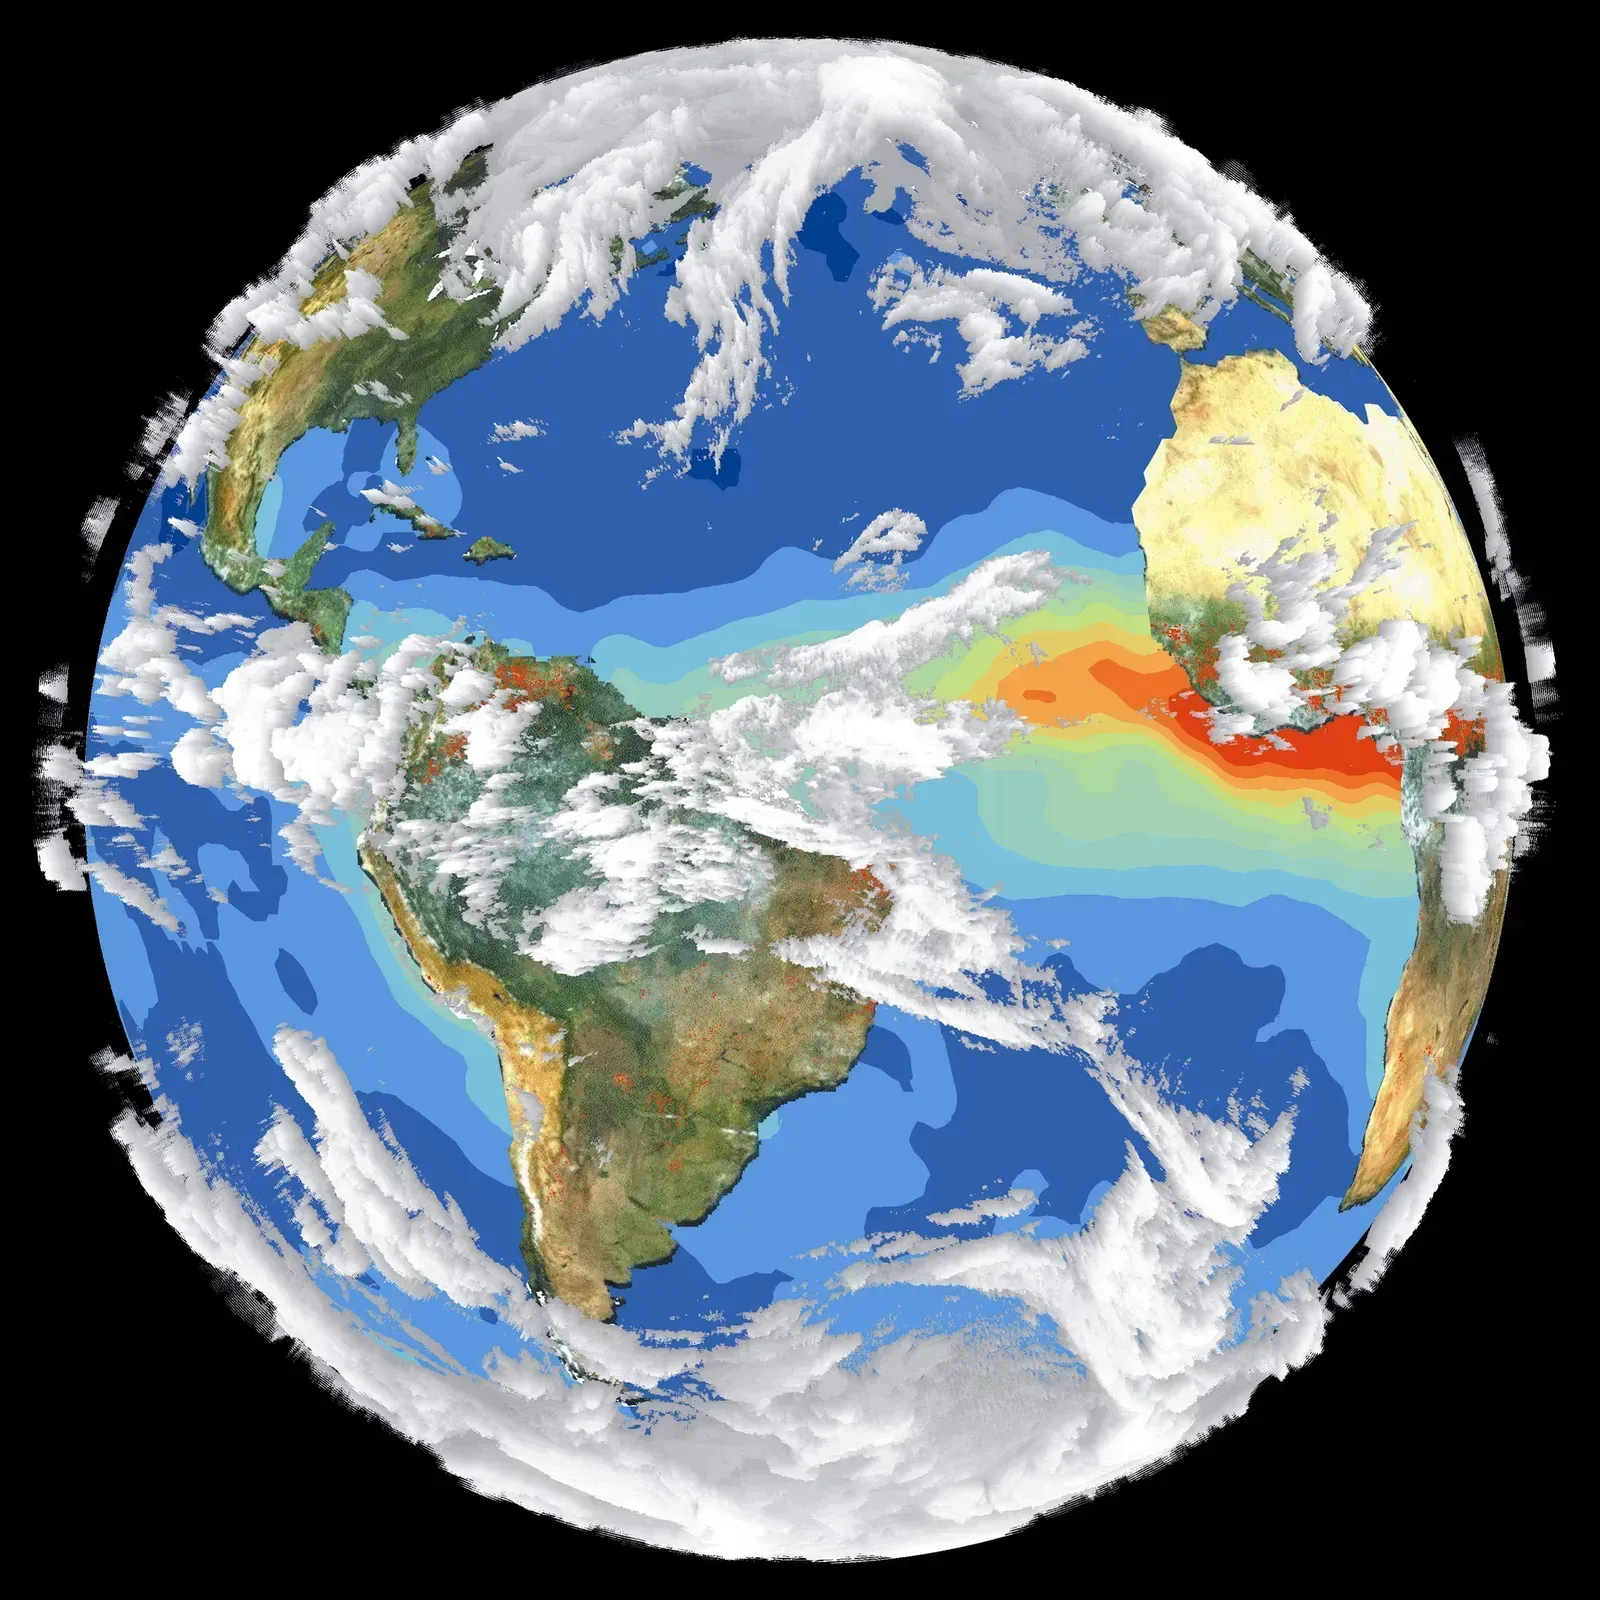
For long-term climate change assessment, scientists often use a different reference. The WMO has kept 1961 to 1990 as a standard reference period for long-term climate change assessments. Global warming targets use another: the WMO uses the pre-industrial era as the baseline for tracking global temperature increase for the Paris Agreement.
So check the baseline whenever you see an anomaly. A chart showing “+1.2°C” and a forecast saying “3°F above normal” aren’t measuring against the same thing. Everyday users, from farmers to utilities, mostly want the recent baseline. NOAA notes the Normals feed into agriculture decisions, electricity load planning, building heating calculations and construction scheduling.
Conclusion
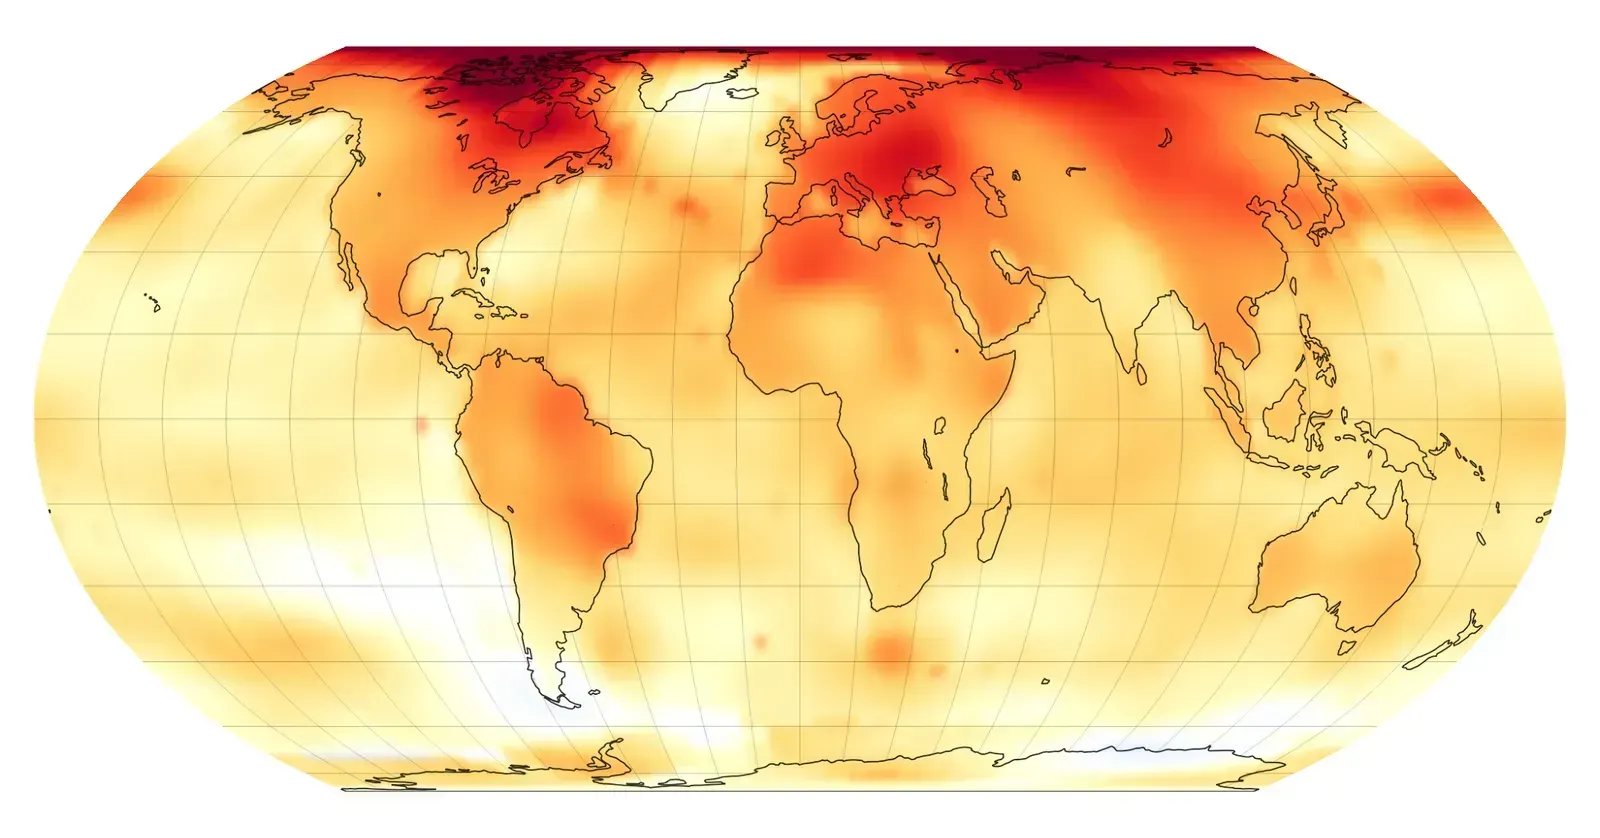
“Above average” is shorthand for a comparison with a 30-year record, currently 1991 to 2020, refreshed each decade and standardized worldwide. The number is only as meaningful as the baseline behind it, and the baseline itself quietly shifts as the climate does.
Next time a forecast calls a day unusually warm or wet, ask what it’s being compared with. The answer says as much about the climate as it does about the weather.

- 9 Wildfire-Season Routines Many California Residents Follow - November 10, 2026
- Most US states face earthquake risk as major fault lines span the country - November 10, 2026
- The Joplin Tornado of 2011 Killed 158 People and Led to New Warning Language - November 10, 2026
