

- 10 Traditional Building Techniques From Hot Climates Architects Are Revisiting - November 10, 2026
- 2026 Atlantic hurricane season winding down? El Niño eases late-season storm threat - November 10, 2026
- Could the Great Pacific Garbage Patch be altering the ocean’s color? - November 10, 2026
Every forecast you check on your phone is the end of a long chain. It starts with instruments in space, in the sky and on the ground, and it ends with supercomputers and human forecasters deciding what the numbers mean. No single tool does the job alone.
This article walks through that chain one step at a time. It covers what gets measured, how the measurements are turned into a starting picture of the atmosphere, and how models carry that picture forward in time.
It Starts With Observations of the Whole Atmosphere
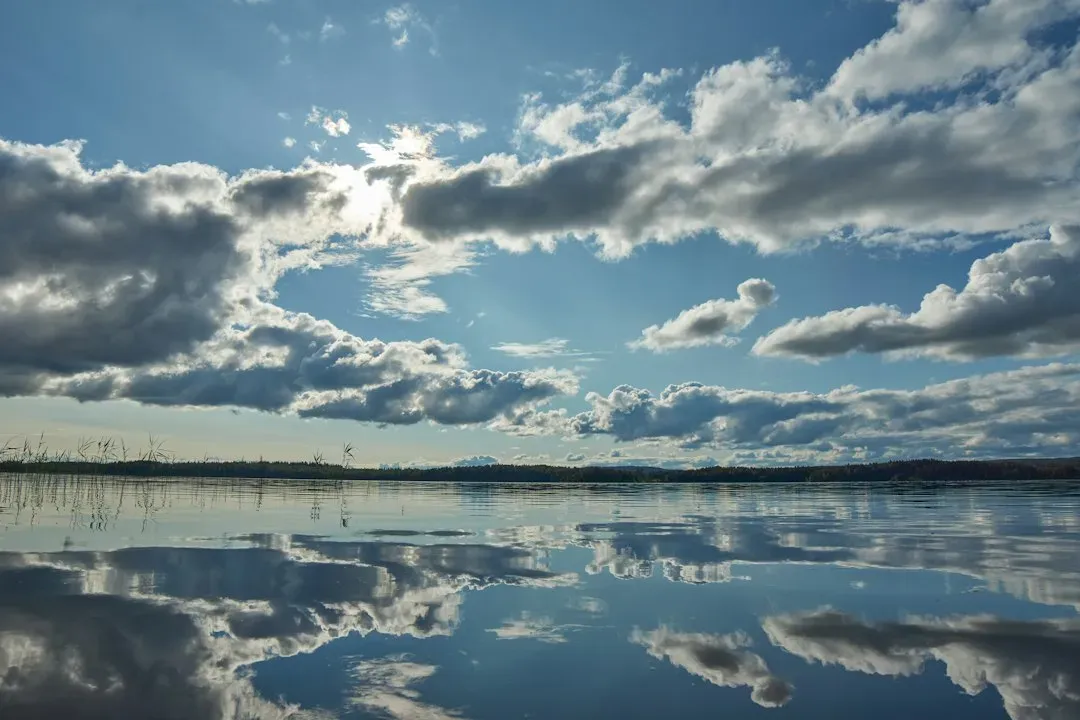
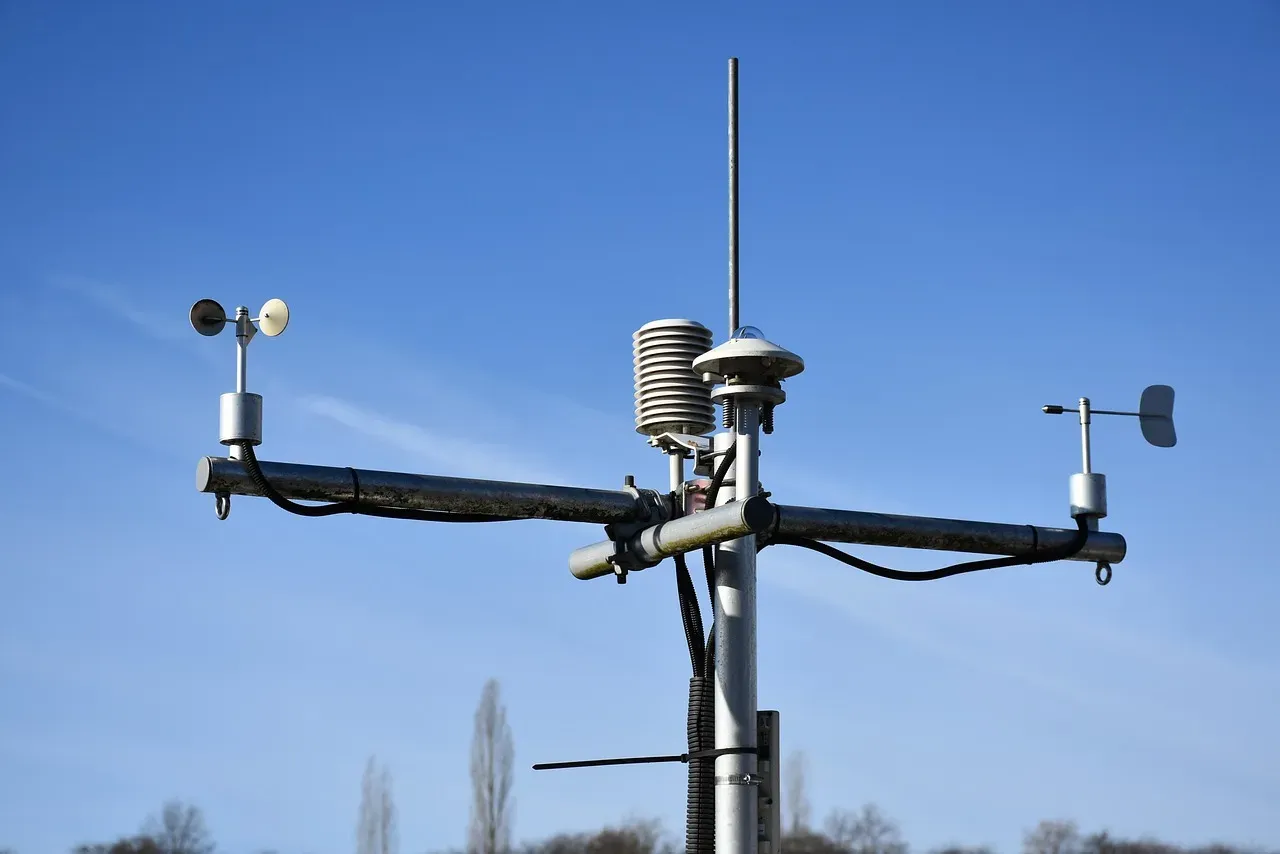
A forecast is only as good as its starting point, so meteorologists collect measurements from as many places as they can. Those sources include satellites, weather balloons, ground stations, ships, aircraft, buoys and radar. NOAA’s ocean and atmosphere researchers put it plainly: observations of the atmosphere are critical to every aspect of weather forecasting.
Each source covers a gap that the others can’t. Satellites see broad areas, including oceans and remote regions. Balloons measure the vertical structure of the air, and surface stations record what people actually feel at ground level.
What Satellites Add From Above
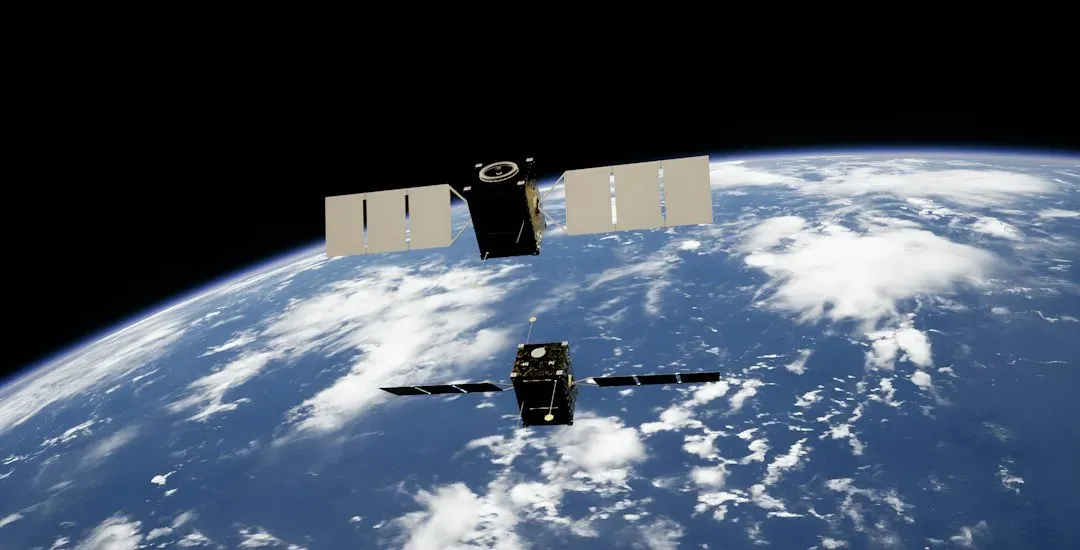
Satellites give forecasters a continuous view of clouds, moisture, temperature and storms across the planet. Geostationary satellites stay over one spot on the equator and watch the same region constantly. Polar-orbiting satellites circle the Earth from pole to pole and scan the whole globe as it rotates beneath them.
Their instruments measure radiation at many wavelengths, and that radiation carries information about temperature and water vapor at different altitudes. This is indirect sensing, so the raw data has to be converted into atmospheric values before models can use it. It’s especially valuable over the oceans, where few other instruments exist.
Why Weather Balloons Still Matter
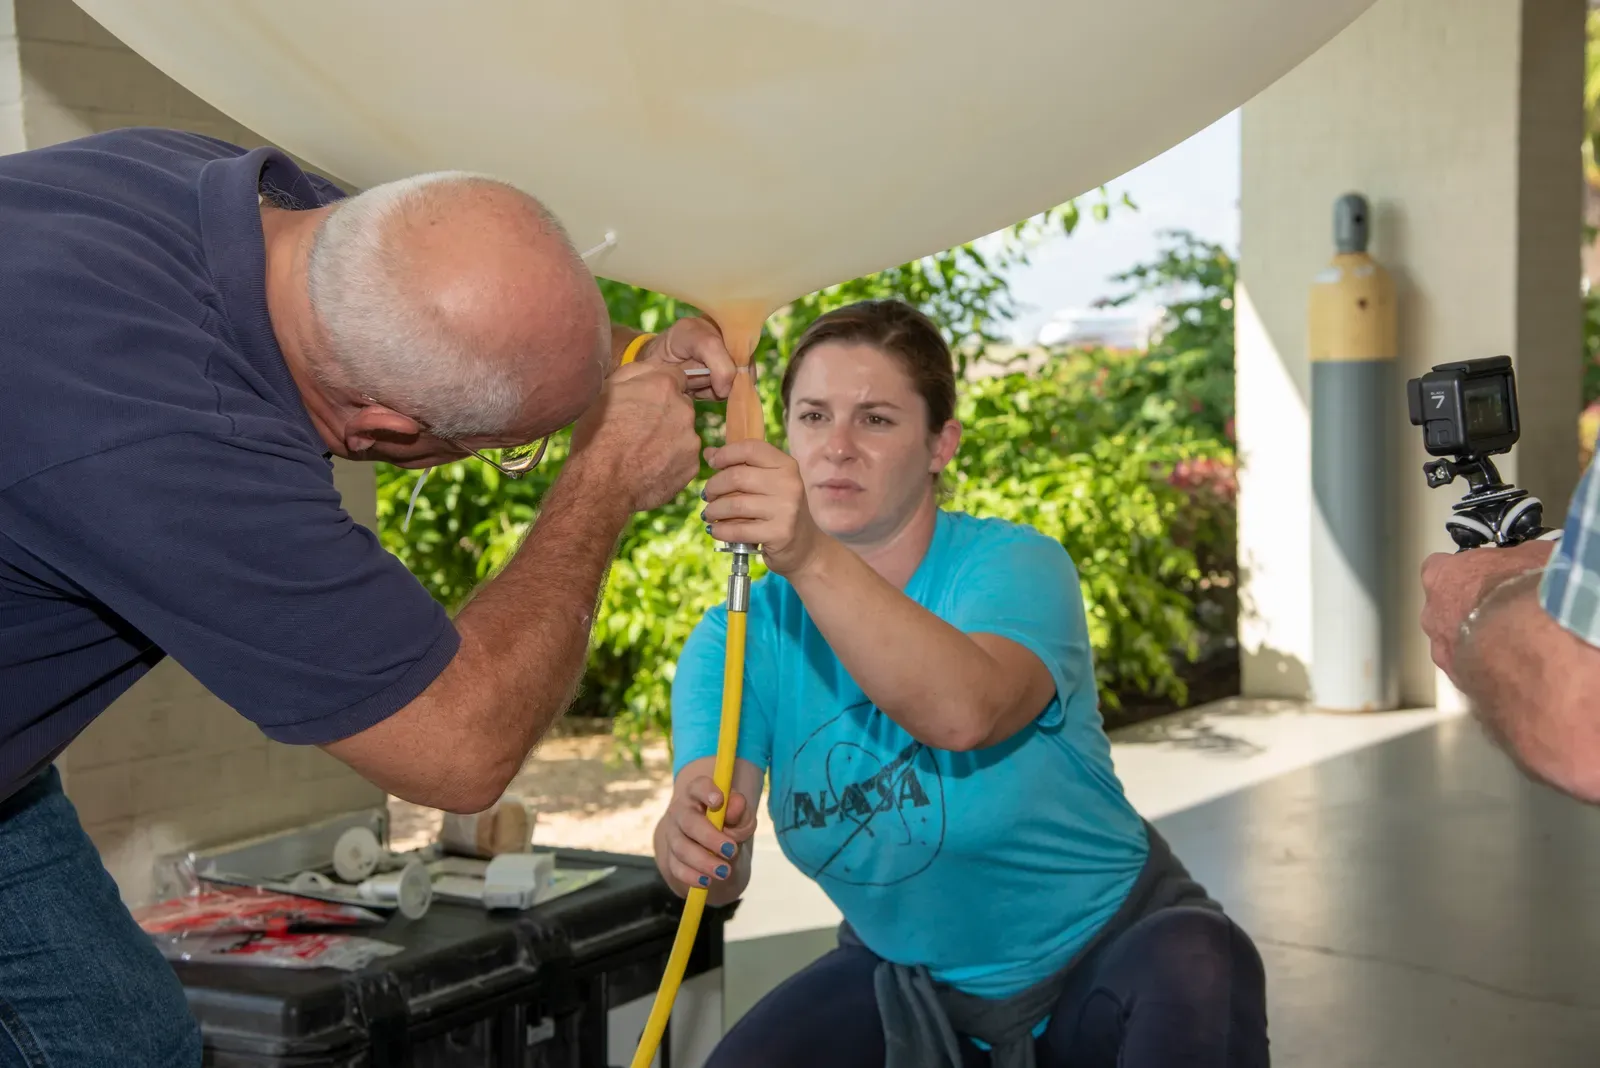
Weather balloons may seem old fashioned, yet NOAA’s Atlantic Oceanographic and Meteorological Laboratory says they are one of the longest running and most dependable tools meteorologists use. In the U.S. they are released twice a day, every day of the year, and sometimes more often during extreme weather.
The package hanging under the balloon is called a radiosonde. As the balloon rises, its sensors measure temperature, pressure and relative humidity, and a radio transmitter sends the readings to a ground receiver. GPS tracking also gives the wind speed and direction.
A Worldwide Network on a Shared Schedule
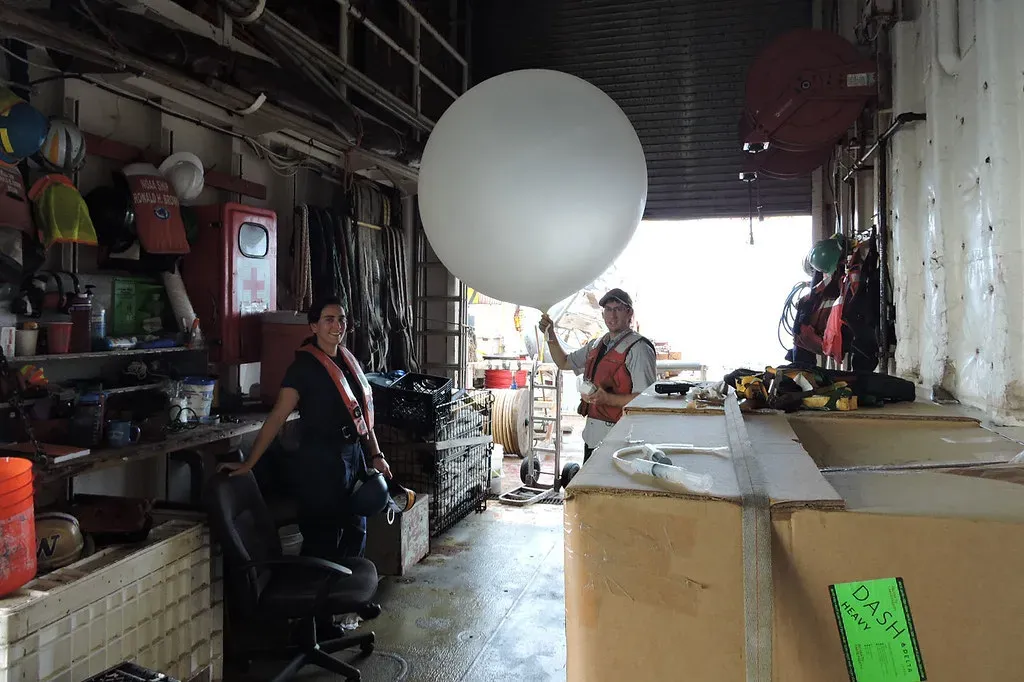
Balloon launches are coordinated so that readings from different countries describe the same moment. The National Weather Service and weather services around the world launch radiosondes simultaneously to form a measurement grid of the upper atmosphere, typically twice daily at twelve-hour intervals. That shared timing is what makes the data usable in a global model.
One research paper describes the radiosonde program as the largest source of high-resolution in-situ atmospheric measurements. The same paper notes that the instruments typically measure from the surface up to more than 25 km. That vertical detail is something satellites alone still can’t fully match.
Data Assimilation Blends Everything Into One Picture
Raw observations are scattered, uneven and imperfect, so they can’t be dropped straight into a model. They go through a process called data assimilation. NOAA explains that the information is fed into weather models through data assimilation, or initialization, to provide the initial conditions for forecasts.
In practice, the process compares new observations with a recent short forecast and adjusts the model’s picture of the atmosphere to fit. This also helps catch bad readings. NOAA says the global and hurricane models used by National Hurricane Center specialists are initialized every 6 hours, so the starting picture is refreshed several times a day.
How Physics-Based Computer Models Work
Traditional numerical weather prediction divides the atmosphere into a three-dimensional grid. It then solves equations for motion, heat, moisture and pressure to step the grid forward in time. The calculations are enormous, which is why national weather agencies run them on some of the world’s most powerful supercomputers.
Different centers run different models. NOAA’s Global Forecast System and the European Centre for Medium-Range Weather Forecasts (ECMWF) system are two widely used examples. Because each uses its own methods and data handling, forecasters often compare several of them rather than trusting just one.
The Rise of Machine-Learned Forecast Models
A newer approach uses artificial intelligence trained on decades of past weather. ECMWF’s version is called the AIFS. Its developers describe it as one that learns from archived weather data to predict the next atmospheric state, then feeds its predictions back in to make a longer forecast.
This is no longer just an experiment. After a pre-operational test phase running four times daily since October 2023, the AIFS moved to operational status. The first operational version arrived on 25 February 2025, and version 1.1.0, released on 27 August 2025, corrected a precipitation issue in the initial version. These systems still lean on physics-based work, since they mostly depend on ERA5 reanalysis data and ECMWF’s physics-based operational analysis for training and forecasting.
Forecasters Turn Model Output Into Useful Advice
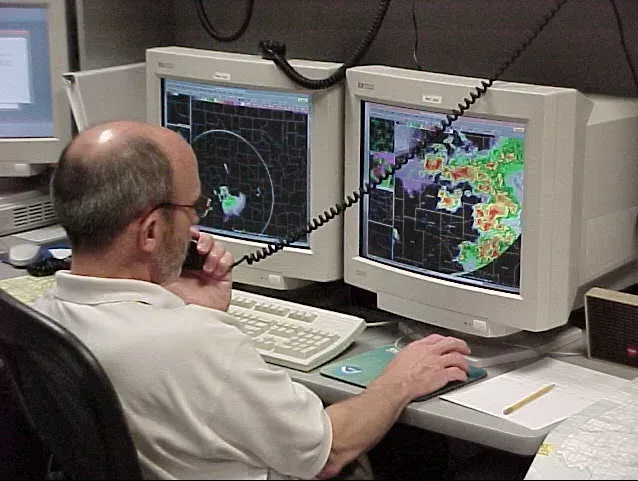
Models produce numbers, not decisions. Human forecasters examine the output, check it against the latest satellite and radar views, and consider where models tend to be biased. They then translate the result into warnings and plain language, such as the chance of rain or the likely track of a storm.
Agreement between models raises confidence, and disagreement signals uncertainty. That’s why many forecasts are given as probabilities rather than certainties. Accuracy generally falls as the forecast period stretches further out, because small errors in the starting picture grow over time.
