
Every time a colorful blob slides across a map on your phone, a spinning dish somewhere is sending out pulses of microwave energy and listening for faint echoes. That simple loop of send and listen underlies much of modern short-term forecasting and severe weather warning. It’s also why a radar image can tell you far more than whether you need an umbrella.
This article looks at how radar sees precipitation, how it separates rain from snow and hail, and how it detects rotation inside a storm. It also covers where radar falls short, because knowing the limits matters as much as reading the colors.
How a Radar Beam Finds Raindrops
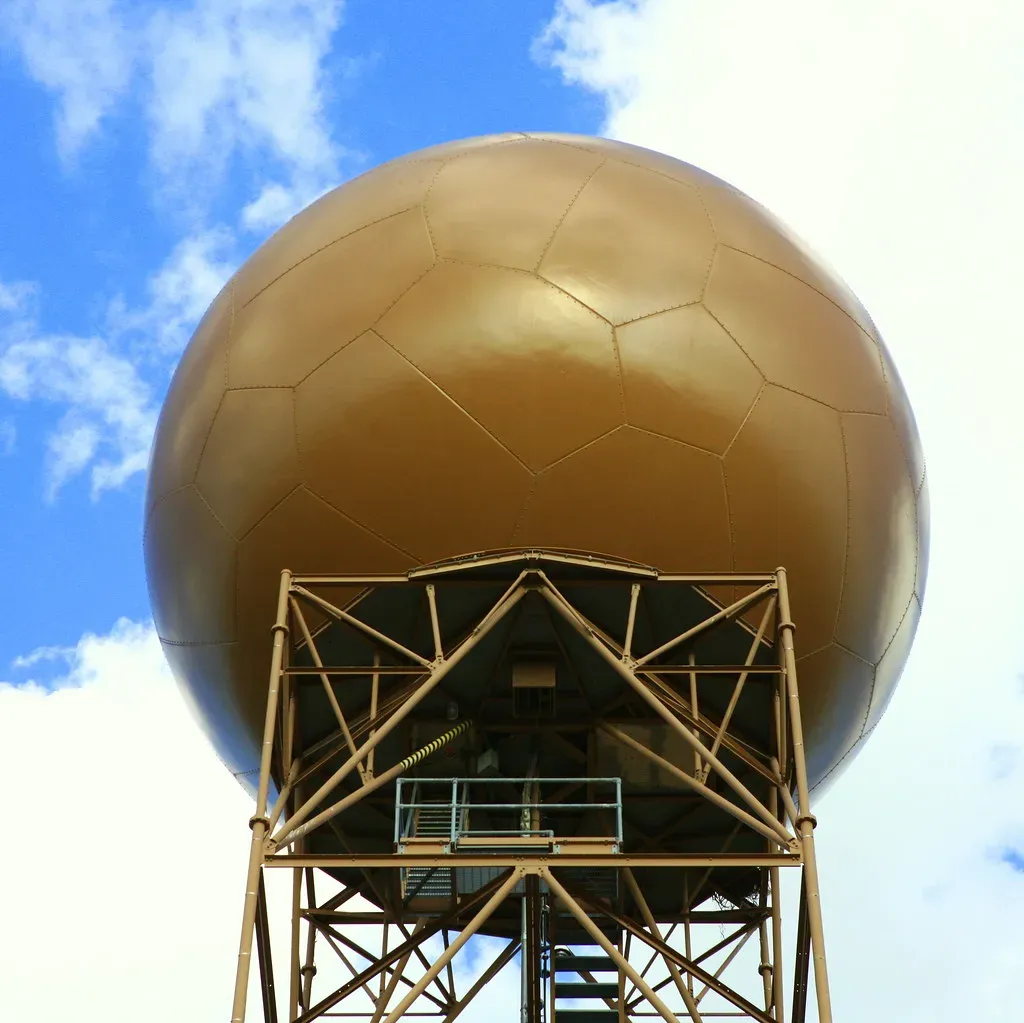
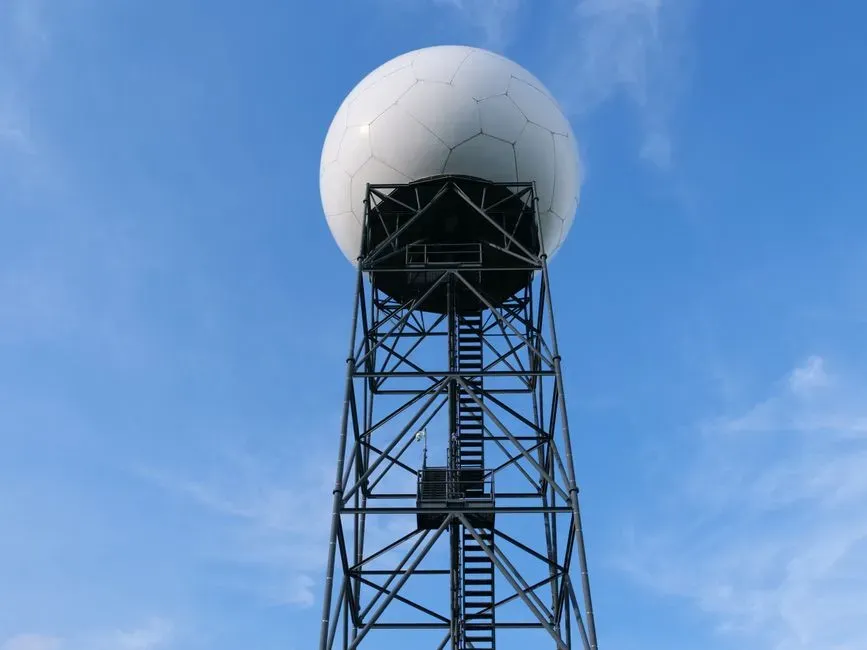
A weather radar transmits a short pulse of radio energy and then waits. When the pulse hits raindrops, snowflakes, or hailstones, a tiny fraction of that energy scatters back to the dish. The time between sending the pulse and receiving the echo gives the distance, and the dish’s pointing direction gives the bearing.
The strength of the returned signal is called reflectivity, measured in dBZ. According to the National Weather Service, the U.S. network of WSR-88D radars, known as NEXRAD, operates at wavelengths of roughly 10 centimeters (S-band). That wavelength suffers little weakening in heavy rain, which is one reason the U.S. network has used it for decades.
Reading the Colors on a Reflectivity Map
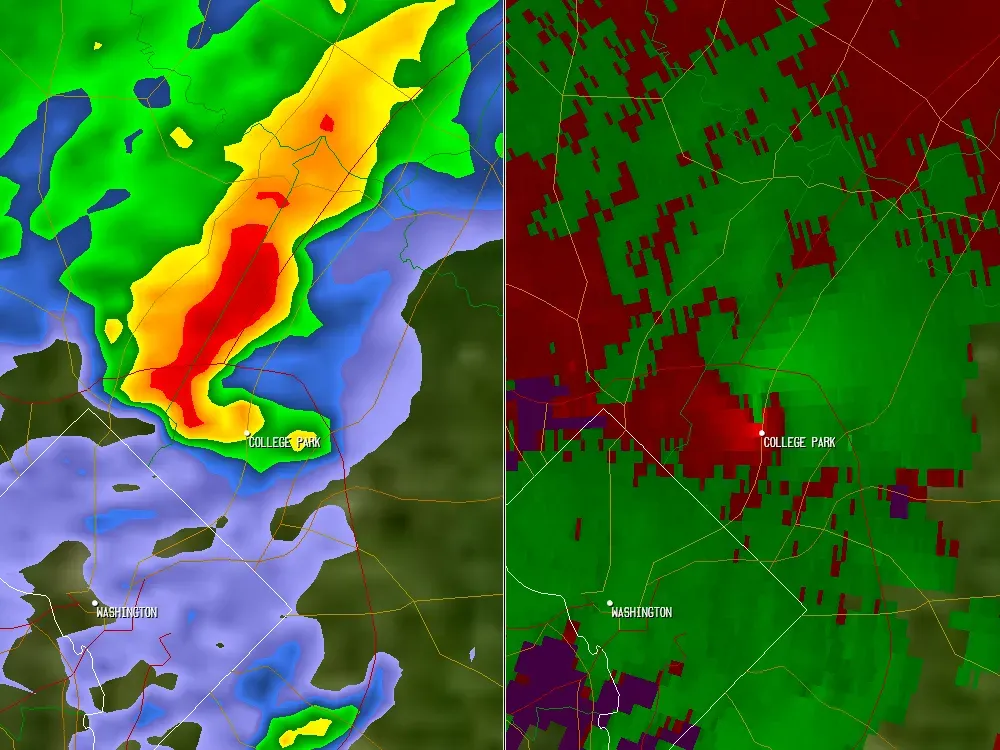
On a standard reflectivity map, cool colors such as greens usually mean light to moderate precipitation. Yellows and oranges suggest heavier rain, and reds and magentas point to very intense echoes. Values around 20 dBZ typically indicate light rain, while 40 to 50 dBZ often means heavy rain. Readings above roughly 55 to 60 dBZ can signal hail, though the numbers alone don’t prove it.
Color scales also vary between apps and websites. The same echo can look mild on one platform and alarming on another. When you want to compare storms, check the legend first, since the dBZ value is the real information.
Why Doppler Velocity Matters
The Doppler effect lets radar measure motion toward or away from the dish. A tiny shift in the returning signal’s frequency reveals whether raindrops are drifting closer or moving off. Forecasters see this as a velocity display, typically with greens for motion toward the radar and reds for motion away.
The key limitation is that radar measures only the component of motion along its beam. Winds blowing across the beam look weak even when they’re strong. Meteorologists compensate by studying the pattern across the whole display, not any single pixel.
Dual Polarization: Telling Rain, Hail, and Snow Apart
Older radars sent out only horizontally polarized pulses. The NWS finished upgrading its NEXRAD fleet to dual polarization in 2013, so the radars now transmit both horizontal and vertical pulses. Comparing the two reveals the shape and size of what’s in the air. Large raindrops flatten as they fall, while tumbling hail and irregular snowflakes return different signatures.
One of the most useful products is correlation coefficient, which shows how uniform the targets are. Rain gives high values, while a mix of debris, hail, or melting snow can drop it noticeably. This helps forecasters spot the melting layer, filter out non-weather echoes such as birds and insects, and confirm hail cores.
Tracking Snow and Winter Mixes
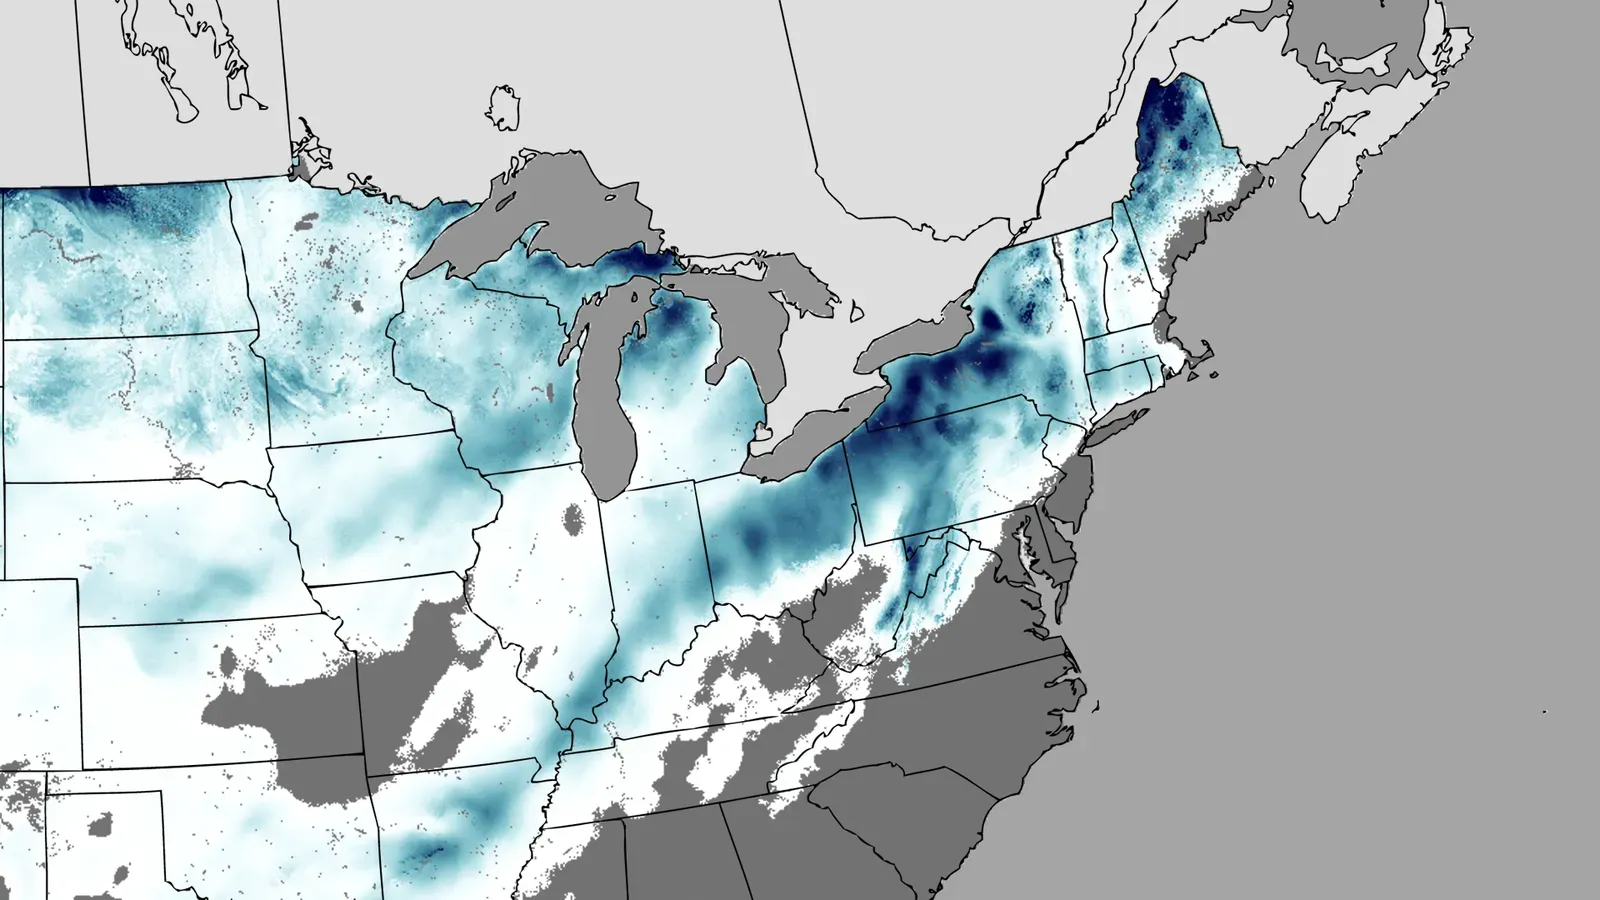
Snow is harder for radar than rain. Snowflakes are mostly air and ice, so they reflect less energy, and reflectivity values in snow are usually lower than in rain of similar intensity. A light-looking echo can still mean steady accumulation, especially in a wide, organized system.
Radar can also show where rain is changing to snow. As flakes melt, they become coated in water and briefly reflect more strongly, which creates a ring or band called the bright band. Dual polarization sharpens that picture. Still, radar can’t tell you what’s happening at the surface, so surface observations and spotter reports remain essential for rain, sleet, and freezing rain boundaries.
Spotting Rotation in Severe Storms
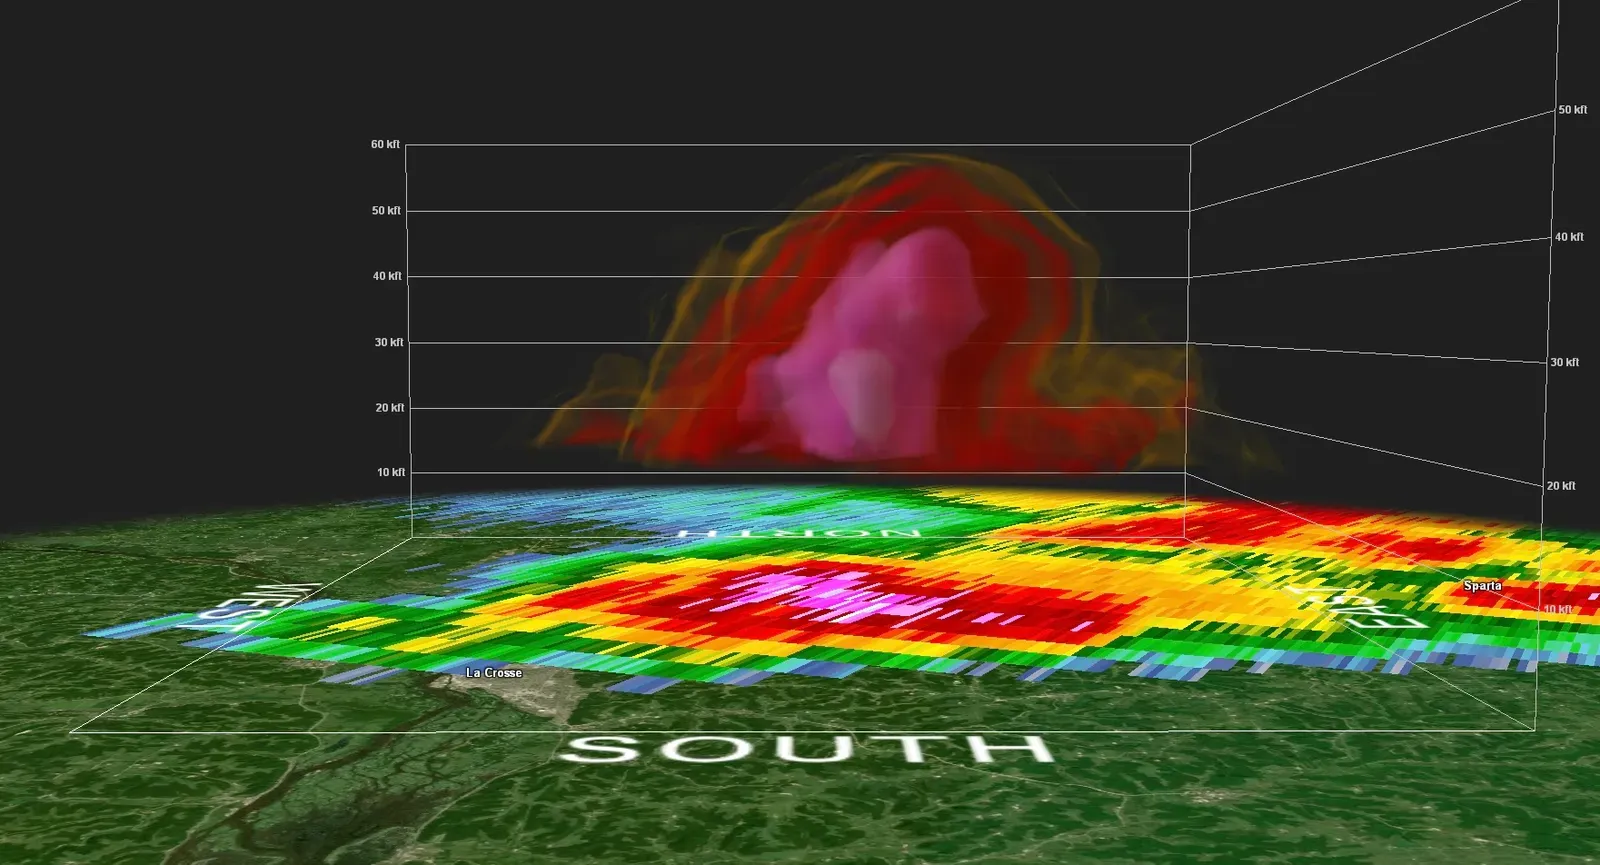
Radar doesn’t see a tornado directly in most cases. It sees the parent storm’s rotation. Forecasters look for a tight pairing of inbound and outbound winds side by side on the velocity display, called a velocity couplet. A hook shape on the reflectivity image, known as a hook echo, can also hint at a rotating supercell.
A strong, persistent couplet near the ground often prompts a tornado warning. In some cases, radar also detects a tornado debris signature. This appears as a small area of low correlation coefficient where lofted debris mixes with rain. It’s strong evidence that a tornado is on the ground and damaging something.
Scan Strategy, Beam Height, and Blind Spots
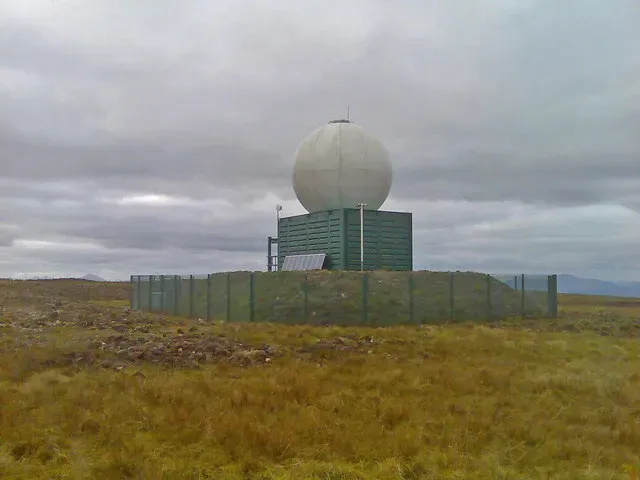
NEXRAD radars scan at a series of tilt angles. Each full volume scan takes only a few minutes, and during severe weather the system uses faster patterns to refresh the data more often. Even so, a storm can change quickly between scans, and the NWS notes this is one reason tornado warning lead times vary so much.
Geometry causes the biggest problems. The Earth curves away beneath the beam, so far from a radar the lowest scan may overshoot shallow rain, light snow, or low-level rotation. Mountains can block the beam outright, and there’s a small cone of silence directly above each site. For this reason, radar coverage is uneven, and a clean map doesn’t always mean clear skies.
Where Radar Technology Is Heading
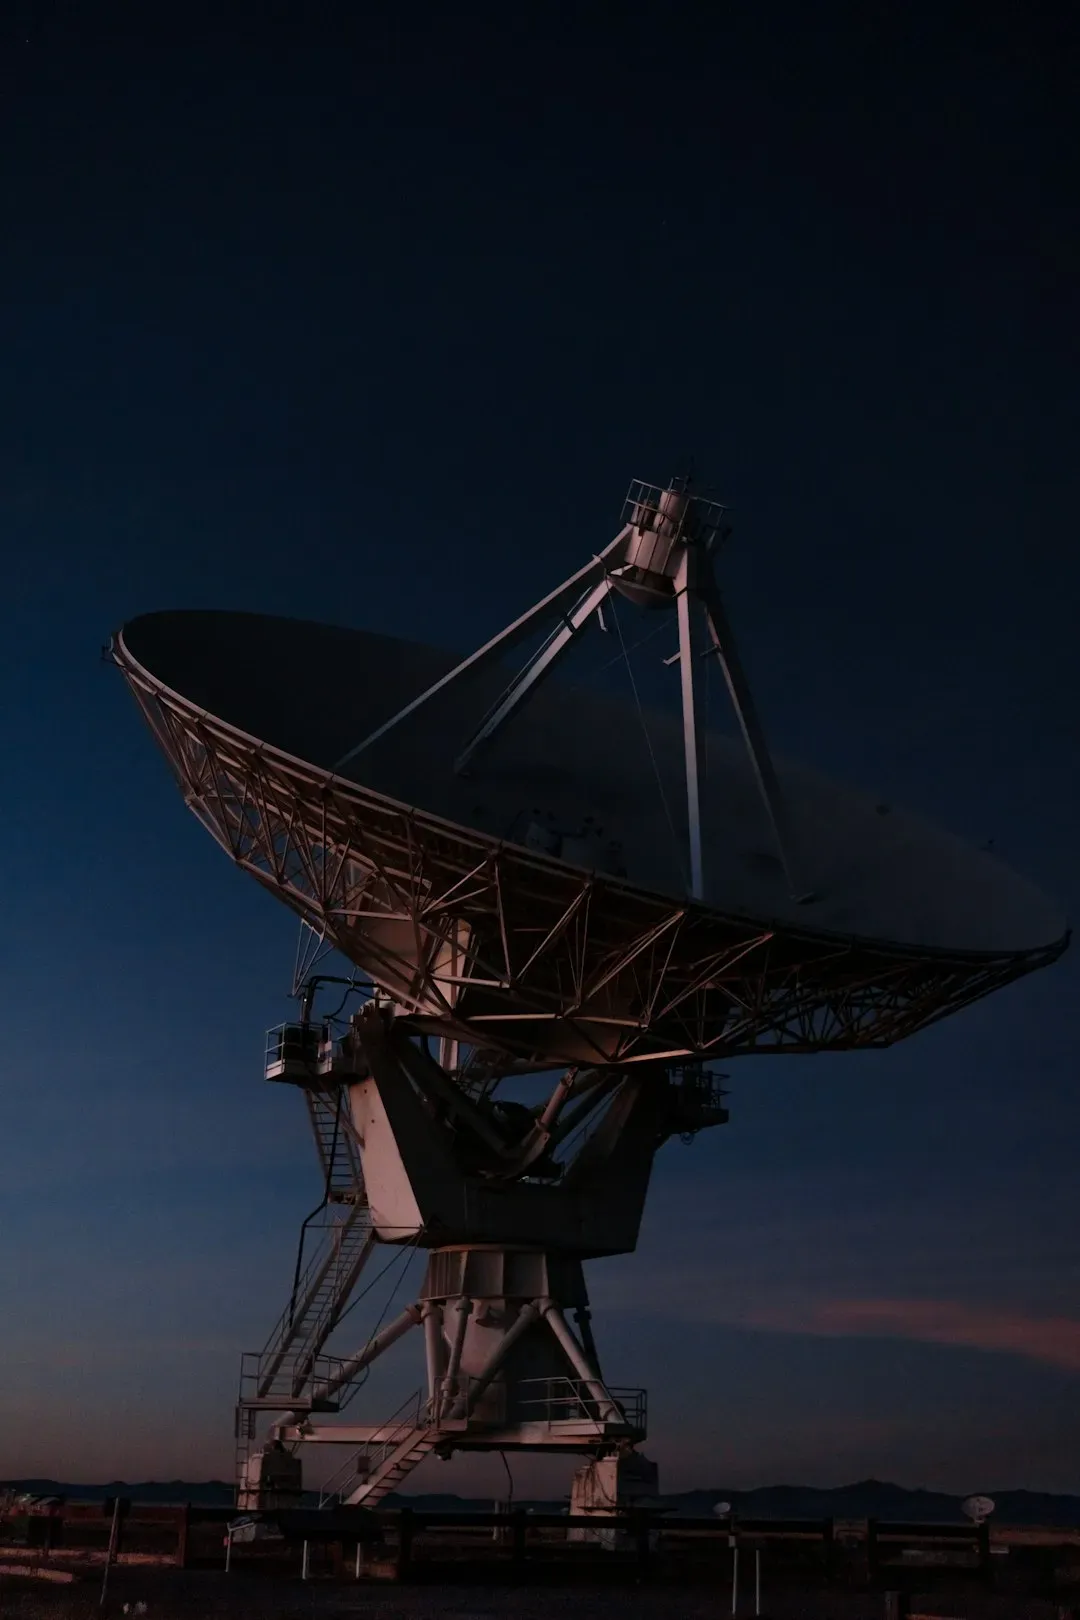
The NEXRAD network is decades old, though it’s been kept current through hardware and software upgrades. Research groups, including NOAA’s National Severe Storms Laboratory, have tested phased array radar, which can scan with electronic beams instead of a rotating dish. In principle, that allows much faster updates on rapidly evolving storms. Whether and when such systems will replace the current network is a policy and funding question, so any timeline should be treated cautiously.
Meanwhile, forecasters increasingly blend radar with satellite, lightning, and surface data. Computer models and products that merge multiple radars into one picture help fill gaps between sites. Radar remains the central tool, but it works best as part of a larger system.
Conclusion
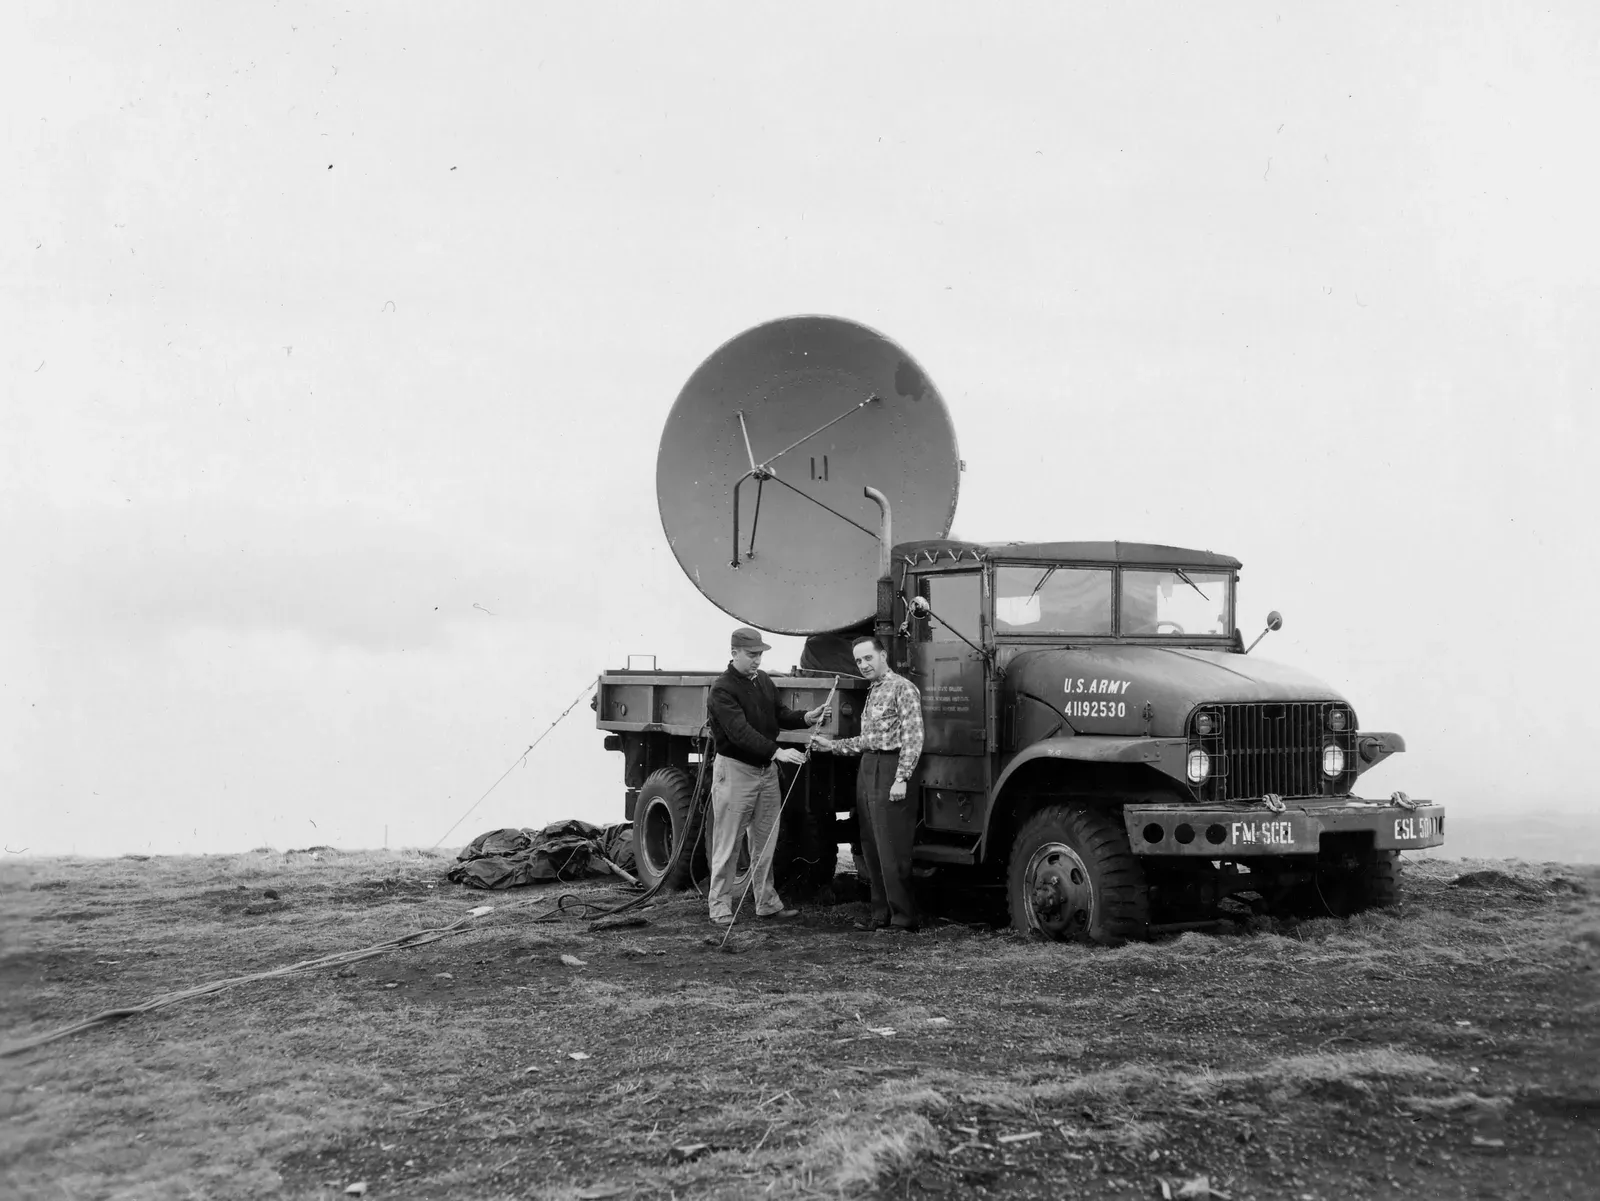
Weather radar turns scattered echoes into usable information about rain intensity, snow, hail, and rotation. Reflectivity shows where precipitation is, Doppler velocity shows how it moves, and dual polarization reveals what it is. Each layer has limits, from beam overshoot to snow’s weak return, so the best readings come from trained eyes and supporting data.
The next time a warning pops up on your phone, remember that the dish behind it is making a careful measurement, not a guess. Treat the warning seriously, and you’ll be putting that measurement to good use.

- 9 Wildfire-Season Routines Many California Residents Follow - November 10, 2026
- Most US states face earthquake risk as major fault lines span the country - November 10, 2026
- The Joplin Tornado of 2011 Killed 158 People and Led to New Warning Language - November 10, 2026
