

- The Planet Where It Rains Liquid Glass – 7 Alien Worlds Defying Known Physics - November 14, 2026
- Stars Consuming Entire Worlds – 6 Planetary Systems Swallowing Their Own Worlds - November 14, 2026
- The Ground Liquefies Like Water – 6 Silent Fault Lines Geologists Watch Closely - November 14, 2026
What a Heat Dome Actually Is
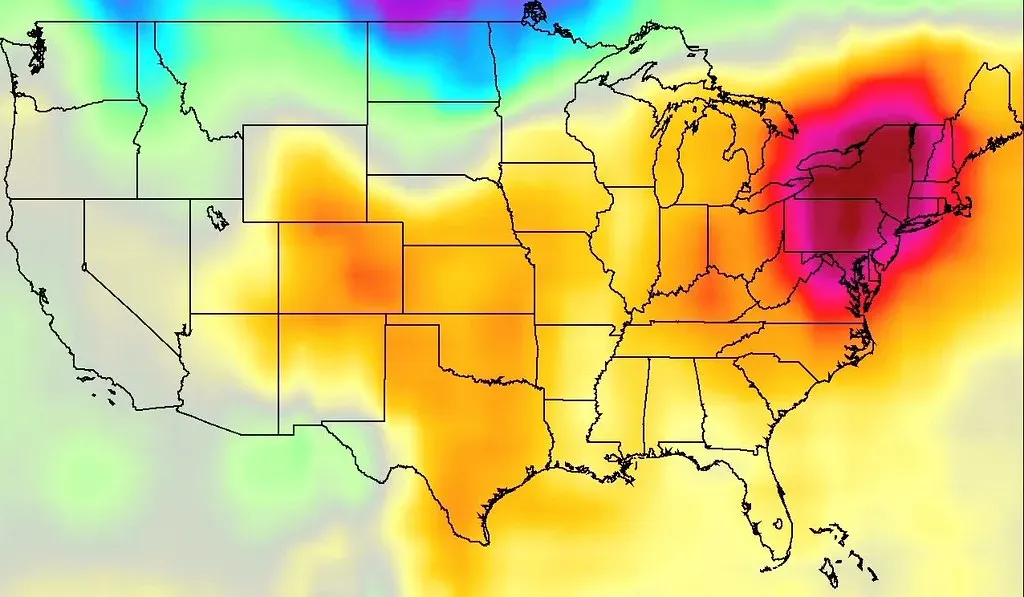
A heat dome is not simply another name for a heat wave, even though the terms often get mixed up in casual conversation. Heat domes happen when strong high pressure atmospheric conditions remain stationary for an unusual amount of time, preventing convection and precipitation and keeping hot air trapped within a region. That stationary quality is the key distinction from a garden variety hot spell.
The mechanism behind the heat is almost mechanical in its simplicity. High-pressure system means that the air is sinking, and as the air goes down to lower altitudes, it becomes compressed, so the pressure increases and the temperature also increases. Scientists sometimes describe this using the language of a lid, since a persistent ridge of high atmospheric pressure aloft creates subsidence that warms and dries the air, trapping heat near the surface like a lid over a region.
The Jet Stream’s Hidden Role

To understand why a heat dome forms where it does, you have to look far above the clouds, at the river of fast moving air that steers most of our weather. How long these heat domes stick around has a lot to do with the jet stream, a narrow band of strong winds in the upper atmosphere, about 30,000 feet above sea level, that moves from west to east due to the Earth’s rotation. Under normal conditions this current keeps weather systems moving briskly across a continent, which is exactly why most heat waves end after a few days.
The trouble starts when that river stops flowing in a straight line. The jet stream doesn’t flow in a straight line, it meanders north and south in patterns called Rossby waves. When these meanders grow unusually large, Rossby waves become extremely amplified, they can create deep troughs and steep ridges, and these exaggerated patterns slow down or even stall completely. A ridge that gets stuck in place is essentially the birth certificate of a heat dome.
Omega Blocks: The Most Stubborn Pattern

Meteorologists have a specific term for the atmospheric setup that produces the longest lasting, most dangerous heat domes. The most dangerous heat dome pattern is called an Omega block, and when viewed on weather maps, the jet stream configuration resembles the Greek letter Omega, with a strong high-pressure ridge sitting in the center, flanked by low-pressure troughs on either side. This shape is not just visually distinctive, it is functionally important to how long the heat lasts.
That flanking structure is what makes an omega block so hard to dislodge. This configuration is remarkably stable, since the surrounding low-pressure systems essentially lock the central high-pressure system in place. Instead of a heat wave lasting two or three days before a cold front pushes through, an omega block can pin the same hot, dry air over a region for a week or considerably longer, which is exactly what happened during the most infamous heat dome event of the last decade.
The 2021 Pacific Northwest Event That Changed the Conversation
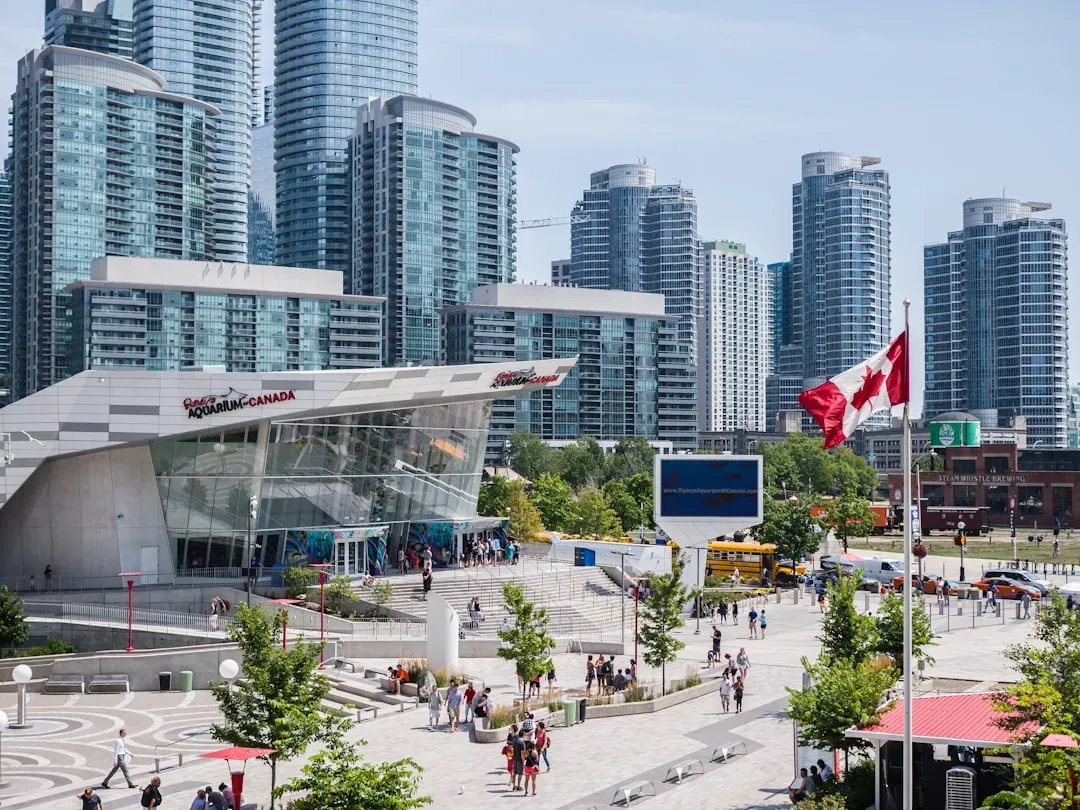
Few events did more to put the term heat dome into everyday vocabulary than what happened across British Columbia, Washington, and Oregon in late June 2021. Temperatures in the small town of Lytton, British Columbia reached a staggering peak that shocked climatologists worldwide. The Canadian national temperature record was broken 3 days in a row, at multiple locations, with the highest temperature of 49.6 °C recorded in Lytton, BC, on 29 June, 4.6 °C higher than the Canadian record prior to this event.
The human cost was severe and swift. The British Columbia Coroner’s Office confirmed 619 heat-related deaths during the most intense period of the heatwave, with significant heat-related fatalities also recorded during the same period in the states of Oregon and Washington. Researchers later determined just how far outside normal bounds this event fell, concluding it was estimated as a one-in-a-thousand-year event that would have been 150 times less likely without climate change.
Climate Change Is Loading the Dice

The Lytton disaster was not treated by scientists as a one-off anomaly but as a preview. Later analysis of that specific event quantified just how much warming had already stretched the extremes, finding that the event was 59% longer, 34% larger and had 6% higher maximum amplitude than the same event would have been without a warming climate. That kind of amplification is not confined to one region or one summer.
The pattern has repeated with almost predictable regularity in the years since. Climate change is making the conditions for heat domes happen more often, experts say, and more and more nations around the globe are being impacted. As one climate scientist put it when describing the broader shift in temperature distributions, warming the globe means shifting the range of temperatures that any given place experiences, and as you shift that range of temperature, you’re making the extreme temperatures much more likely.
An Arctic Connection Scientists Are Still Mapping
One of the more intriguing threads in current research involves the Arctic, which is warming far faster than the rest of the planet. The Arctic is warming twice to three times as fast as the rest of the planet, which has impacts on larger air and ocean systems at lower latitudes. The leading theory is that this uneven warming weakens the temperature contrast that powers the jet stream in the first place.
A weaker temperature gradient between the pole and the equator appears to translate into a wavier, more sluggish jet stream, though the science here remains an active area of study rather than settled fact. Researchers reviewing mid-latitude summer circulation noted that recent summers have seen strong reductions in sea-ice extent and snow cover, a weakened equator-to-pole thermal gradient and associated weakening of the mid-latitude circulation, prompting three leading hypotheses: weakened storm tracks, shifted jet streams, and amplified quasi-stationary waves. Climate physicist Michael Mann has pointed to related research showing an uptick in what scientists call planetary resonance events, telling reporters that Mann and his colleagues have shown an uptick in the frequency of such stuck jet stream patterns, known as planetary resonance events, in recent decades, and that trend coincides with increased global warming.
Europe’s Escalating Pattern in 2025 and 2026
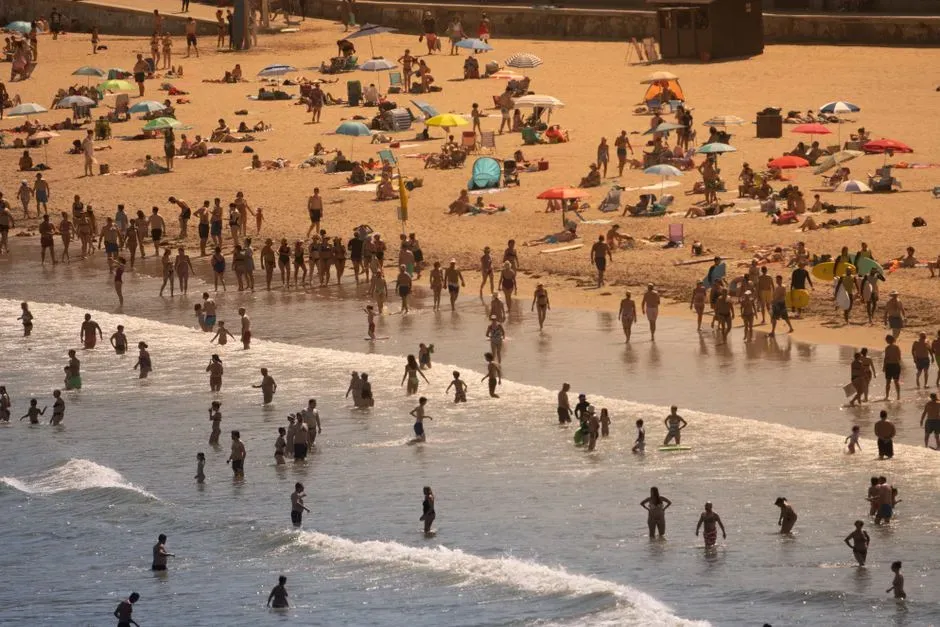
What was once considered a mostly North American or Russian phenomenon has become a defining feature of European summers. The 2025 heat season was already severe, but attribution scientists went further with the 2026 event, describing conditions that would have been almost impossible in an earlier climate. The 2025 European heatwave has been attributed to a heat dome, and human-caused climate change is likely a contributing factor.
The 2026 season pushed records even further, arriving unusually early in the year. Since late May 2026, Europe has been struck by severe heatwaves, with temperature records broken in Austria, Belgium, Czechia, Denmark, France, Germany, Hungary, Italy, the Netherlands, Poland, Romania, Spain, and the United Kingdom. Mortality estimates from the most recent wave remain provisional, but researchers have suggested figures in the tens of thousands, since the team estimated that in the 2026 heat wave the excess mortality may be between 17,000 and 25,000, though the estimates may change.
An Out of Season Warning From the American Southwest

Perhaps the most unsettling development of early 2026 was not the intensity of a heat dome but its timing. A flash attribution study examined an extraordinary March heat event in Arizona and the wider Southwest, concluding that events as warm as in March 2026 would have been virtually impossible without human-induced climate change. The added warming attributable to fossil fuel emissions was substantial, with researchers finding that that warming, from the burning of coal, oil and natural gas, added between 2.6 to 4 degrees Celsius to the temperatures being felt.
Report co-author Clair Barnes framed the implications bluntly for a region already accustomed to summer extremes. She explained that what we can very confidently say is that human-caused warming has increased the temperatures that we’re seeing as a result of this heat dome, and it’s going to be pushing those temperatures from what would have been very uncomfortable into potentially dangerous. A heat dome arriving months ahead of the traditional hot season is exactly the kind of calendar shift climate scientists have warned about for years.
Warm Oceans Are Quietly Fueling the Fire

Heat domes do not form in isolation from the rest of the climate system, and record ocean temperatures appear to be playing a supporting role in recent extremes. Climate scientist Michael Mann noted that record sea surface temperatures fuel more extreme weather since warmer oceans mean more moisture in the atmosphere, and the record global ocean temperatures also mean more extreme heat. This connects directly to broader shifts already documented in global climate data.
Brown University climate scientist Kim Cobb has been direct about where the primary responsibility lies. She stated that the primary driver for the uptick in deadly heat waves across the world is the burning of fossil fuels, given that a modest baseline warming drives an exponential increase in extreme heat. Adding El Niño conditions on top of that baseline warming, as occurred heading into 2026, tends to push already record-breaking oceans even higher, giving heat domes an extra reservoir of atmospheric moisture and energy to draw from.
The Toll on Human Health and Vulnerable Communities
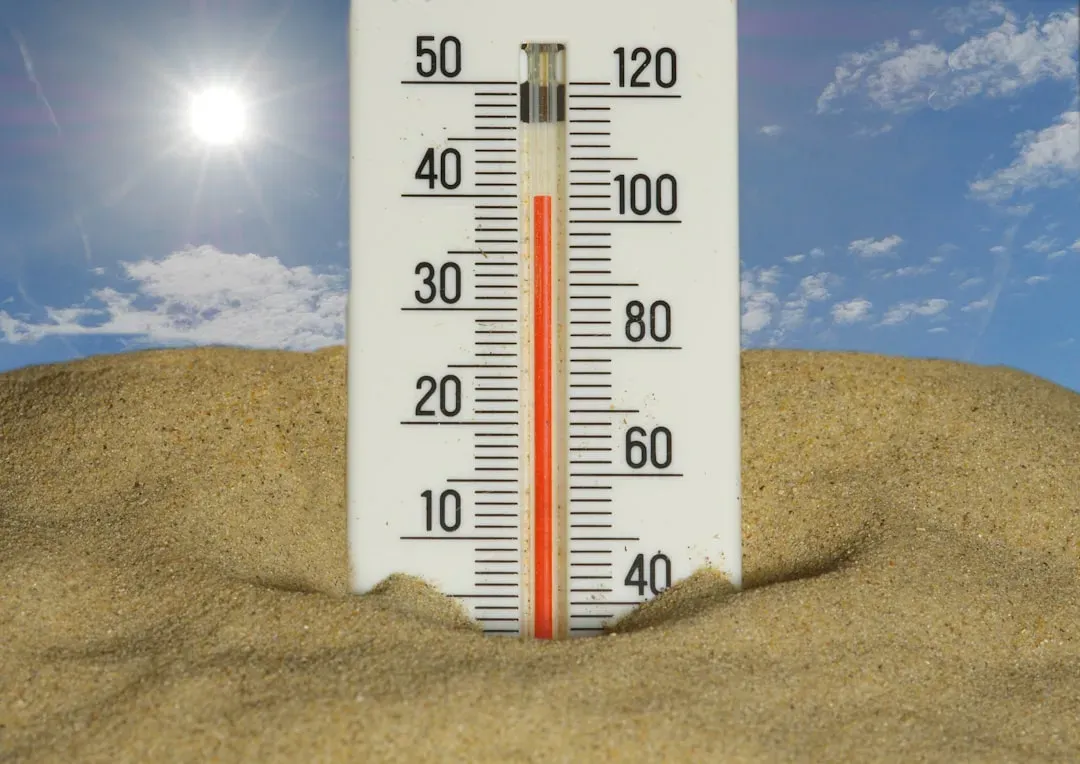
The human cost of these events is rarely distributed evenly across a population. Heat domes put communities at risk of increased mortality rates, and deaths resulting from heat domes are more likely to impact susceptible and marginalized populations, who are less likely to have access to air-conditioned living spaces. The 2021 Pacific Northwest event illustrated this starkly, since most fatalities occurred among people without reliable cooling.
Medical reviews of that disaster found that the overwhelming majority of deaths shared a common thread. The vast majority of those who died collapsed in non-air-conditioned settings during peak heat, and many were found alone in their homes, highlighting the importance of community check-ins during heat emergencies. Emergency departments in Oregon saw an extraordinary spike in heat illness cases during that same window, recording a 63-fold increase in heat illness emergency department visits.
Wildfires, Crops, and the Wider Ripple Effects
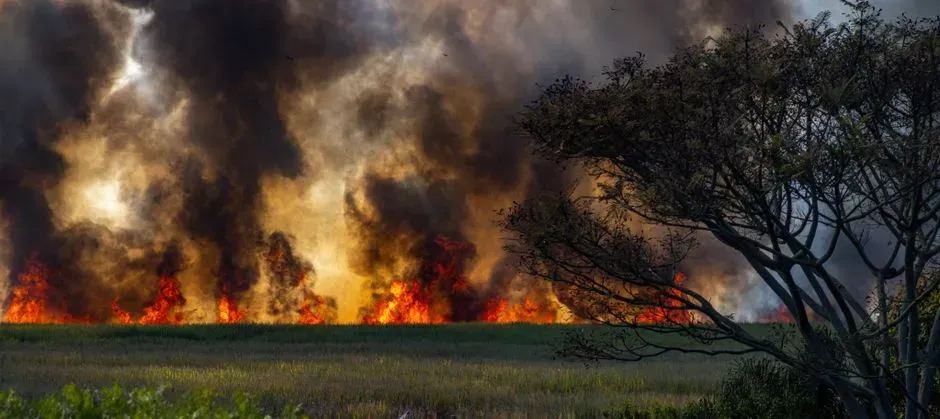
The damage from a heat dome rarely stops once the temperature finally drops, since the dry, stagnant conditions that build up during the event tend to prime a landscape for further disaster. In the case of the 2021 Pacific Northwest heat dome, researchers found the atmospheric setup directly fueled the following fire season, noting that the heat dome accounted for 21 to 34 percent of the total area burned in 2021. Agricultural losses from that single event were also severe, with the disaster resulting in agricultural losses exceeding US 600 million dollars in the Pacific Northwest alone, devastating fruit crops and causing widespread livestock mortality.
More recent European events have shown similar cascading effects on water resources and river systems. Reporting on the 2026 heat wave documented how the heatwave sent Italy’s Po River to record lows, threatening crops and fisheries. These knock-on effects, from strained water supplies to smoke-choked skies hundreds of miles from the original fire, tend to extend a heat dome’s economic and ecological footprint well past the days it actually sits over a region.
Preparing for a Pattern That Isn’t Going Away

Forecasters have actually gotten reasonably good at spotting heat domes before they arrive, which offers at least some window for preparation. The 2021 event, despite its unprecedented severity, was not a total surprise to meteorologists tracking upper atmosphere patterns, since sub-seasonal forecasts showed an increased likelihood of a heat extreme with lead times of 10 to 20 days. That lead time matters enormously for public health agencies trying to open cooling centers and issue warnings before the worst heat arrives.
Longer term adaptation strategies focus less on forecasting and more on redesigning how cities and communities handle extreme heat once it does show up. Public health researchers point to a combination of approaches, noting that mitigation strategies include increasing green areas, using cool roofs and improving ventilation in urban areas, alongside public agency support for vulnerable populations through heat health warning systems, data monitoring, cooling centers, and water management. None of these measures stop a heat dome from forming, but together they represent the most realistic response available while the underlying atmospheric and oceanic conditions that produce these events continue trending in one direction.
