

Ask ten people which drink container is greenest and you’ll probably get ten confident answers. Glass feels pure, aluminum feels recyclable, and plastic gets most of the blame. The research is messier than any of those hunches.
Life cycle studies track a container from raw materials through manufacturing, shipping, use and disposal. The results shift with bottle size, local recycling, how far the drink travels, and whether the container gets reused. Here’s what the recent evidence says about each material.
Why Life Cycle Assessments Disagree
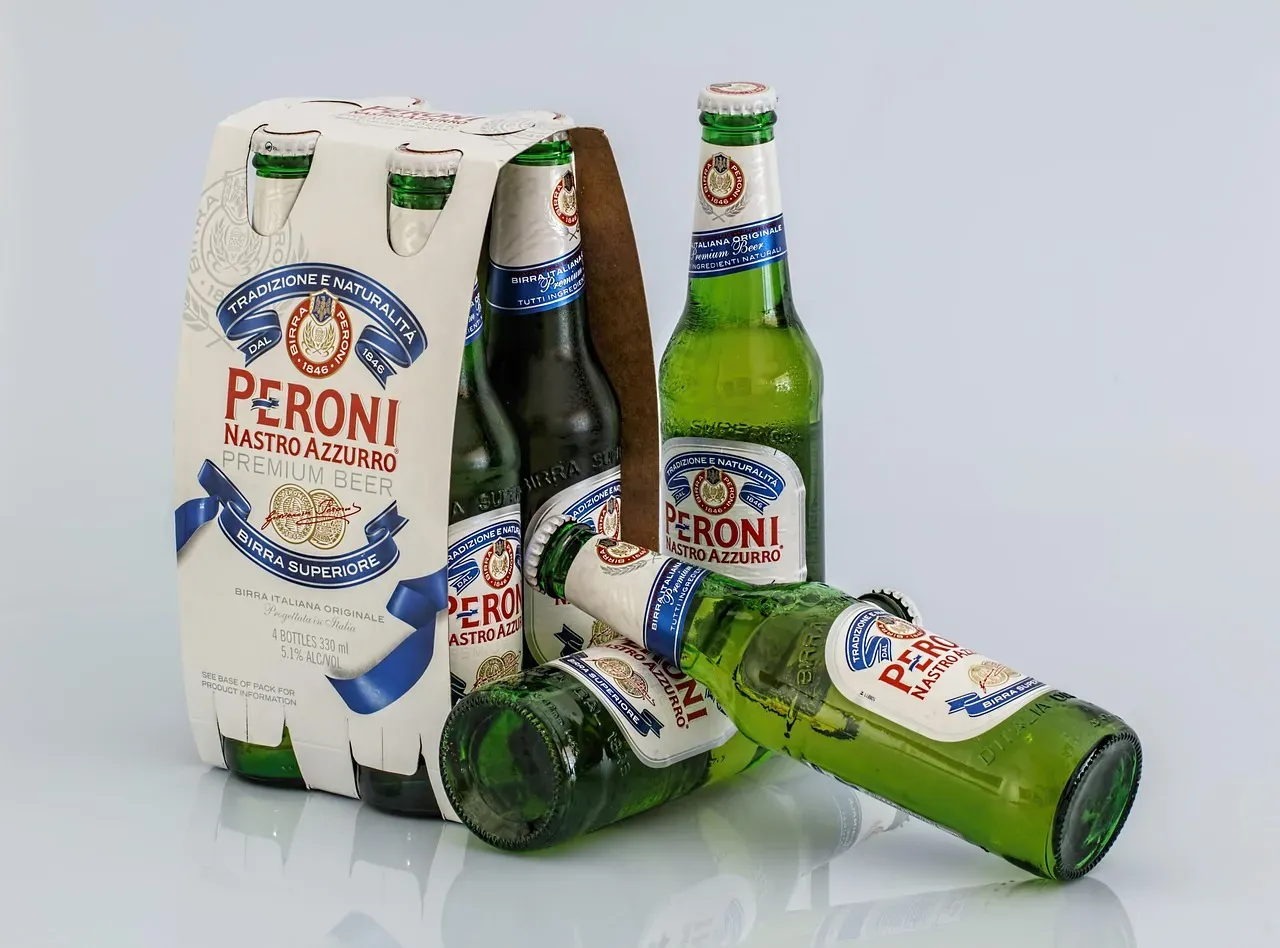
A life cycle assessment adds up the impacts of every stage of a package’s life. Two studies can reach different answers simply because they chose different boundaries or assumptions. One example is how they credit recycled material, which can swing results a lot.
A Thailand study on beverage packaging found that modeling choices and recycling assumptions changed how the containers ranked. Its tables used very different recycling and recycled content figures for aluminum cans, PET bottles and glass bottles. Funding matters too. Several widely shared comparisons were commissioned by industry groups, so it helps to know who paid for the work.
The Carbon Footprint of Glass
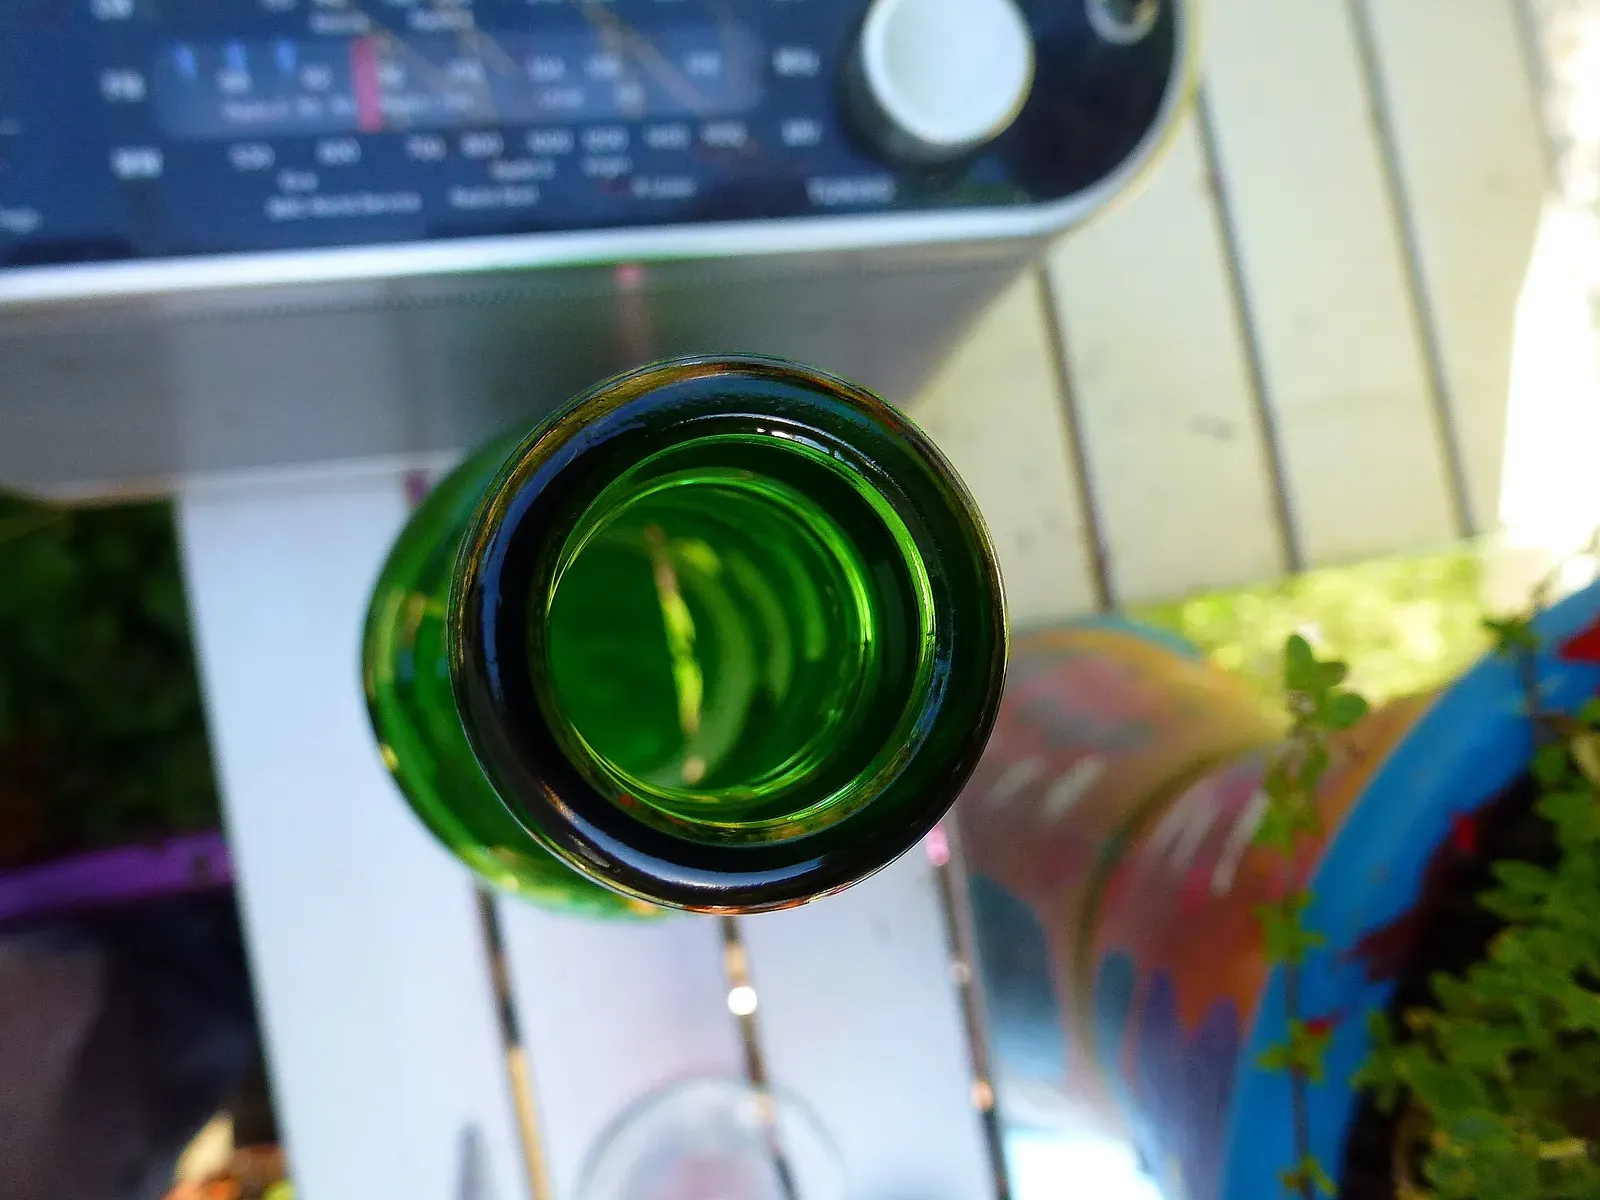
Glass is made by melting sand and other minerals at very high temperatures, which takes a lot of energy. It’s also heavy, and weight raises transport emissions. A review of carbonated drink studies by John Beath Environmental, published through an aluminum industry site, put the global warming potential of glass bottles at roughly 0.387 to 1.05 kg of CO2e, excluding outliers.
A 2025 modeling study of PET and glass packaging found that disposable glass had the highest carbon footprint of the options it examined, because virgin and cullet based production is so energy intensive. Glass does have one big advantage. It can be reused many times if a deposit system brings it back.
The Carbon Footprint of Aluminum
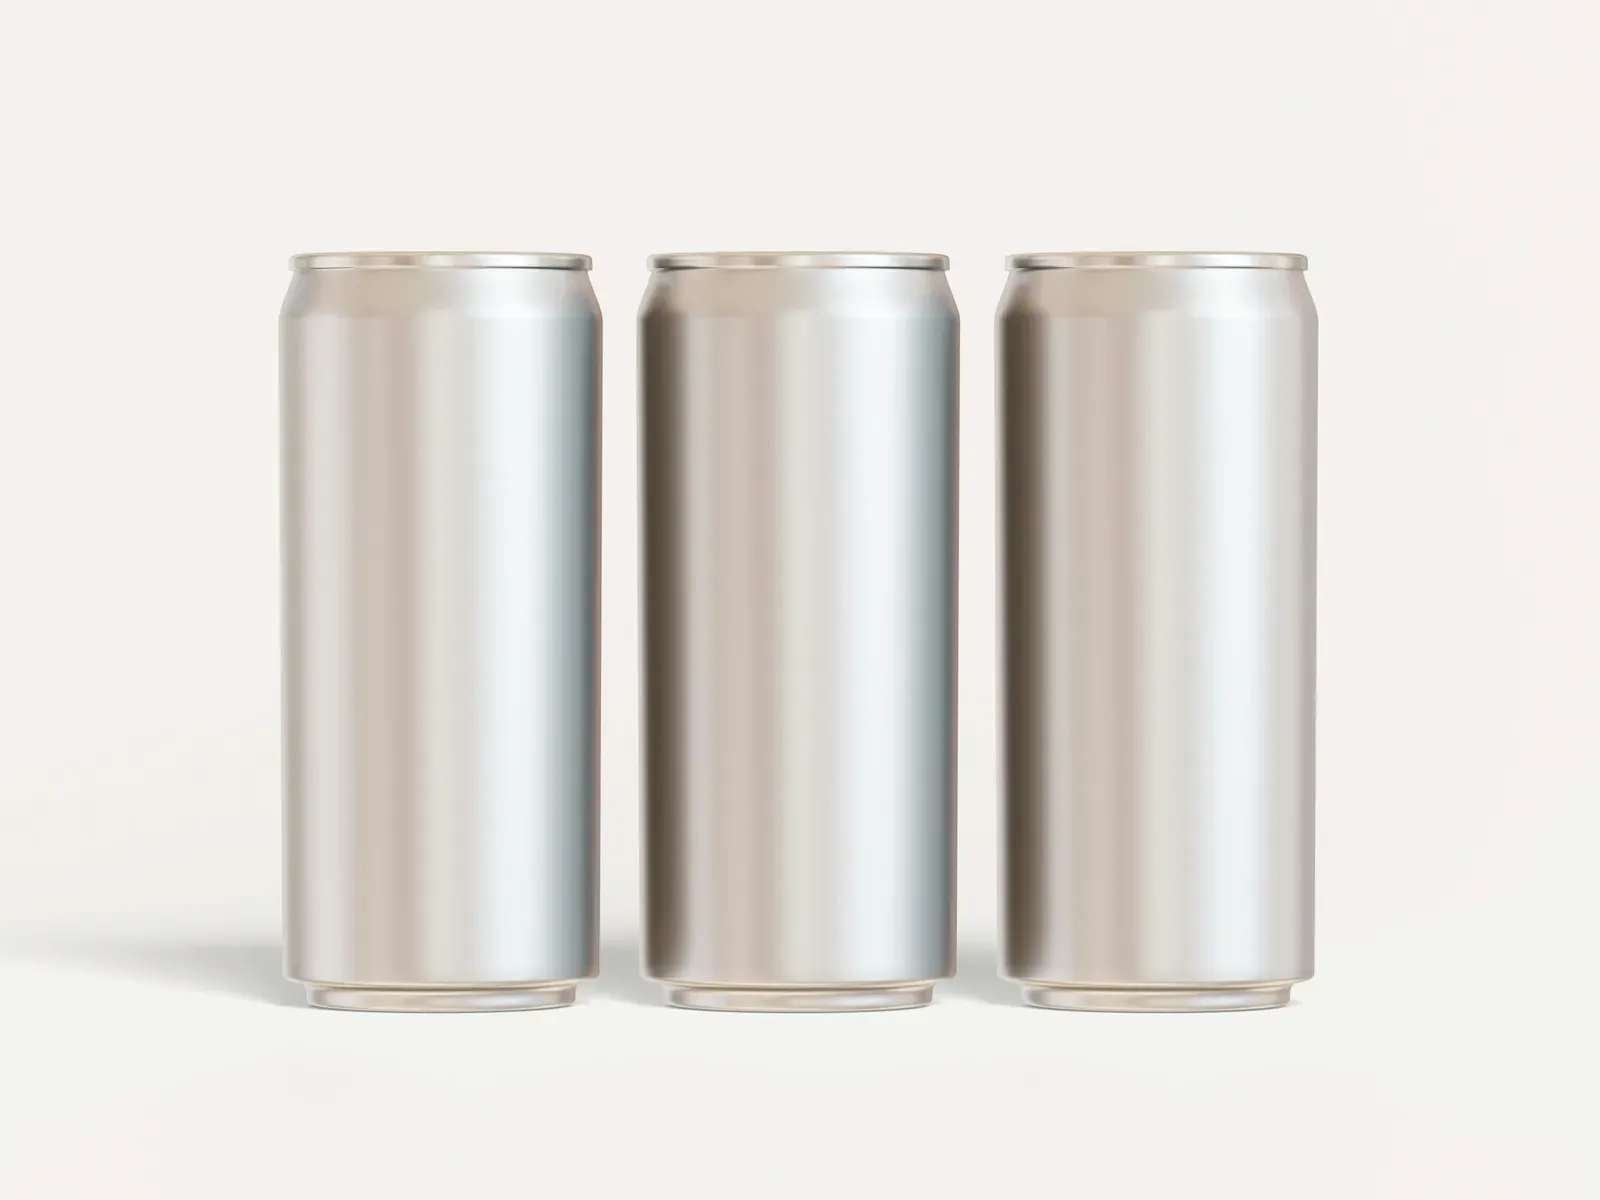
Making aluminum from raw ore is energy hungry, so cans made from virgin metal carry a heavy upfront footprint. Recycled aluminum needs far less energy, which is why recycled content matters so much for cans. Cans are also light and stack neatly, which helps in transport.
The same industry funded review concluded that aluminum cans for carbonated drinks produce fewer carbon emissions than glass bottles and a similar level to PET containers. An aluminum company’s own comparison reached a similar conclusion, finding that aluminium and PET containers have far lower carbon footprints than single use glass for fizzy drinks. Both sources have an interest in the result, so it’s best read alongside independent work.
The Carbon Footprint of PET Plastic
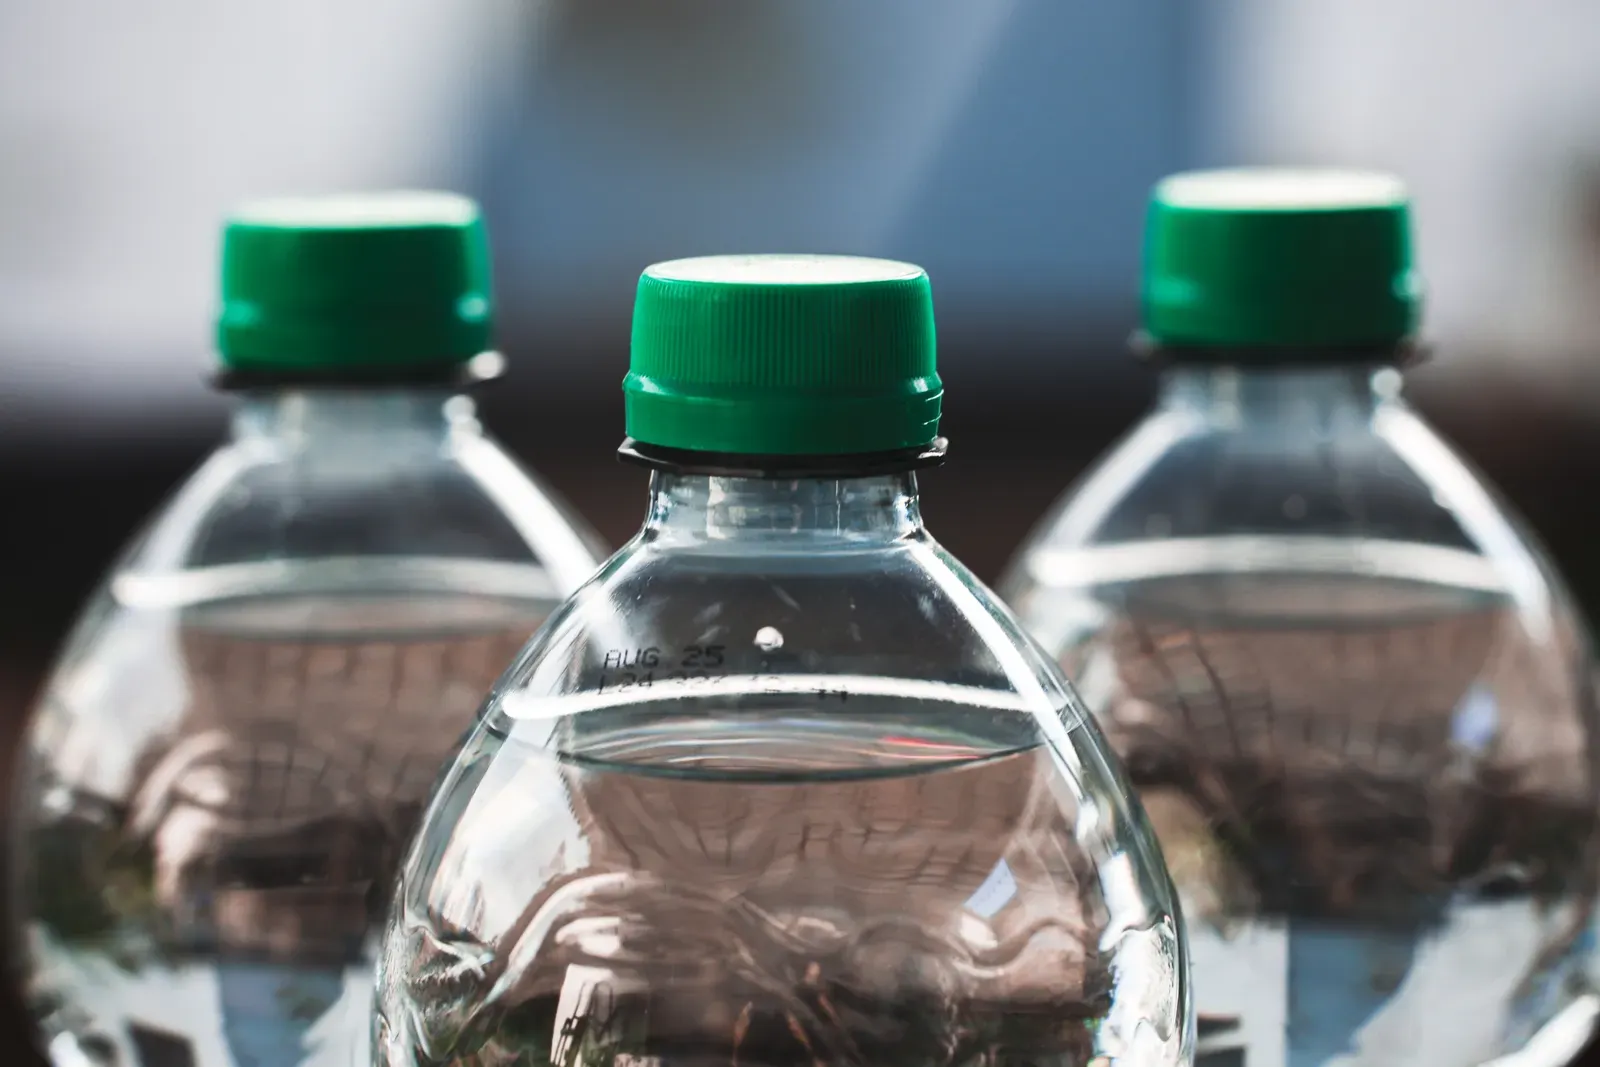
PET usually wins on pure carbon numbers for single use drinks. The bottle is very light, so it takes less material to make and less fuel to move. The same John Beath review found PET bottle footprints of about 0.106 to 0.648 kg CO2e, excluding outliers.
There’s a logistics advantage as well. PET can be shipped to beverage plants as compact preforms and shaped near the filling line, so trucks aren’t carrying containers full of air. Glass bottles and aluminum cans, by contrast, are normally shipped already formed.
Recycling Rates Tell a Different Story
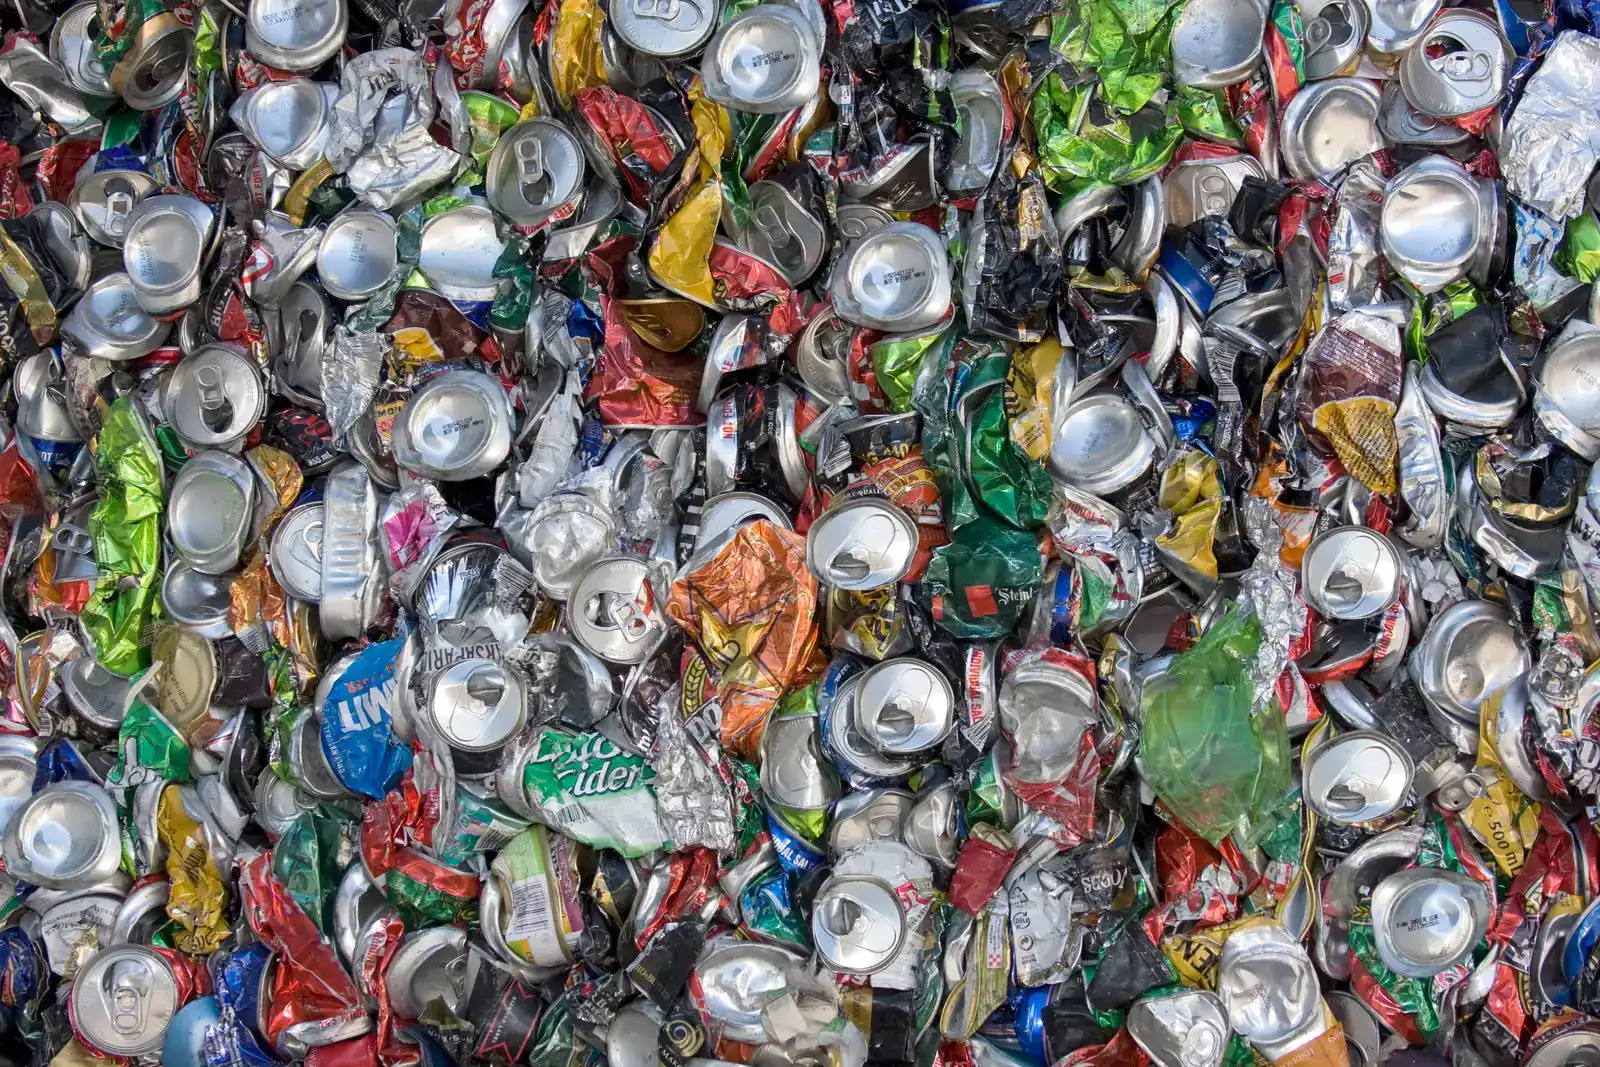
Carbon is only part of the picture, because a container that’s actually recycled behaves very differently from one that gets landfilled. A 2025 study commissioned by the International Aluminium Institute and carried out by Eunomia compared real world recycling. Its data covered about 90 percent of the global aluminum can market, 88 percent of PET bottles and 84 percent of glass bottles.
The headline result favored cans, with aluminium recycling at 74.8 percent against lower figures for glass and PET. Remember that the study came from an aluminum industry group. Still, the broader point holds: being technically recyclable isn’t the same as being recycled.
What Recycling Looks Like in North America
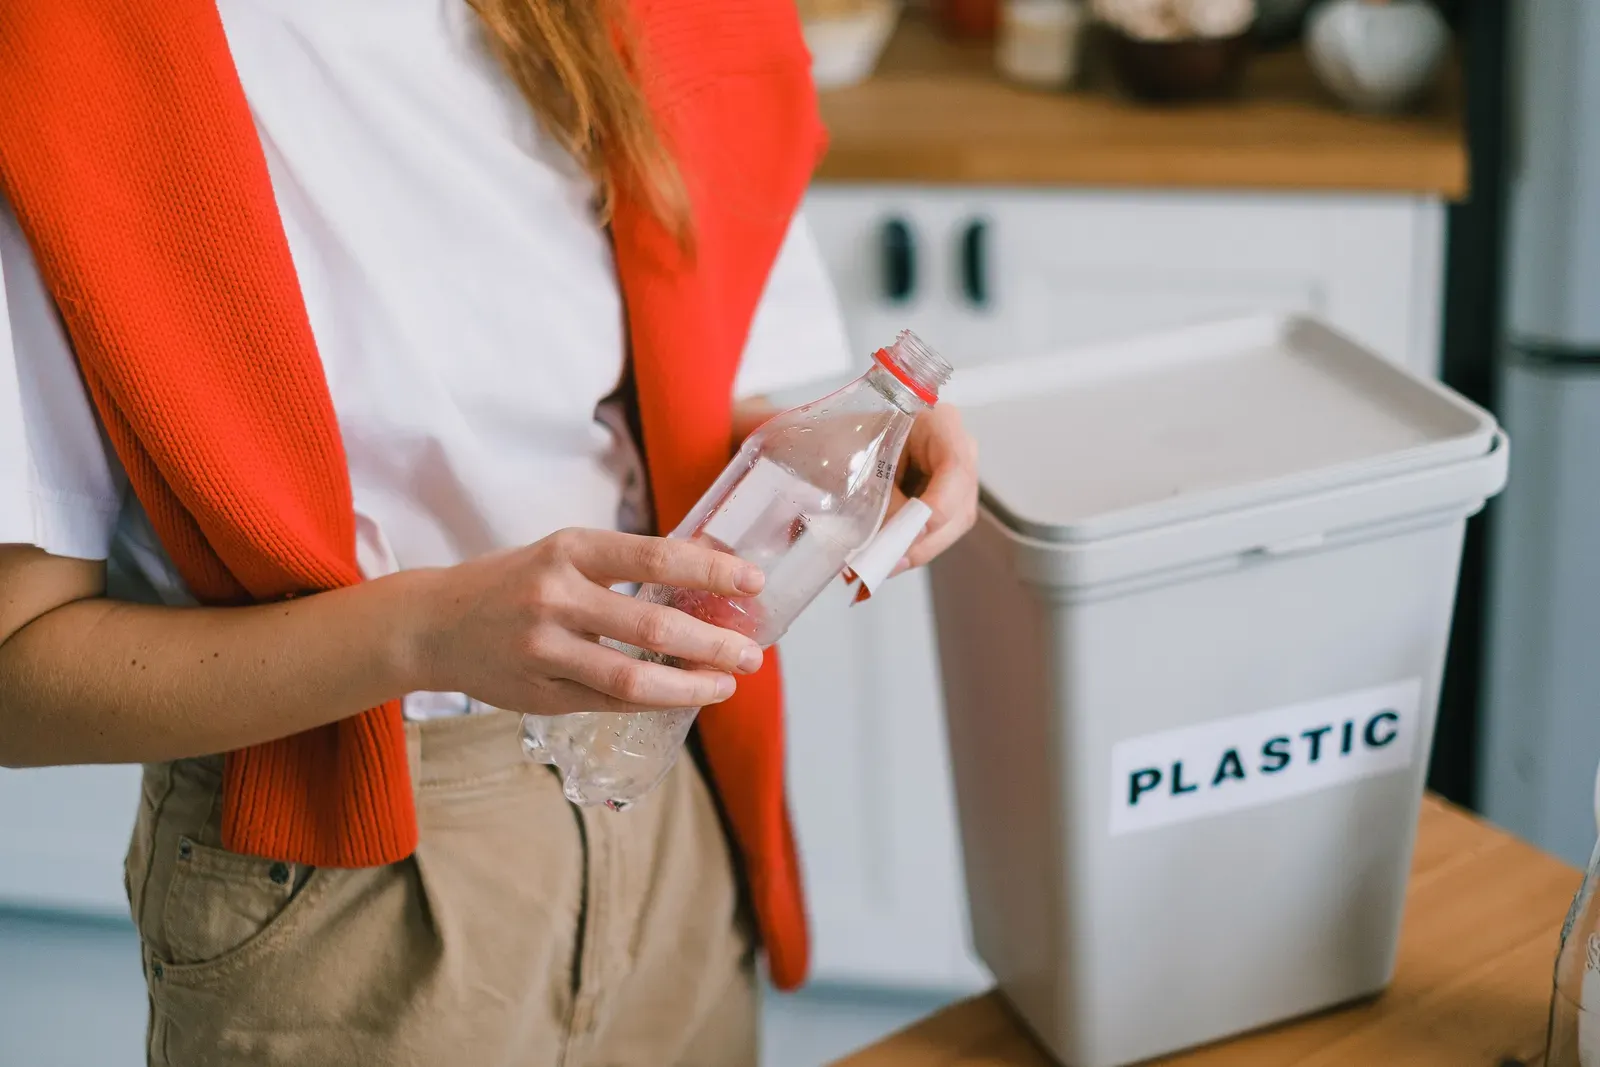
Regional data shows how uneven the picture is. A figure cited from NexantECA in 2023 put North American recycling rates at 28 percent for PET bottles, 40 percent for glass bottles and 49 percent for aluminum cans. Those numbers are lower than the global averages above, which shows how much geography matters.
For PET specifically, bottle recycling in the US reached its highest level in decades in 2023, at 33 percent, with about 1,962 million pounds collected. That’s progress, though most bottles still don’t come back as new material.
Reuse Can Beat Every Single Use Option
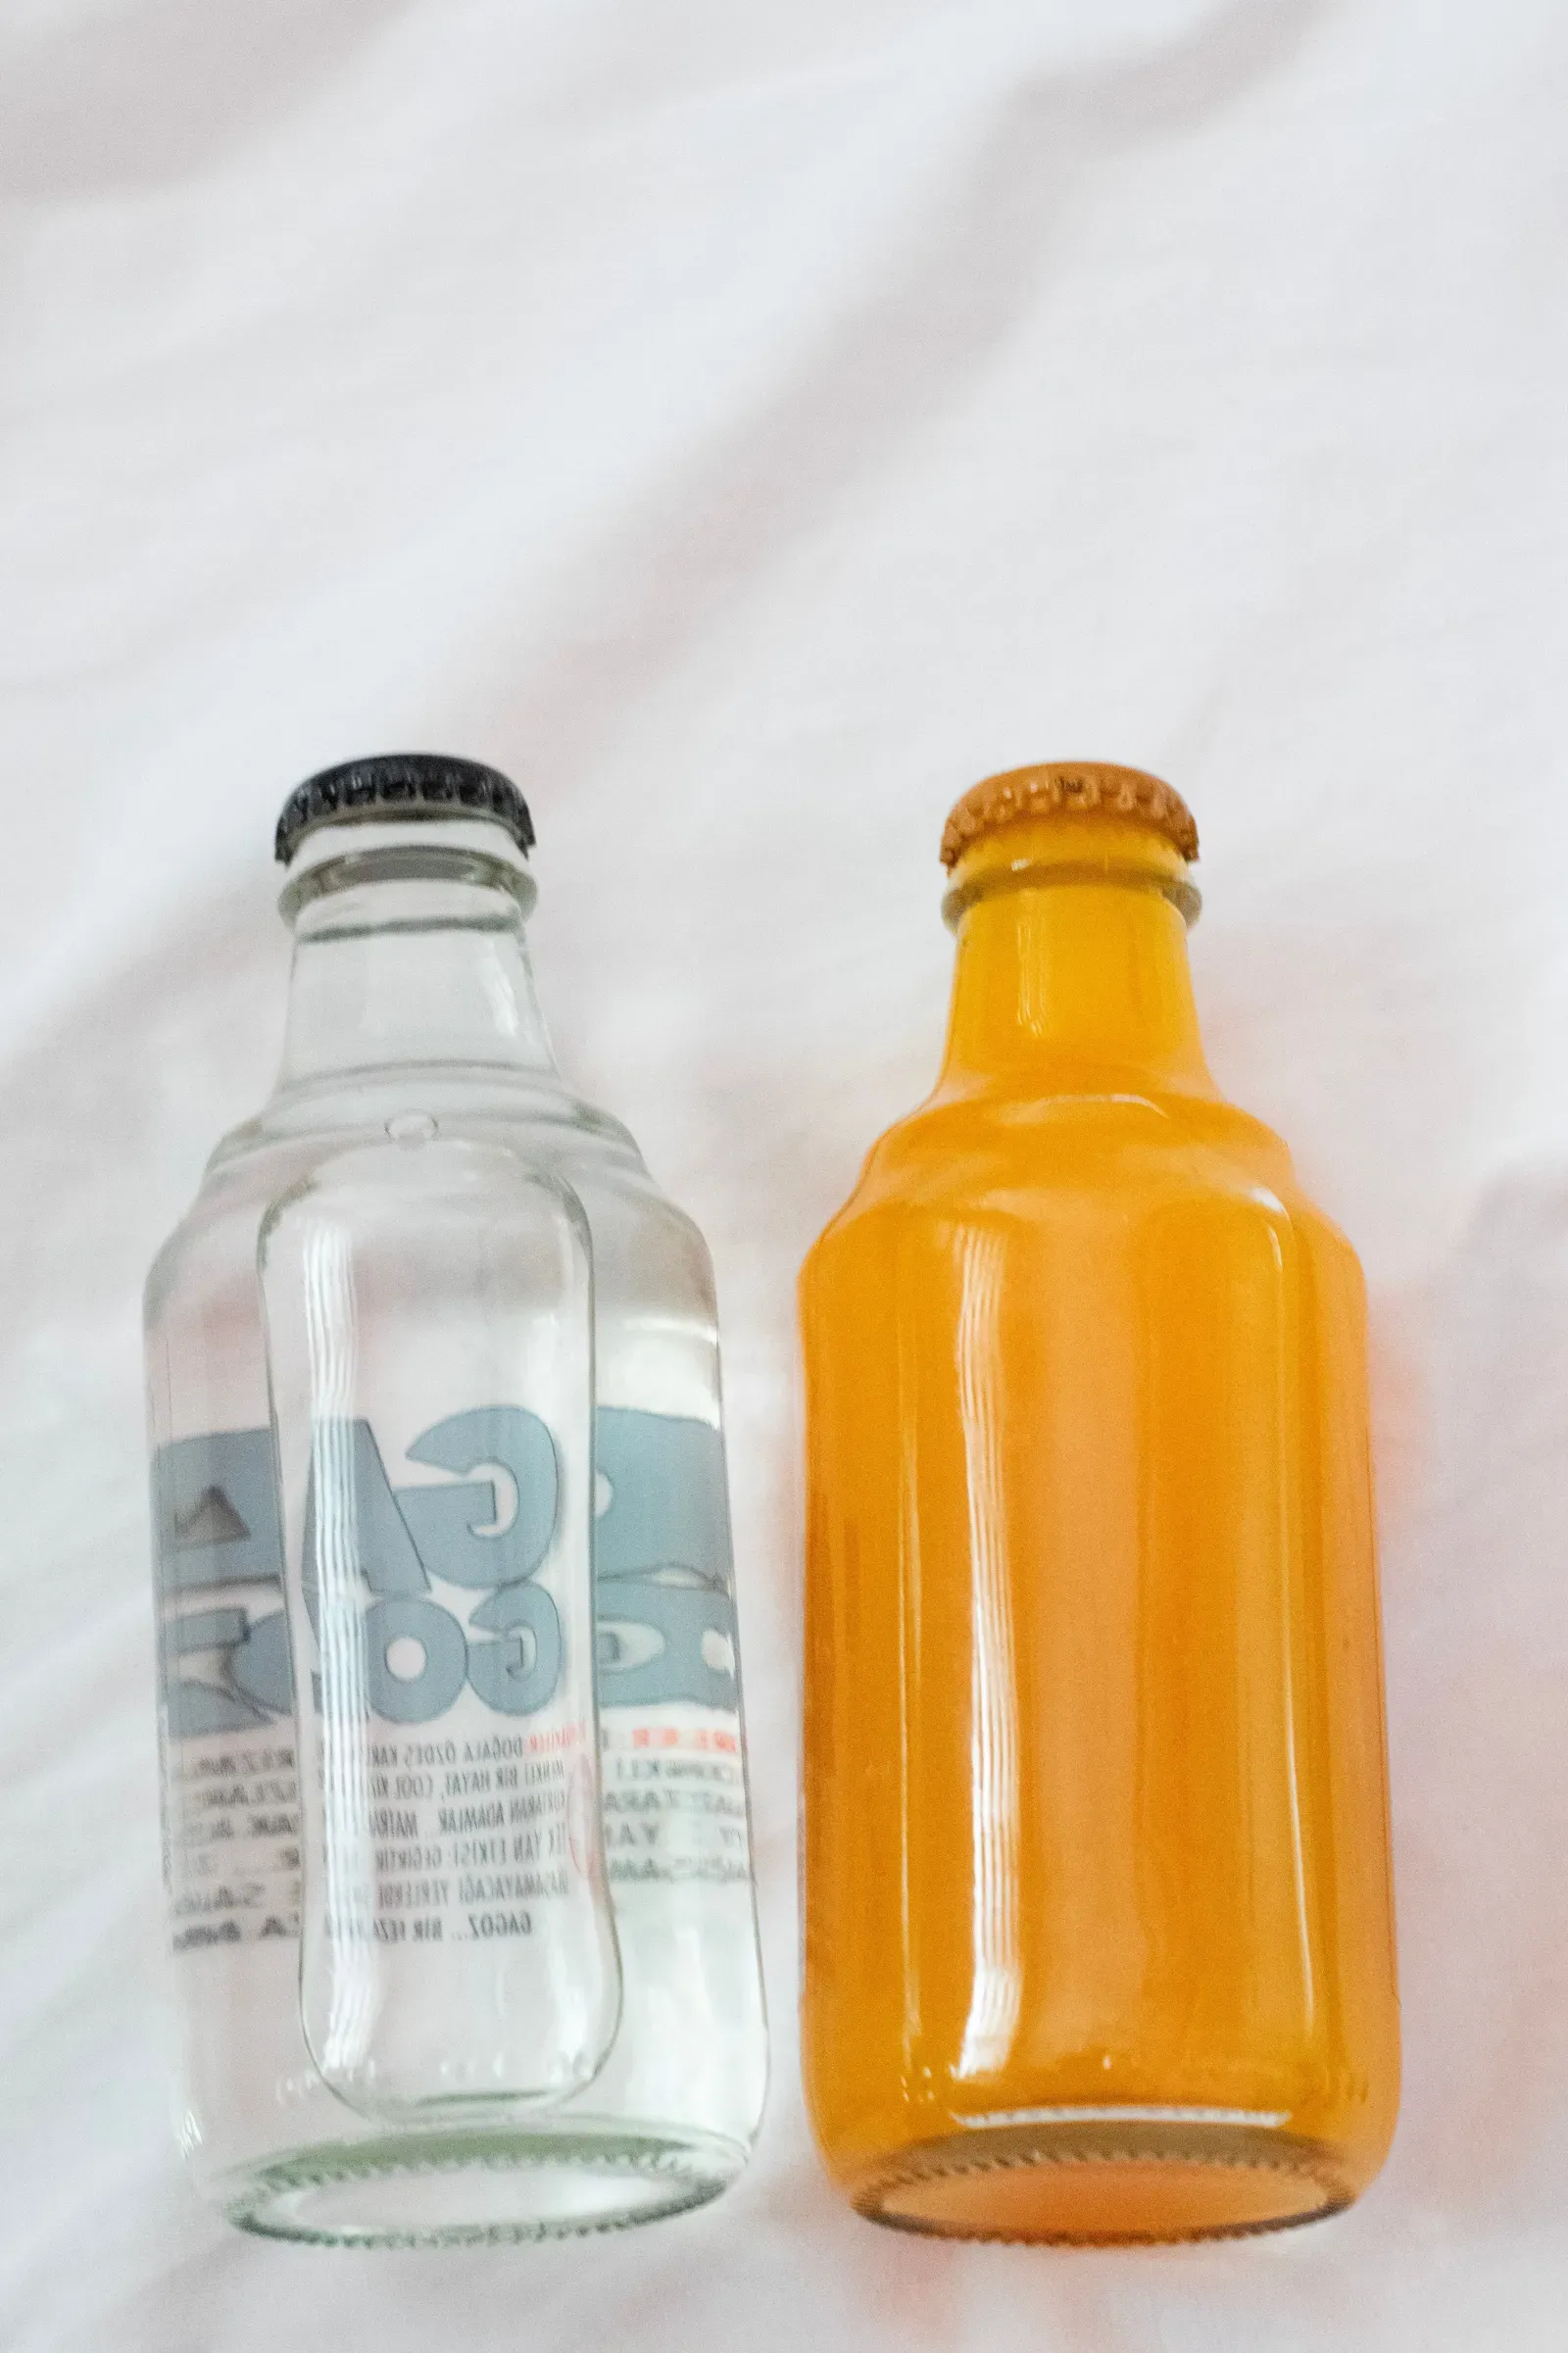
The biggest gains may come from refilling rather than recycling. In the 2025 PET and glass modeling study, returnable glass bottles showed the greatest potential for reducing carbon footprint, by up to five times under high return rates. The same study found a strong inverse link between carbon footprint and recovery rates.
The catch is that reuse only works when people actually return the bottles. Countries with deposit schemes and local bottling do this well, while long distance shipping of heavy glass undermines the benefit. A returnable bottle that travels a short loop is a very different product from a one way glass bottle shipped across an ocean.
Transport and Weight Add Up

Shipping is easy to overlook, yet it can shape the final result. Light containers cost less to move, and PET’s low mass cuts transportation emissions. Heavy glass does the opposite, especially over long distances.
Some of the most cited comparisons come from the bottled water industry. A 2021 Trayak study for the International Bottled Water Association estimated that replacing one million glass bottles with PET water bottles would save 332.6 kg of CO2 equivalent over the full life cycle. Since the industry group commissioned it, treat it as one data point rather than the final word.
Beyond Carbon: Litter, Microplastics and Local Impacts
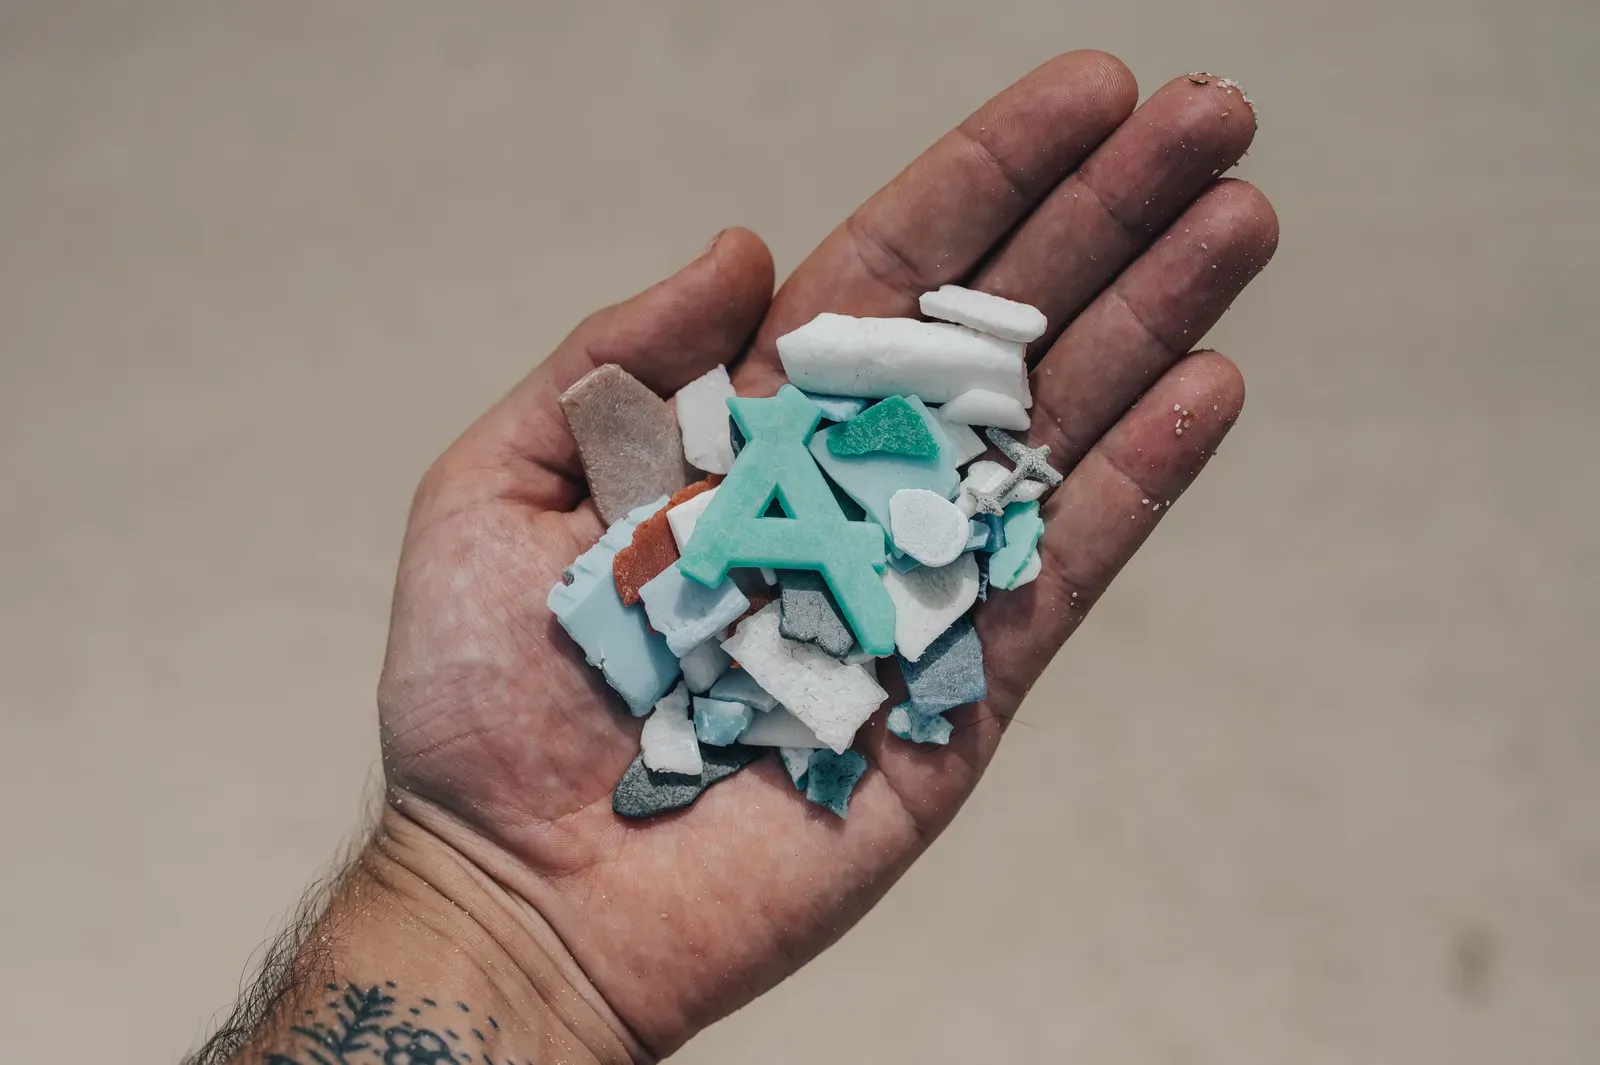
Most comparisons focus on greenhouse gases, but they leave out things that are harder to measure. Plastic litter persists in rivers and oceans, and aluminum mining and glass sand extraction carry local land and water costs. These impacts rarely show up in a single carbon number.
That’s one reason the choice isn’t a simple ranking. PET looks strong on carbon for single use, aluminum looks strong on recycling and circularity, and glass looks best when it’s reused many times. Which one is greenest depends on the drink, the distance and what happens after the last sip.

- I Asked AI and a Waste Auditor How to Cut My Household Trash – Where They Disagreed - November 12, 2026
- Einstein’s equations suggest gravity can reconnect like the sun’s magnetic field - November 12, 2026
- This Map Shows Which States Get the Most Severe Storms Each Year – And It’s Not What You’d Expect - November 12, 2026
