
A few degrees of difference in the tropical Pacific can change how a monsoon behaves, how a fishing season goes, and whether a farmer in Australia plants at all. The ocean there is huge, and its moods leave marks on weather thousands of miles away. Forecasters have watched this pattern for decades, and it is active again this year.
The pattern swings between two phases, El Niño and La Niña, with a neutral state in between. Each phase has a recognizable fingerprint in the water and the air above it. The sections below cover how the cycle works, how it’s measured, and what the 2026 event looks like so far.
A Natural Seesaw Across the Tropical Pacific

El Niño and La Niña are the two opposite phases of one climate cycle, called the El Niño Southern Oscillation, or ENSO. The cycle involves both the ocean surface and the atmosphere above it. When one shifts, the other follows.
The swings aren’t on a fixed schedule. Research summarized by Columbia University’s International Research Institute for Climate and Society notes that these events typically recur every 2 to 7 years and usually last 9 to 12 months, though some stretch to two years. That irregularity is part of why forecasting them is hard.
How El Niño Takes Shape
Under normal conditions, steady trade winds push warm surface water toward the western Pacific. During El Niño, those winds weaken and the warm water spreads back east toward South America. Cloudiness and rainfall follow the warm water, and the whole tropical circulation rearranges itself.
The atmosphere is part of the story, not just the ocean. NOAA’s Climate Prediction Center says that atmospheric circulation anomalies over the equatorial Pacific must be consistent with El Niño, so a warm ocean alone doesn’t qualify. The two have to reinforce each other.
What Makes La Niña Different
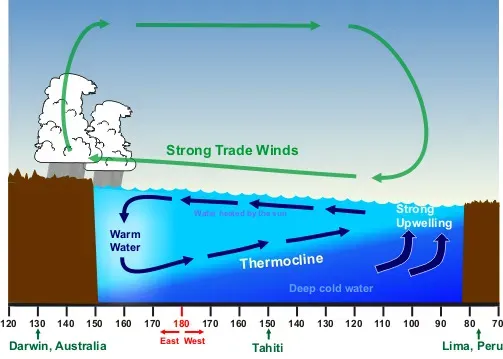
La Niña is close to the reverse. Trade winds strengthen, deep cold water rises along the eastern Pacific, and the warm pool in the west gets even warmer. That cooler eastern ocean tends to push the jet stream and rainfall belts in the opposite direction from El Niño.
The two phases aren’t perfectly symmetrical, though. La Niña episodes often last longer and can return for a second or third winter in a row. The recent record shows this clearly: the latest NOAA tables show the index stayed in negative territory through the first months of 2026 before climbing quickly toward warm values.
How Scientists Measure the Pacific’s Mood
The standard yardstick is the Niño 3.4 region, a band of the central Pacific near the equator. Forecasters compare its sea surface temperature with a long term average. CPC considers El Niño or La Niña conditions to occur when departures meet or exceed 0.5 degrees Celsius in either direction, alongside matching atmospheric signals.
Another requirement is persistence. The anomalies must also be forecast to last for three consecutive months, which filters out brief blips. NOAA also now uses a Relative Oceanic Niño Index, which adjusts for the background warming of the tropical oceans, so readings can differ from the older index that many people still quote.
Where the Pacific Stands in October 2026
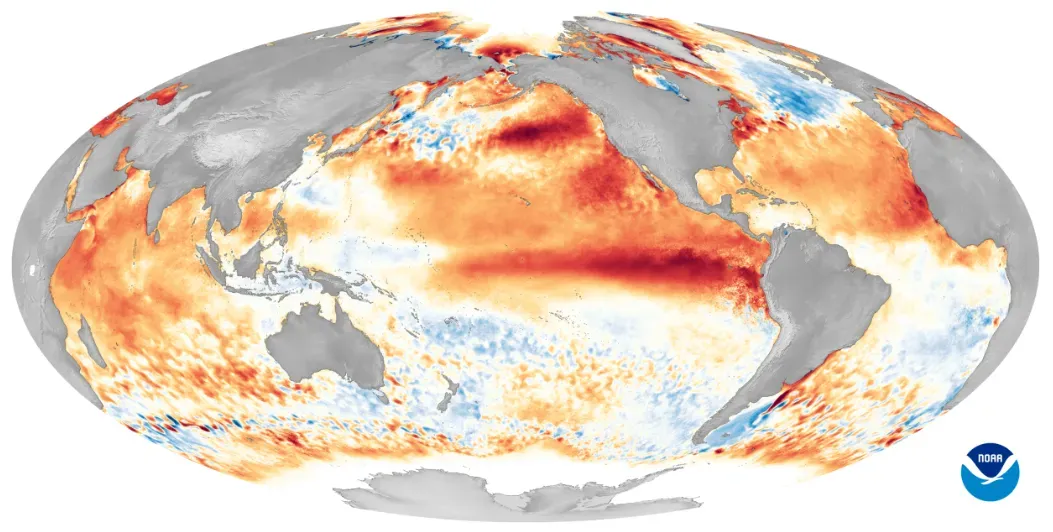
Right now, El Niño is not just present, it’s growing. NOAA’s October 8 discussion says El Niño continues to strengthen, with a strong to very strong event likely through January to March 2027, at odds above eighty three percent. The agency’s alert status is an El Niño Advisory.
The raw numbers are striking. The IRI reported that the weekly Niño 3.4 index centered on October 14 reached +3.3°C, and that weekly anomalies had stayed above 3.0 for five straight weeks. On the relative index, the July to September average came in around 1.7°C, while the September monthly figure was higher, and some portions of the eastern equatorial Pacific exceeded +4.0°C in anomalies.
Rainfall, Floods and Drought
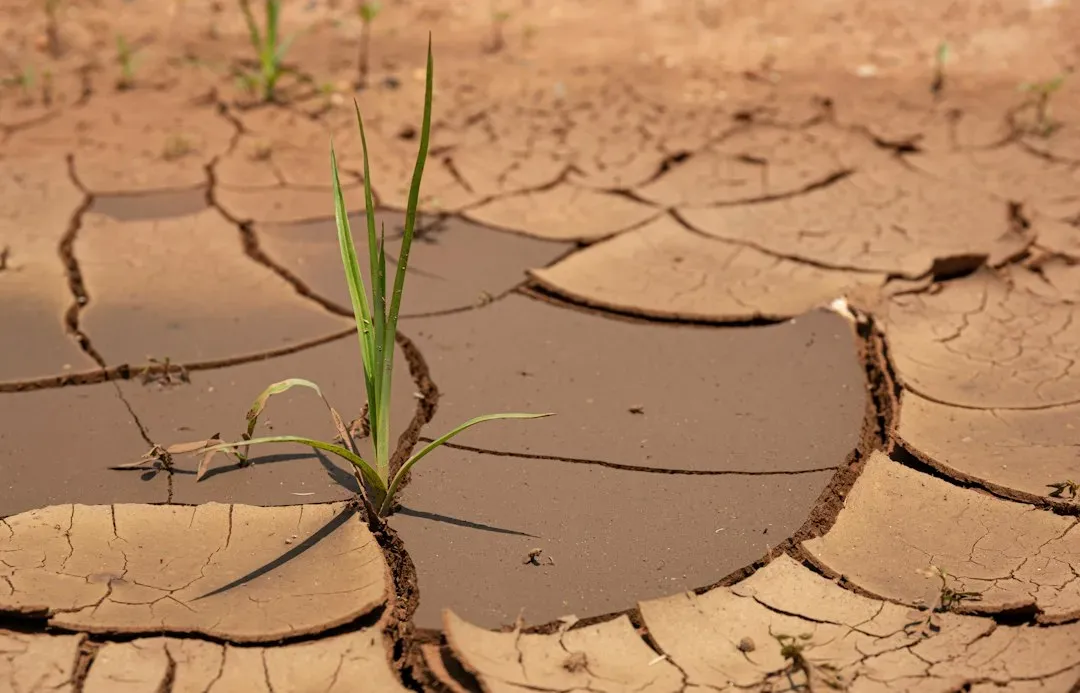
Rainfall is where ENSO shows up most clearly in daily life. During El Niño, the wettest tropical weather shifts toward the central and eastern Pacific. Indonesia, northern Australia and parts of southern Africa and India tend to turn drier, while Peru, Ecuador and parts of the southern United States often see heavier rain.
These are tendencies, not guarantees. Local geography, other climate cycles and plain chance all play a role, so no two El Niños behave identically. The Indian Ocean also matters: one private outlook this month noted that the Indian Ocean dipole has shifted to a strong positive phase likely to run alongside El Niño, which can compound dryness in some regions and flooding in others.
Temperature and the Global Heat Picture
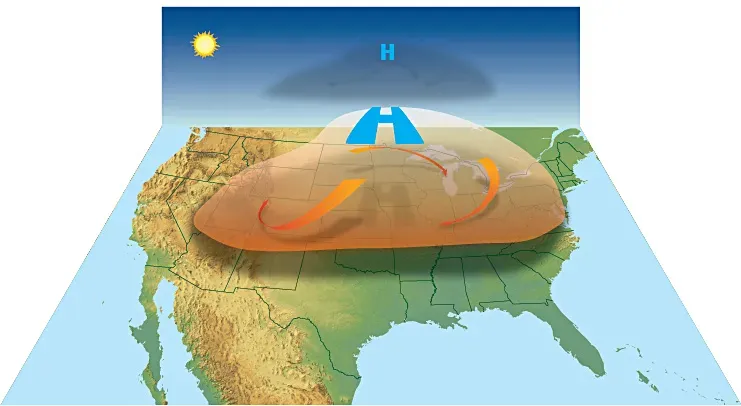
A strong El Niño releases heat from the ocean into the atmosphere, and global average temperatures typically rise in the months after its peak. That’s why years following big El Niños, such as 2016 and 2024, tended to set heat records. Climate change adds a warming baseline underneath the cycle, so the effects stack.
For 2026, the long lag matters. Because the event is still building and is expected to peak late this year, much of its influence on global temperature would show up in 2027. Anyone reading early headlines about record heat should remember that the cycle shifts the odds rather than fixing a result.
Hurricanes, Storms and Winter Patterns
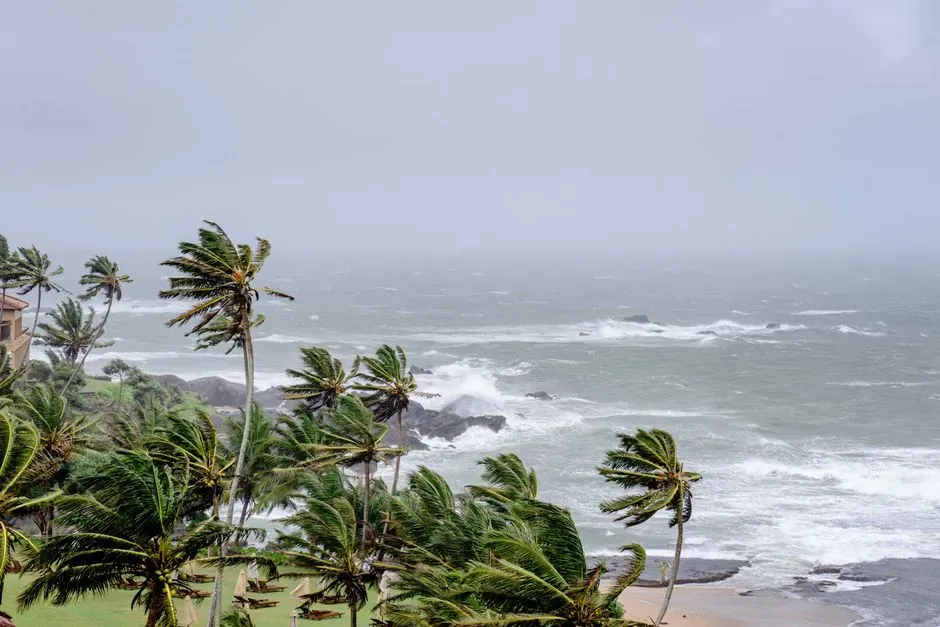
El Niño tends to suppress Atlantic hurricanes by increasing wind shear over the basin, while boosting activity in the central and eastern Pacific. A private forecaster has pointed out that strong Atlantic warmth was held back by El Niño wind shear during the 2026 season. That illustrates how ocean heat alone doesn’t guarantee storms.
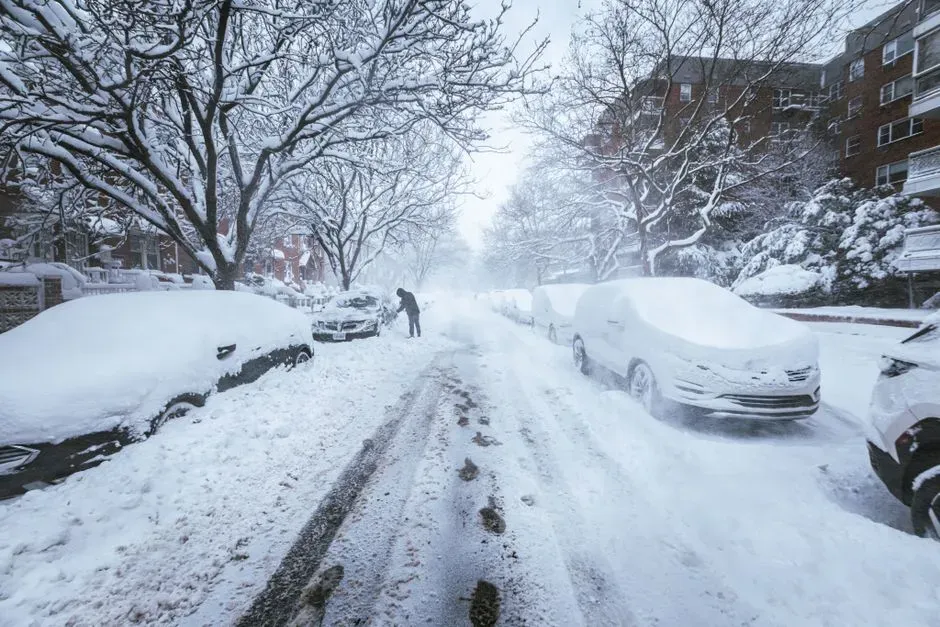
Winter is the other big story. In North America, El Niño often steers a stronger southern jet stream, bringing wetter conditions to the southern tier of the United States and milder weather across the far north. NOAA’s seasonal outlooks incorporate these patterns, though they remain probabilities rather than promises.
Oceans, Coral and Fisheries
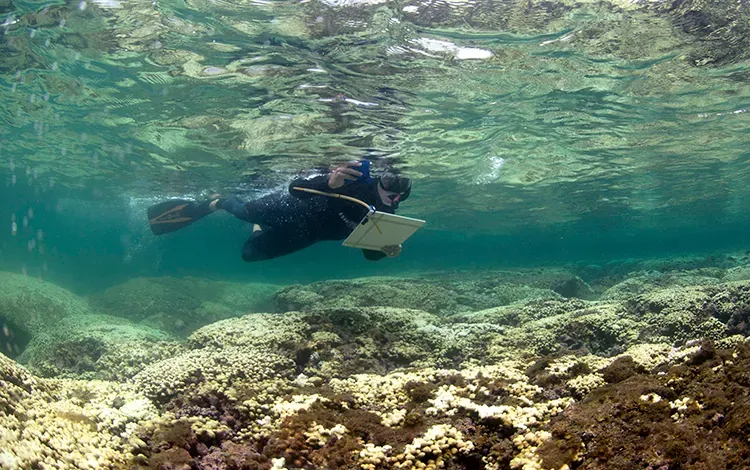
The effects don’t stop at the shoreline. Warm eastern Pacific waters can cut off the nutrient rich upwelling that feeds anchovies off Peru, which affects fishing fleets and fishmeal markets. Marine heat can also trigger coral bleaching, which is why NOAA’s Coral Reef Watch tracks ENSO conditions alongside its bleaching forecasts.
Warm water events can strain seabirds, sea lions and other marine life that depend on a predictable food supply. These effects vary by region and season. Researchers generally treat each El Niño as a fresh test, since background ocean warming changes how reefs and fisheries respond.
What Forecasters Expect After the Peak
Agencies agree the event should peak around the end of 2026. ASEAN’s regional climate center says the Relative Niño 3.4 index is predicted to peak sometime during October to December 2026, with conditions continuing into early 2027. Most models, with some predicting rapid decay and others a more gradual one, still show El Niño present in March 2027.
Beyond that, certainty drops. One private outlook projects a return to neutral by May 2027 and a weak La Niña later in the year, but that is a single forecast and not an official NOAA position. NOAA’s next monthly diagnostic discussion is scheduled for 12 November 2026.

- I Asked AI and a Waste Auditor How to Cut My Household Trash – Where They Disagreed - November 12, 2026
- Einstein’s equations suggest gravity can reconnect like the sun’s magnetic field - November 12, 2026
- This Map Shows Which States Get the Most Severe Storms Each Year – And It’s Not What You’d Expect - November 12, 2026
