
In the early 1800s, a sailor or farmer who wanted to know what the sky would do next had a short list of tools. They could read a barometer, check a thermometer, and look at the clouds. Most of the forecasting happened in a person’s head, and it rarely reached anyone beyond the next village or harbor.
Two centuries later, forecasts are built from satellites, radar networks, weather balloons and supercomputers. Some of them now involve artificial intelligence as well. The route from one to the other runs through the telegraph, two world wars, the space race and a long series of improvements in how we measure the atmosphere.
The Barometer and the Weather Glass
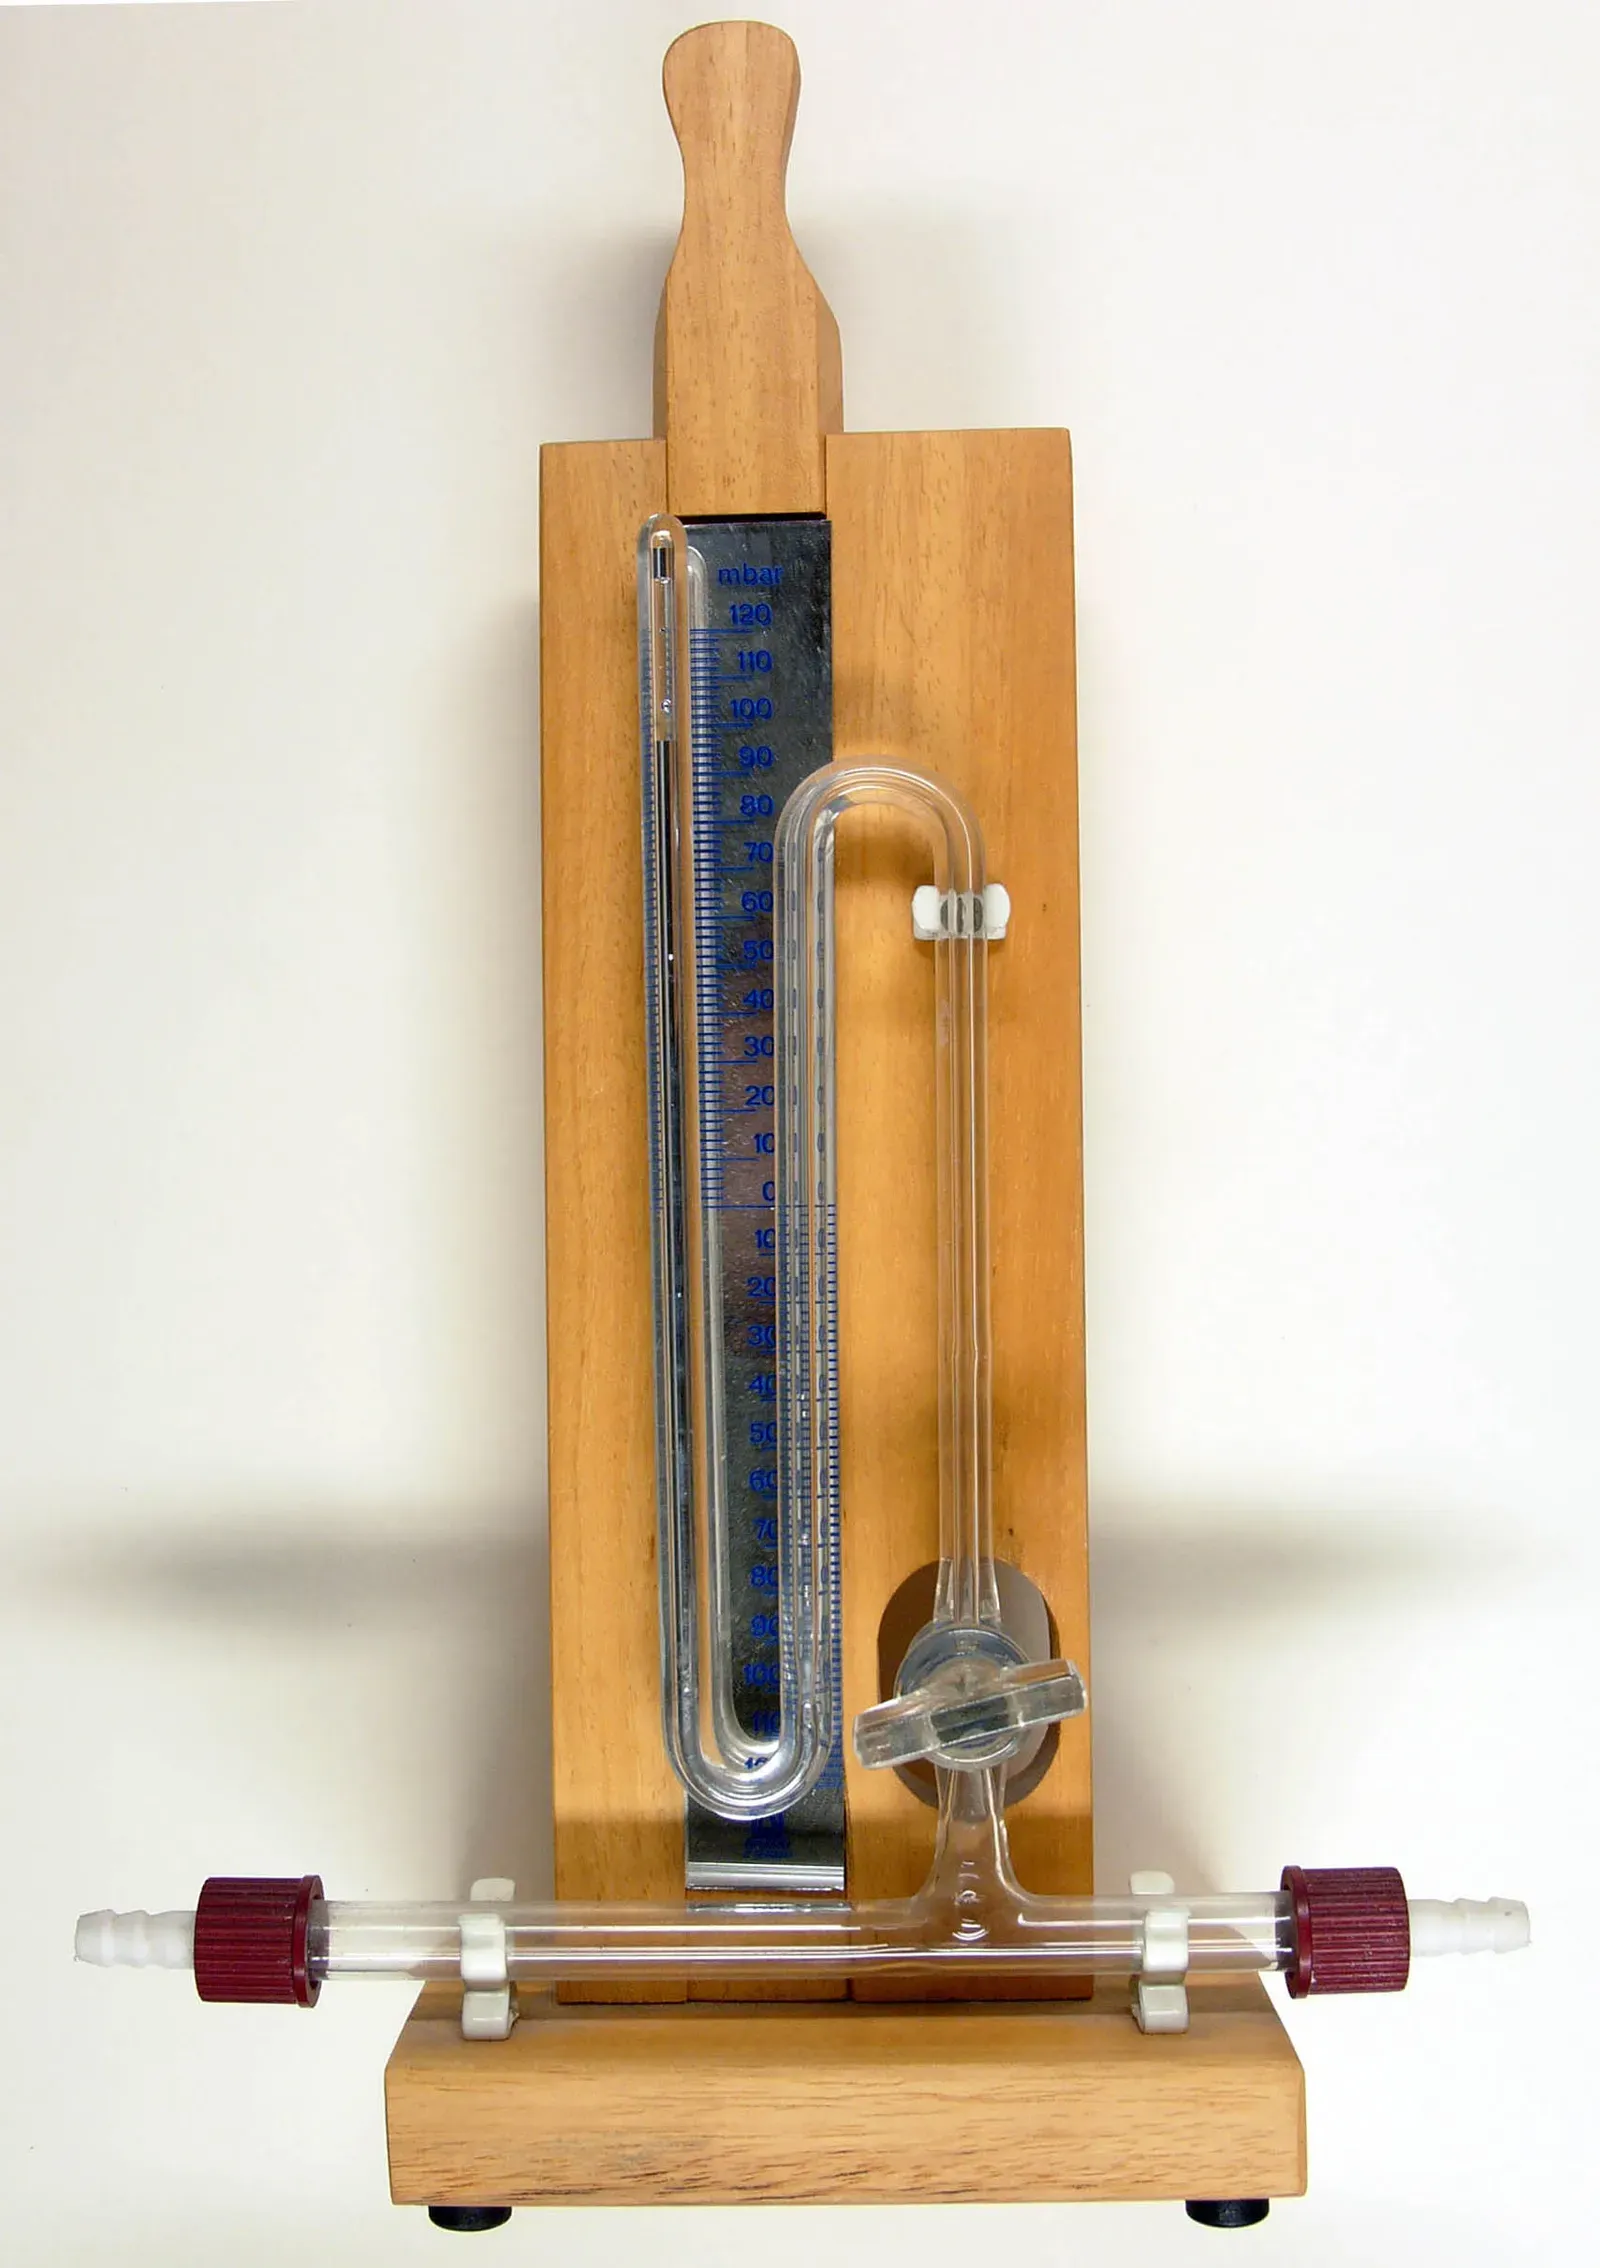
The mercury barometer dates to the 1640s, when Evangelista Torricelli showed that air has weight. By the 1800s it was a common instrument on ships and in well-off homes. Falling pressure usually meant worsening weather, and rising pressure usually meant improvement.
Those rules of thumb were useful but local. A barometer told you what was happening above one spot, not what was approaching from the west. Dials often carried printed labels such as fair or stormy, though serious observers knew the rate of change mattered more than the label.
The Telegraph Turned Observations Into Maps
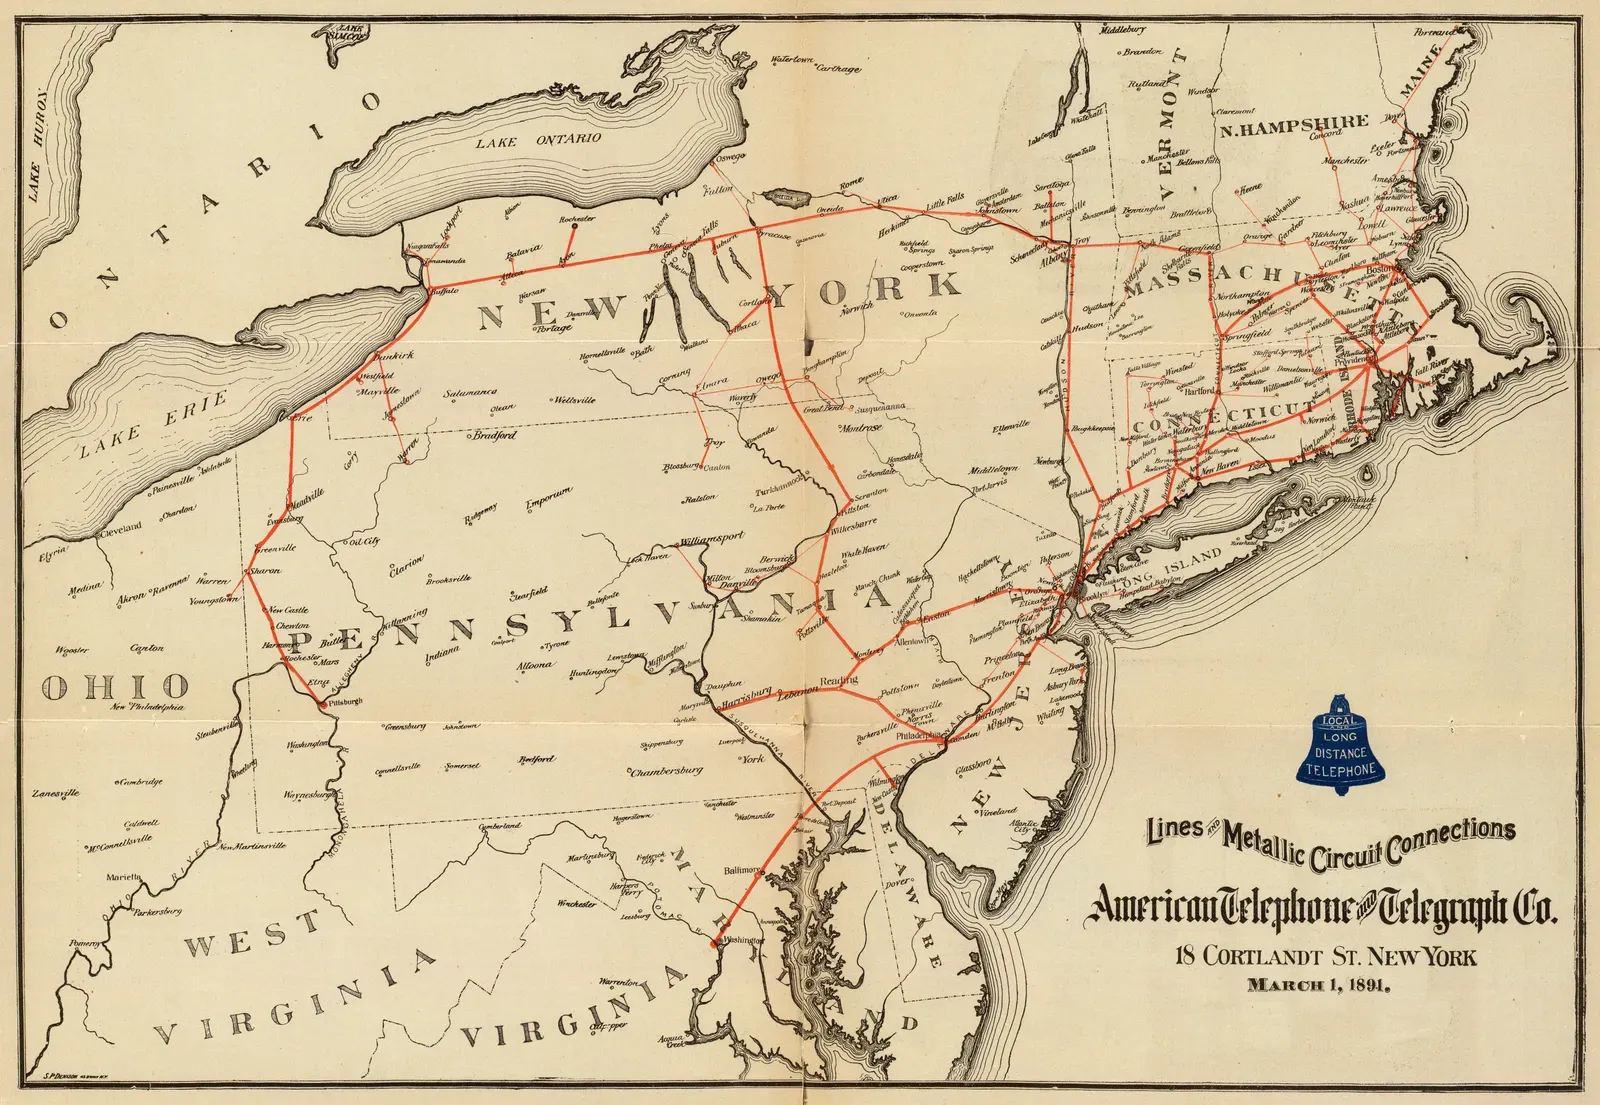
Forecasting changed once weather reports could travel faster than the weather itself. Telegraph lines spread through Europe and North America in the 1840s and 1850s, and observers began sending readings to central offices. For the first time, someone could compare conditions in several places on the same day.
Those readings could be drawn on a single chart. That let forecasters see storms as moving systems rather than isolated local events. Much of modern synoptic meteorology grew out of this simple step.
Government Weather Services Take Shape
Britain’s Meteorological Department was founded in 1854 under Robert FitzRoy, a naval officer who had captained the Beagle. His office began issuing storm warnings for coastal waters in the early 1860s. Newspapers started printing daily forecasts at about the same time, and the word forecast itself came into common use.
In the United States, the Army Signal Service began a national weather service in 1870. It later became the civilian Weather Bureau in 1890. These agencies standardized instruments and observing times, which made data from different places comparable.
Balloons and Radiosondes Reach Higher
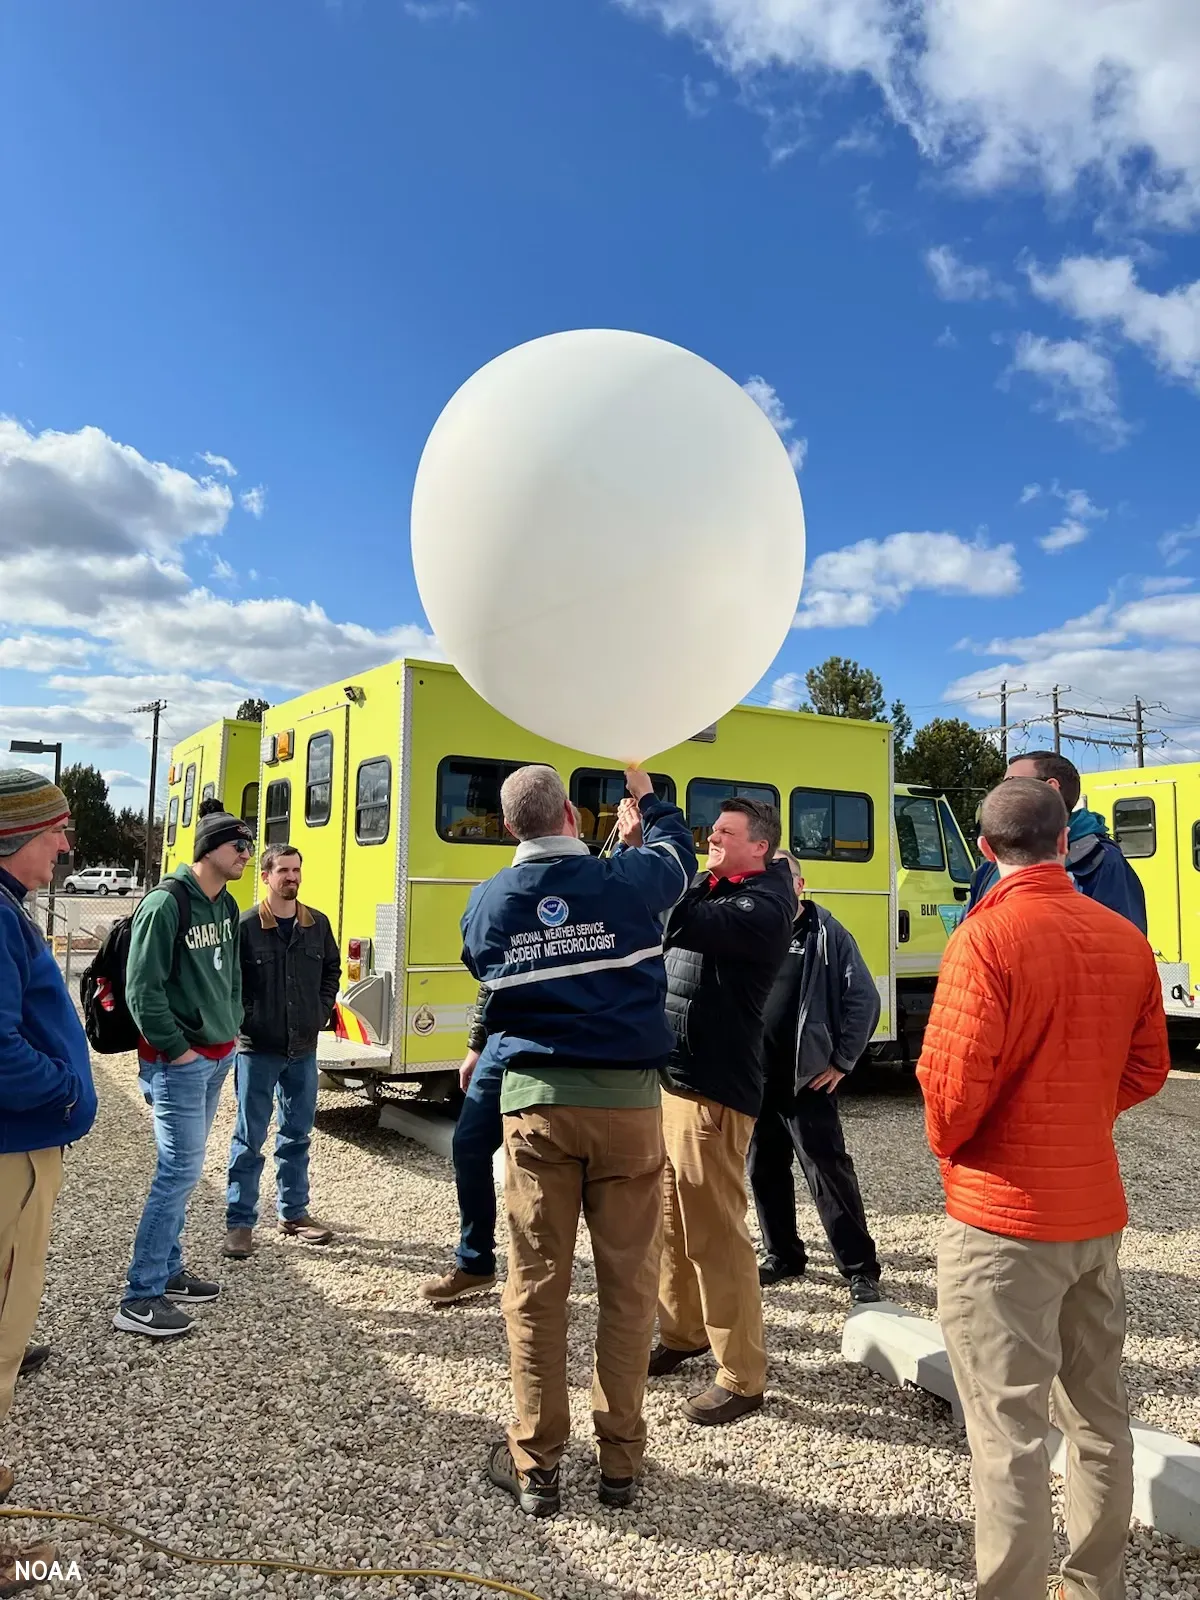
Surface readings only describe the bottom of the atmosphere. Kites and balloons carried instruments aloft in the late 1800s and early 1900s, and they showed that the upper air governs a great deal of surface weather. In the 1930s, radiosondes arrived. These small radio transmitters hang beneath balloons and report pressure, temperature and humidity as they climb.
Radiosondes are still in use. Weather services around the world launch them at fixed times each day, and the readings feed directly into forecast models. It’s a rare case of an early twentieth century tool that hasn’t been fully replaced.
Radar Moves From Wartime Secret to Storm Watcher
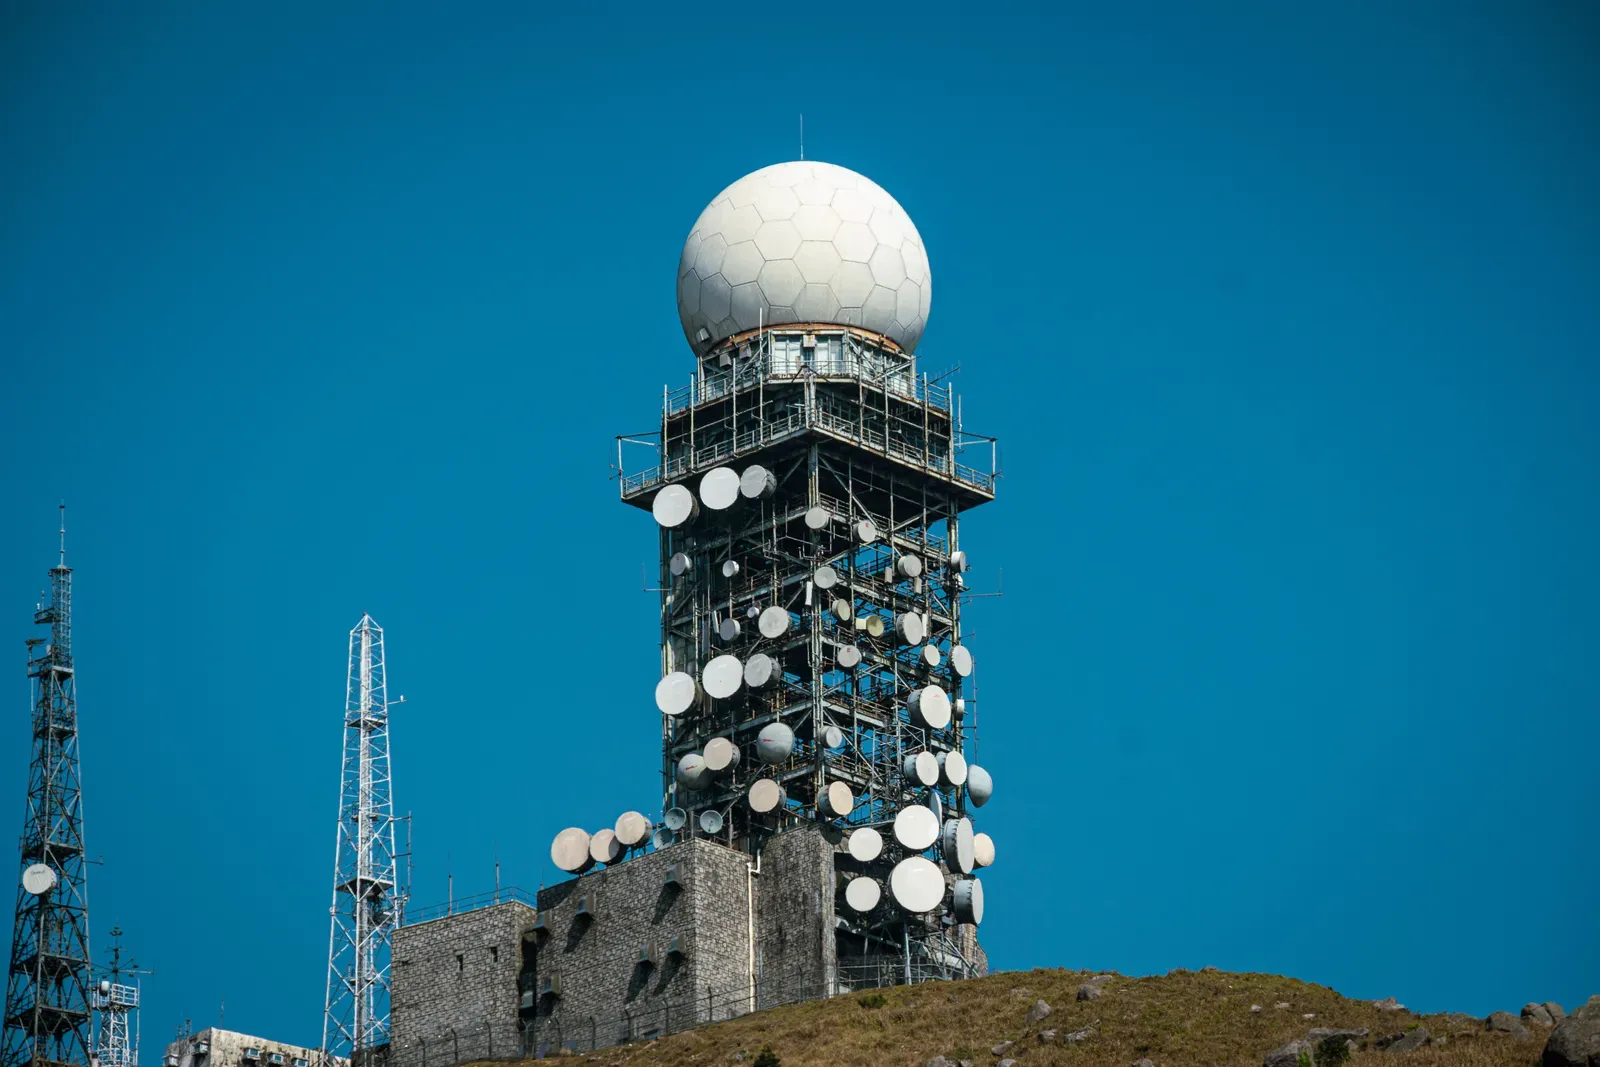
Radar was developed for military use in the 1930s and 1940s. Operators noticed that rain showed up on their screens as clutter, and after World War II, meteorologists started to treat that clutter as data. Rain and storm cells could be tracked in real time, which no surface network could do.
The next big step was Doppler radar, which measures motion toward or away from the antenna. In the United States, the NEXRAD network of Doppler radars was rolled out across the country in the 1990s. Its later dual polarization upgrade helped forecasters distinguish rain, hail and snow, and it made tornado warnings more specific.
Satellites Give the View From Above
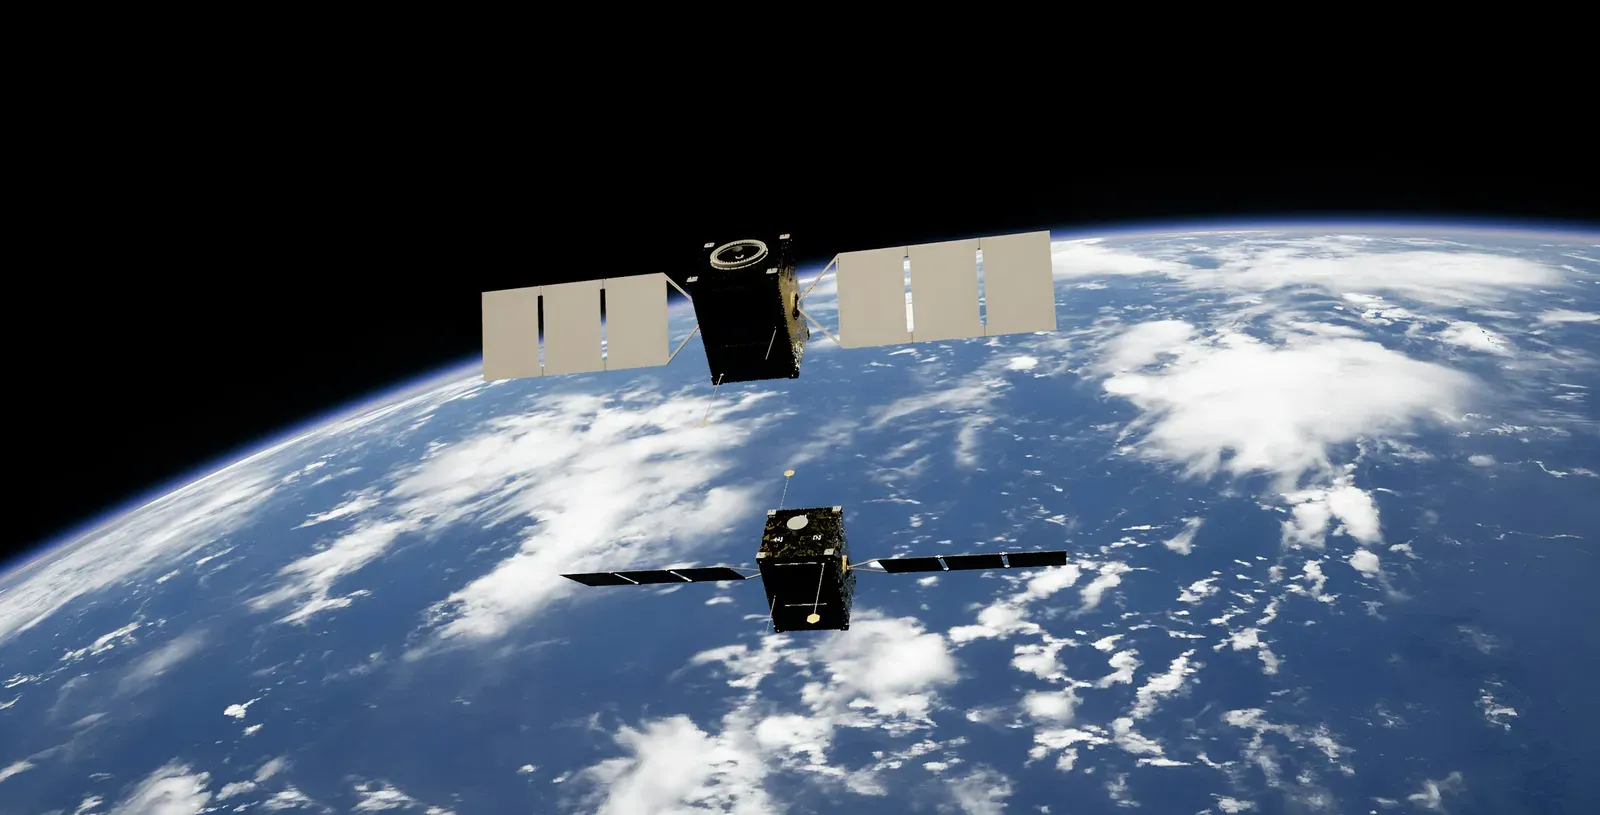
TIROS-1, launched by the United States in April 1960, sent back the first television images of Earth’s cloud cover from orbit. It was a short mission, yet it proved the concept. Before satellites, large parts of the oceans were nearly blank on forecast maps.
Geostationary satellites such as the GOES series now stare at the same hemisphere around the clock, and polar orbiting satellites sweep the whole globe. Their instruments measure temperature and moisture at different heights, not just cloud pictures. Hurricanes that once could slip past unnoticed are now followed from formation onward.
Computers and Numerical Weather Prediction
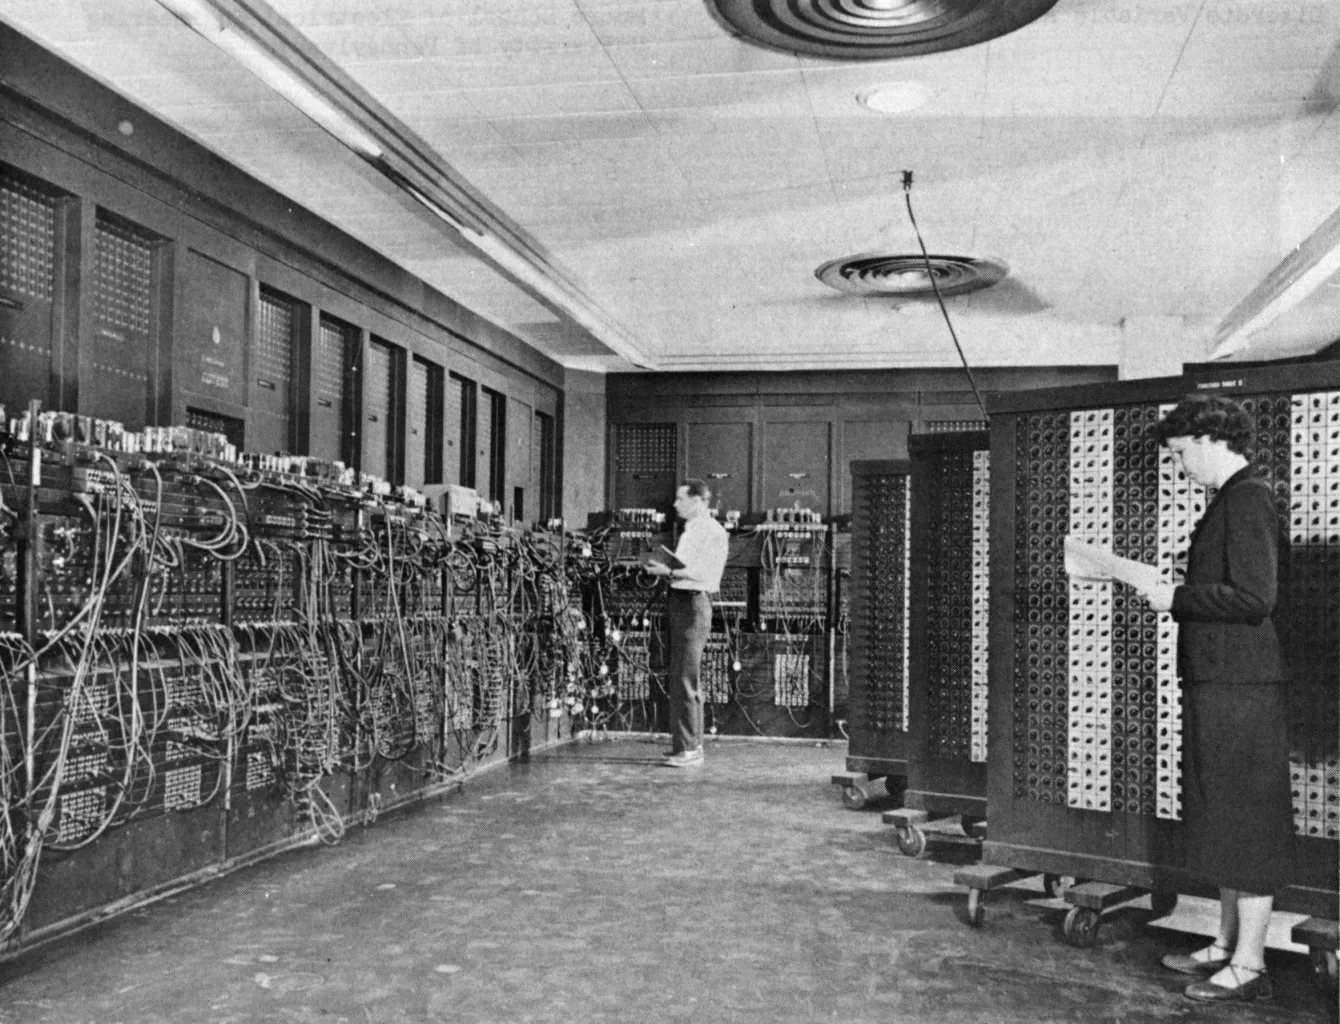
The idea of calculating the weather from physical equations goes back to Lewis Fry Richardson, who attempted it by hand after World War I. His result was wrong and the calculation took far too long. Still, the method was sound. In 1950, a team using the ENIAC computer produced the first successful numerical forecasts.
Over the following decades, faster machines allowed finer grids and more of the atmosphere’s physics. Forecasters also began running ensembles, which are many slightly different runs of the same model that show how uncertain a forecast is. Today’s three to five day forecasts are generally more reliable than next day forecasts were in the mid twentieth century.
Artificial Intelligence Enters Daily Forecasting
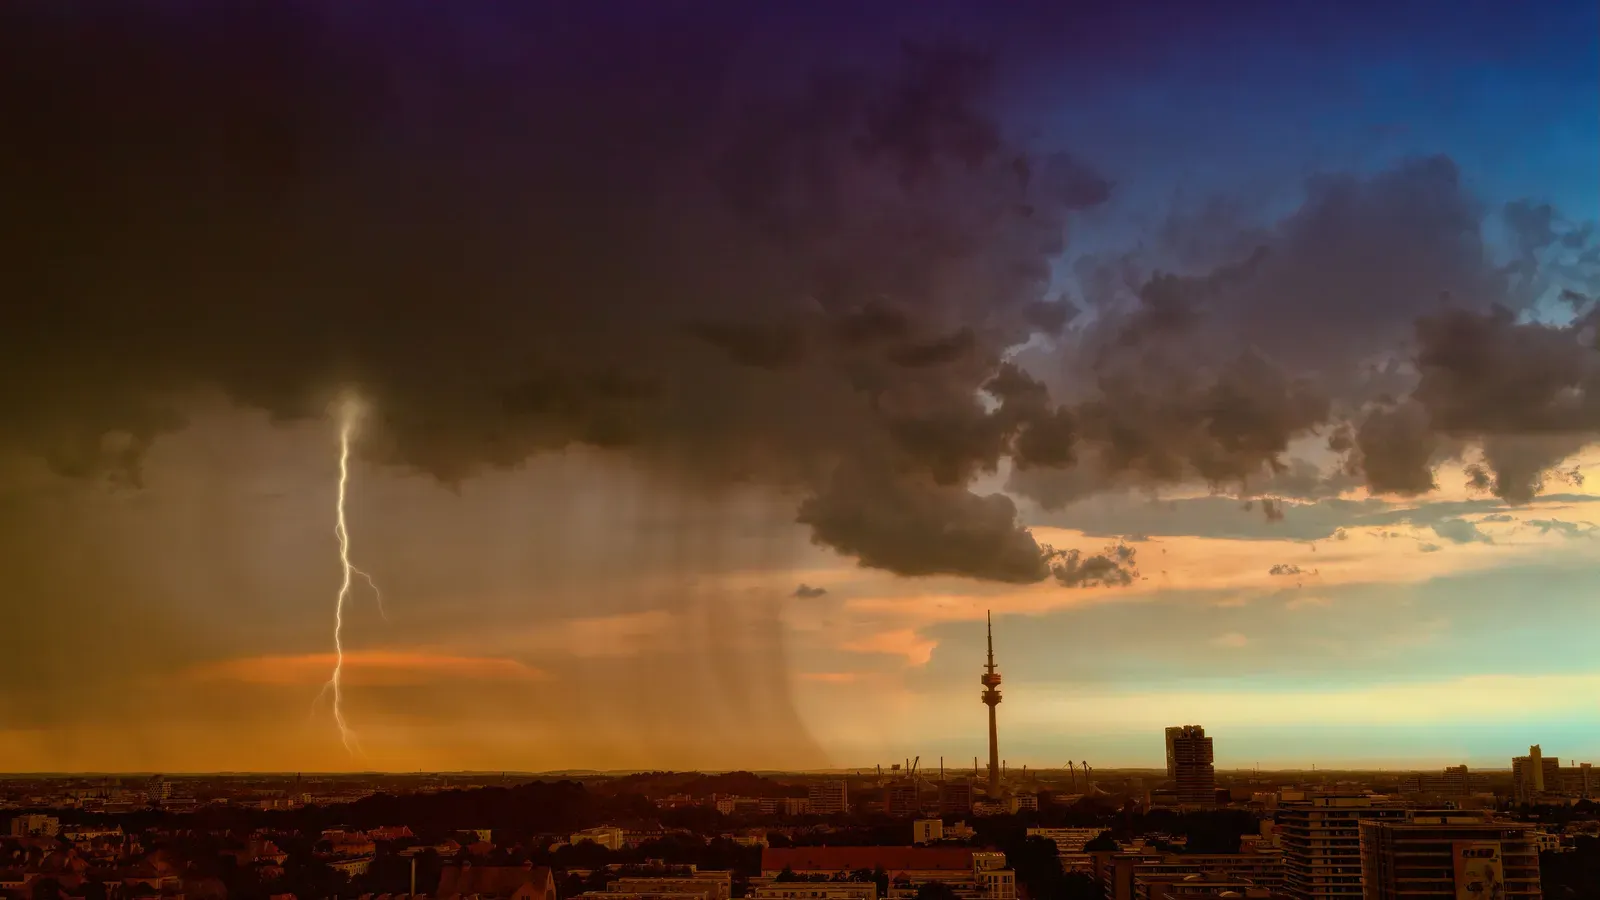
The newest change is machine learning. The European Centre for Medium-Range Weather Forecasts has run its AI forecasting system, AIFS, operationally since 25 February 2025. The probabilistic version followed in July 2025, and NOAA began running its own AI models in January 2026.
These models are trained on decades of past atmospheric data. Many are trained on roughly forty years of ERA5 reanalysis data. They don’t remove the need for physics, though. AIFS still depends on physics based data assimilation to set its starting conditions. Major centers now run AI forecasts alongside their traditional models, not instead of them.
What the Toolkit Looks Like in 2026
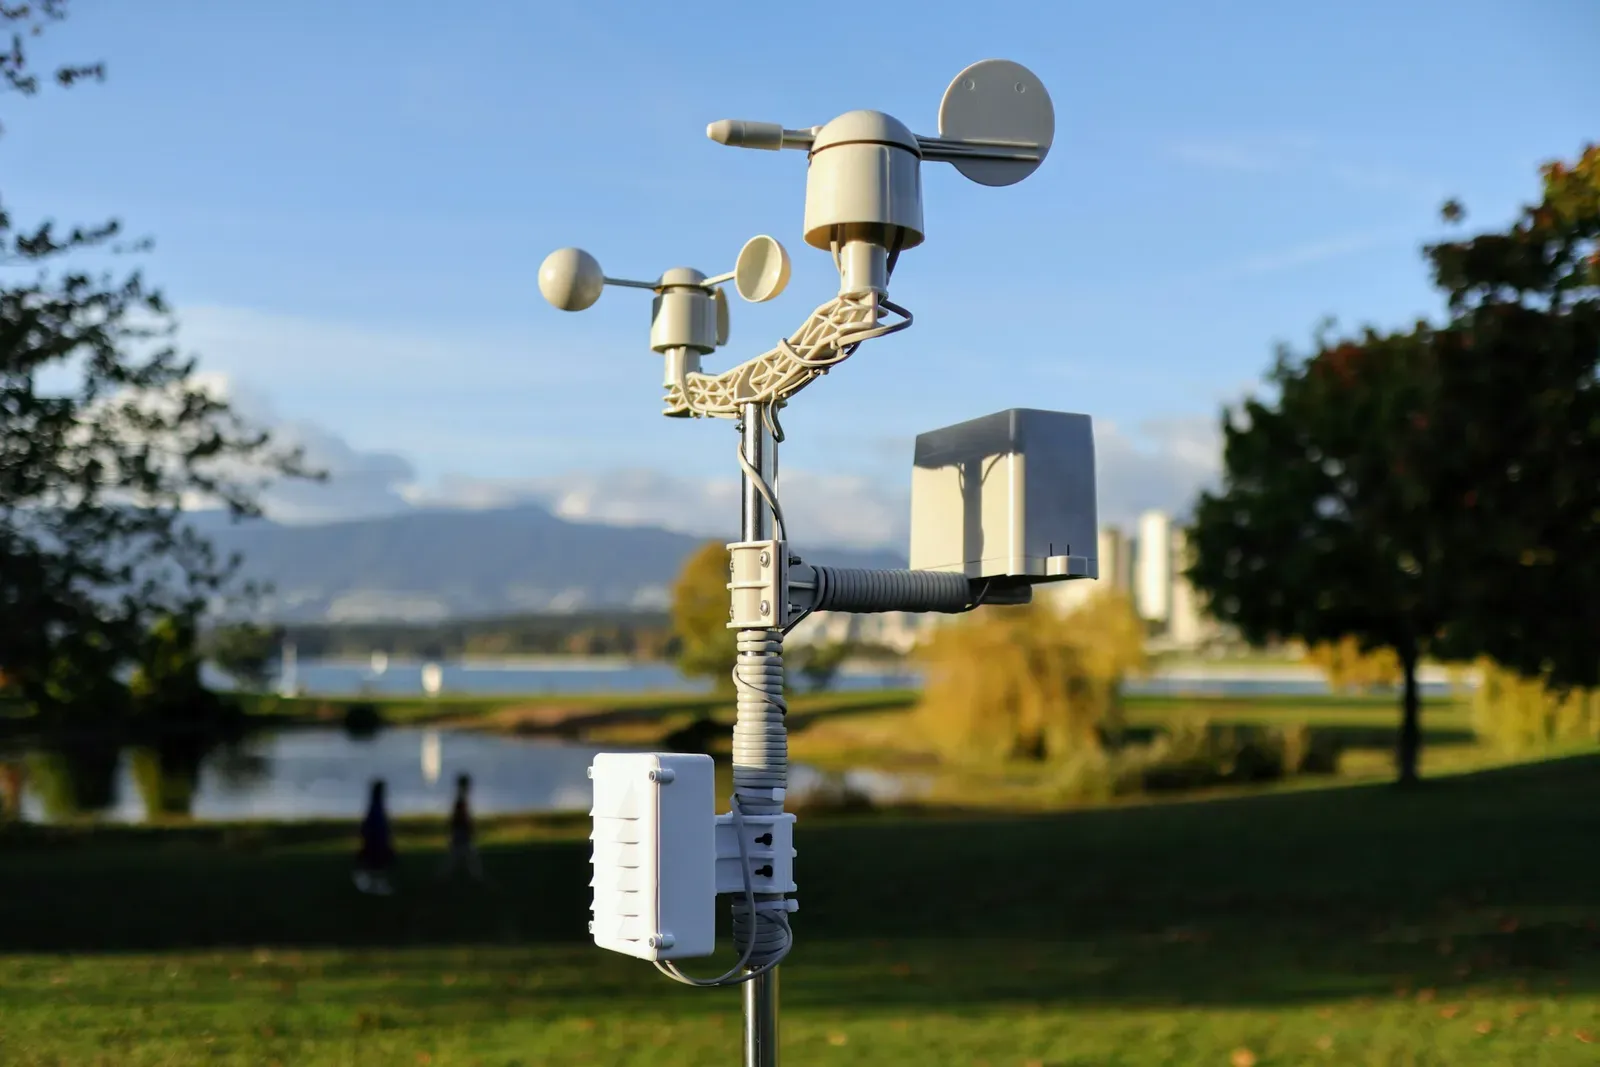
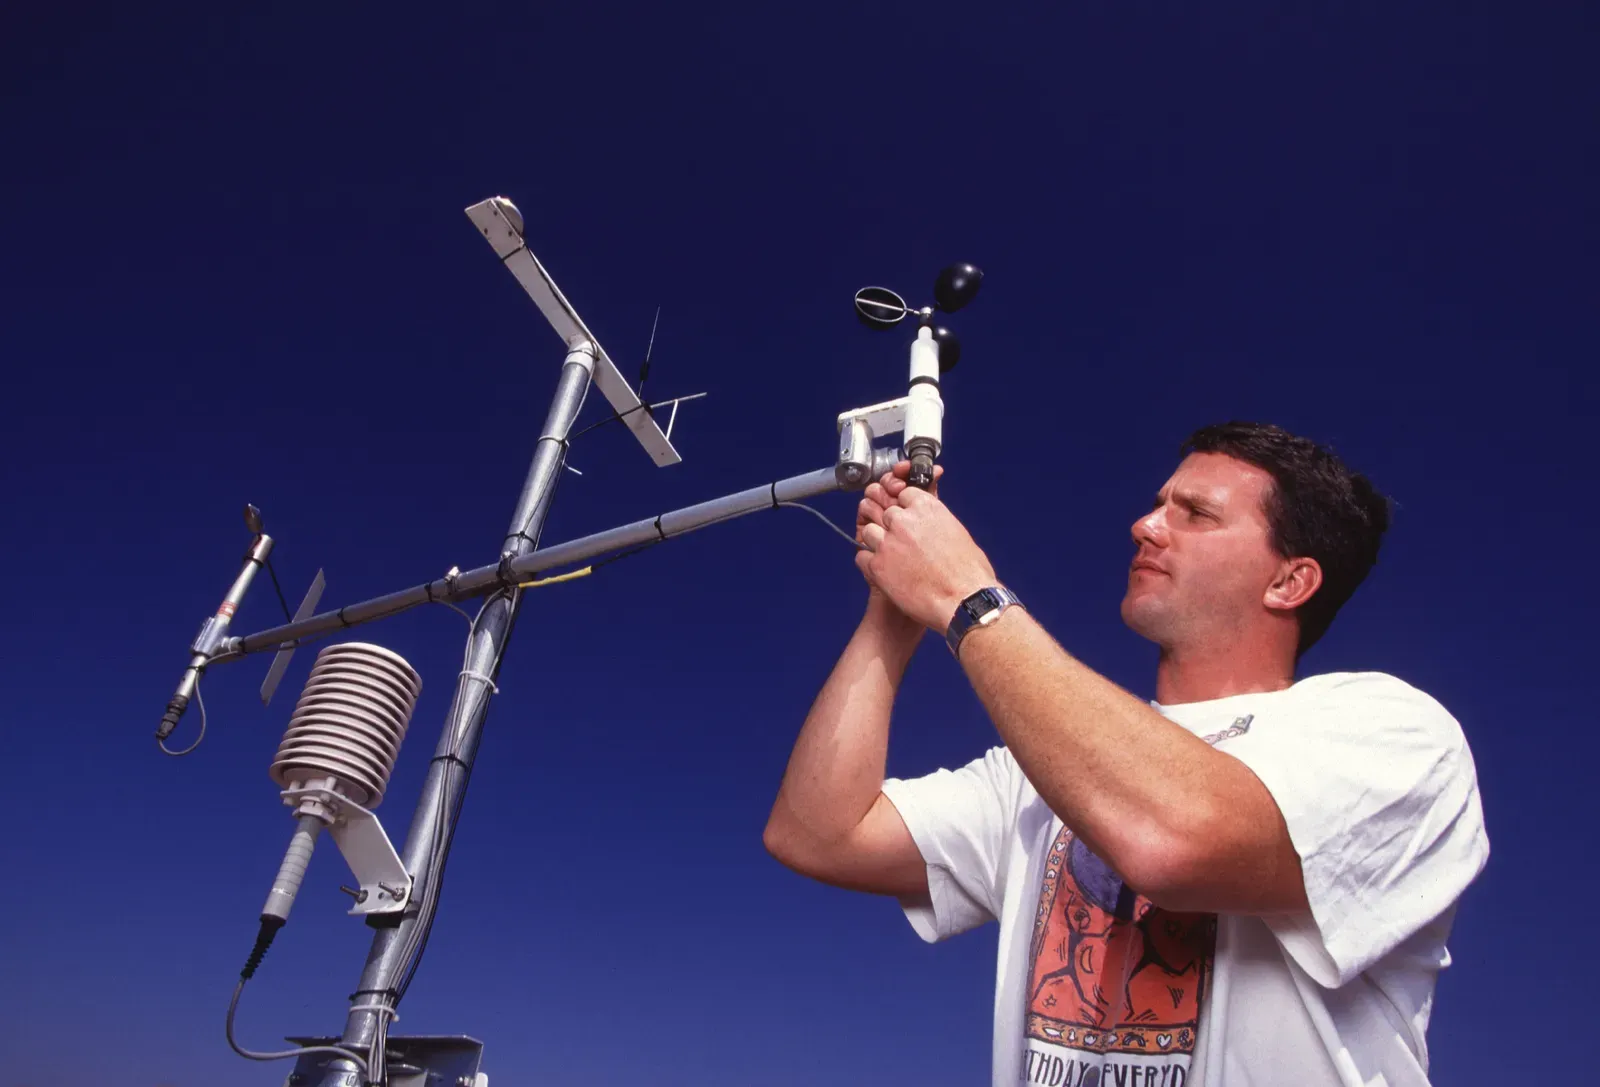
A modern forecast draws on surface stations, radiosondes, Doppler radar, geostationary and polar satellites, aircraft reports and ocean buoys. That data is assimilated into physics based models on supercomputers, and AI models now run beside them at the largest centers. The barometer is still part of the network, though it now sits inside automated stations.
NOAA’s January 2026 launch included AIGFS, an Artificial Intelligence Global Forecast System. NOAA says these models give forecasters faster guidance while using a fraction of the computing resources. Radar and satellite observations remain the raw material that every one of these systems depends on.

- Blue whales vanish from the Galápagos, and scientists suspect El Niño - November 11, 2026
- 8 Famous Battles That Were Decided by the Weather - November 11, 2026
- Black Sunday 1935: 9 Photos From the Worst Dust Storm of the Dust Bowl Era - November 11, 2026
