


- 10 Home Upgrades That Can Lower Summer Cooling Costs - November 10, 2026
- 10 Questions to Ask Before Buying a Home in a Flood Zone - November 10, 2026
- 9 Coffee-Growing Regions Reporting Lower Yields as Temperatures Rise - November 10, 2026
Scientists have long relied on established maps to show where hurricanes pose the greatest threats. Recent years have brought clearer evidence that those traditional boundaries no longer capture the full picture of risk. Warming oceans, changing storm behavior, and improved data are prompting a fresh look at how and where these powerful systems can strike.
Agencies and researchers are updating visualizations and hazard assessments to reflect new realities. The goal is better protection for communities that once felt safely outside the main danger zones. This shift comes from careful analysis of recent seasons and long-term trends rather than speculation.
Changing Storm Tracks and Poleward Shifts
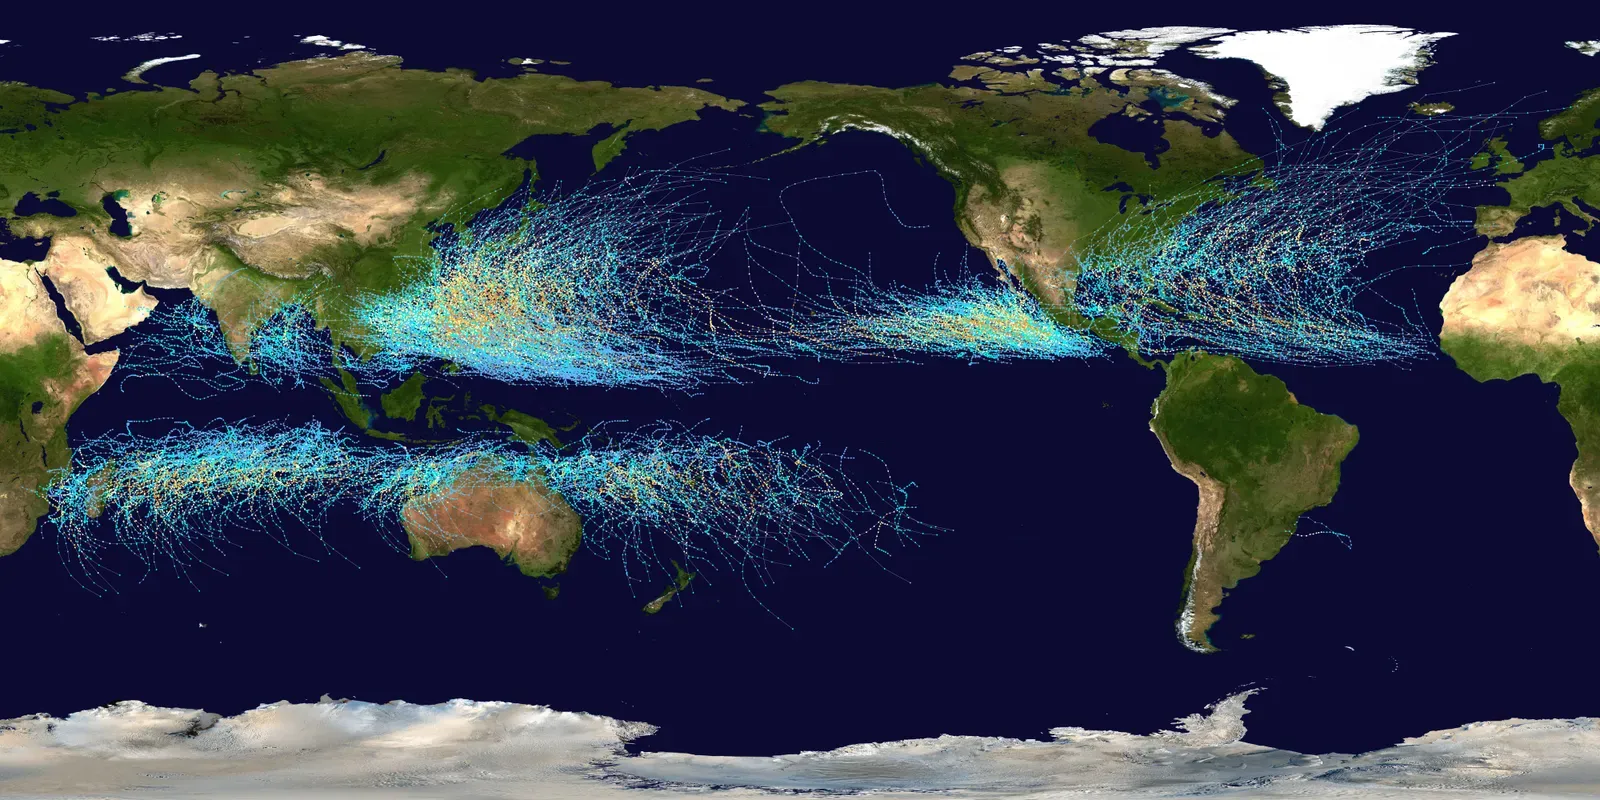
Research tracking tropical cyclones from 1980 onward shows a noticeable redistribution of activity in several basins. In East Asia, landfall likelihood has decreased at lower latitudes while rising farther north. Similar patterns appear in other regions where storms are steering toward previously less affected coastlines.
These track changes mean some areas face rising exposure even as overall storm counts stay steady or decline. Scientists use best-track data to confirm the shifts are real and not artifacts of better detection. Communities in higher latitudes now need updated planning that older maps simply did not anticipate.
Stronger Storms Fueled by Warmer Oceans
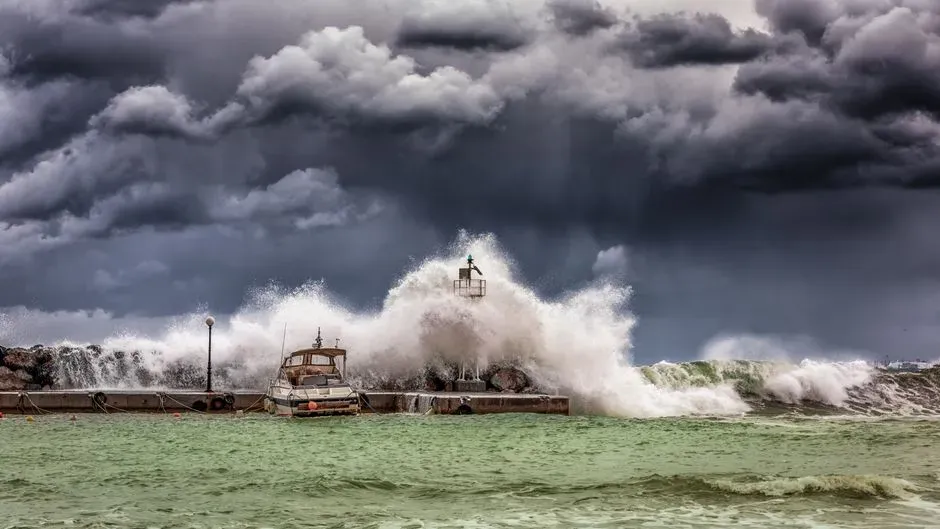
Attribution studies consistently link human-caused ocean warming to higher wind speeds in recent hurricanes. One analysis found climate change added several miles per hour to peak winds in multiple Atlantic storms between 2019 and 2023. The effect is most pronounced in the strongest systems.
Climate models and observations together indicate that the most intense hurricanes are becoming even more powerful. This intensification raises damage potential far beyond what historical averages suggested. Risk maps must therefore account for greater destructive capacity when storms do form.
Expanding Inland Hazard Zones
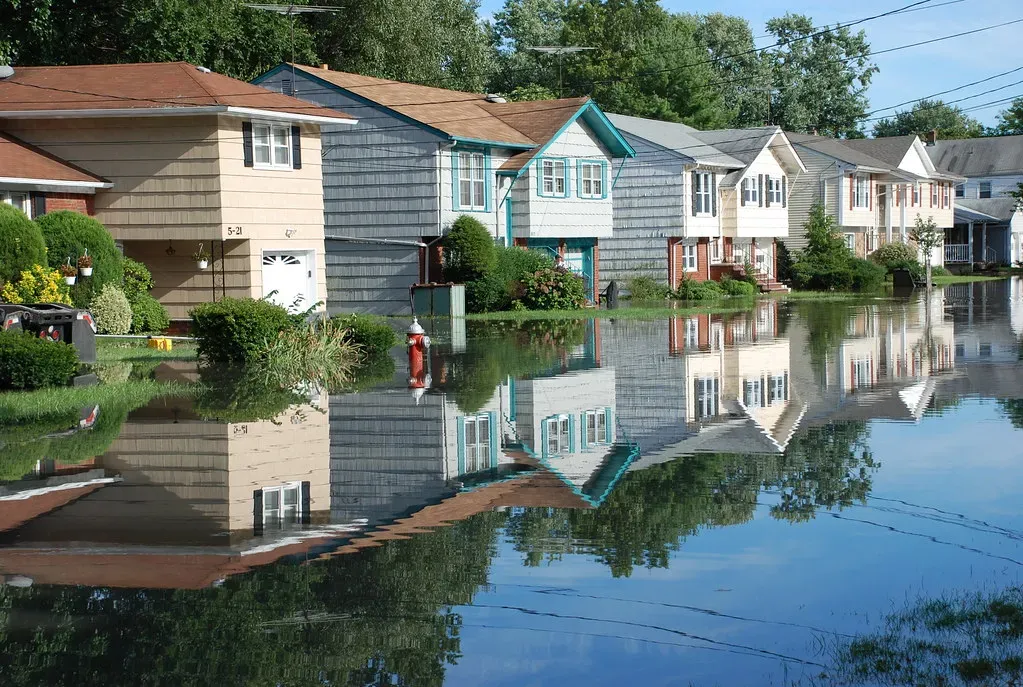
Hurricanes have always produced dangerous conditions well away from the coast through flooding, tornadoes, and strong winds. The National Hurricane Center updated its forecast graphics in 2024 to display inland watches and warnings more clearly. Earlier versions placed too much visual emphasis on coastal areas alone.
Studies of public response show that many people still underestimate inland threats. Revised maps aim to close that gap by highlighting broader impact areas. Emergency managers now work with tools that better reflect how far hurricane effects can reach.
Improved Storm Surge and Flood Modeling
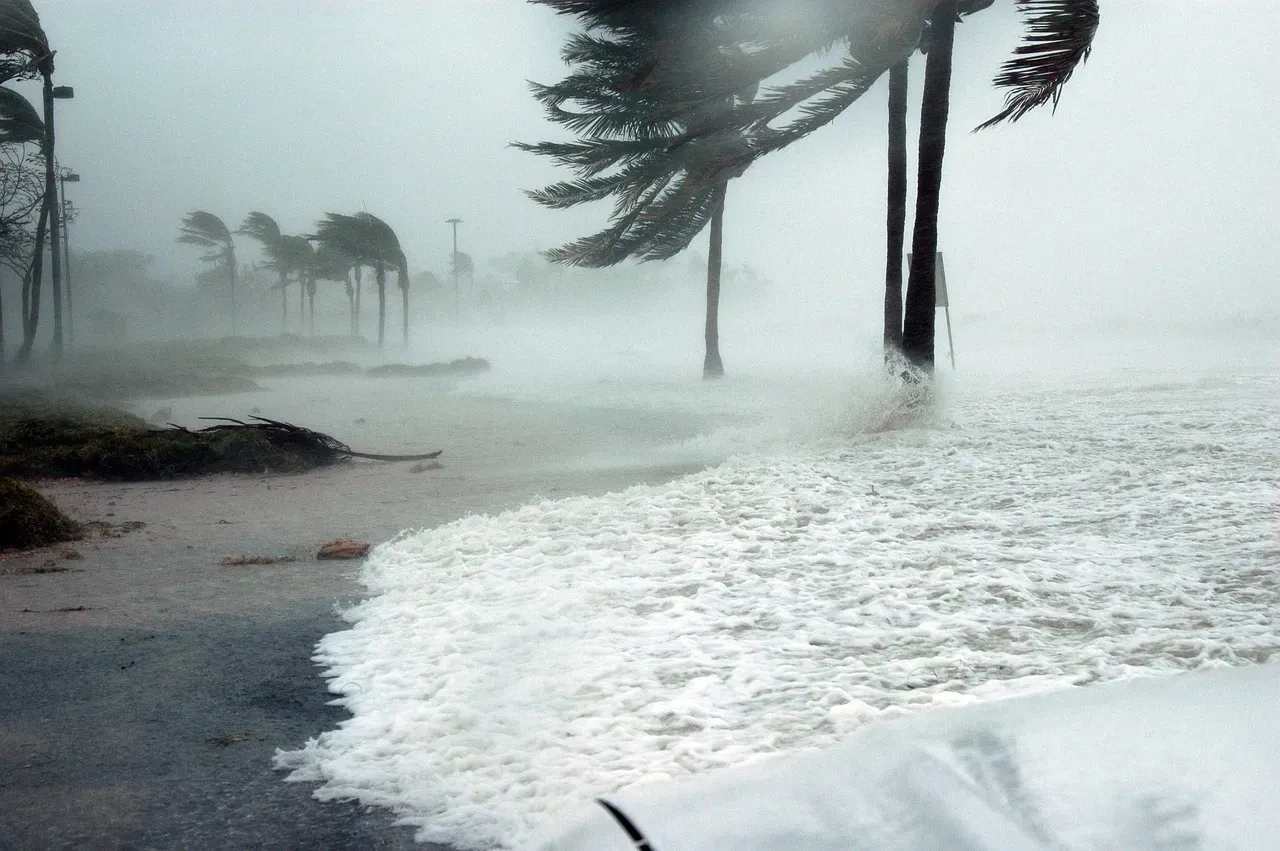
Version 4 of the National Storm Surge Risk Maps, released with updates through 2026, incorporates higher-resolution data and better land-cover friction effects. These refinements change inundation estimates for parts of the Gulf and East coasts. Additional maps now cover more Caribbean islands as well.
FEMA has also revised flood risk assessments in recent years, altering insurance requirements for thousands of properties. More accurate elevation and surge data reveal previously underappreciated vulnerabilities. Homeowners and planners alike benefit from these sharper boundaries.
Advances in Real-Time Attribution Tools
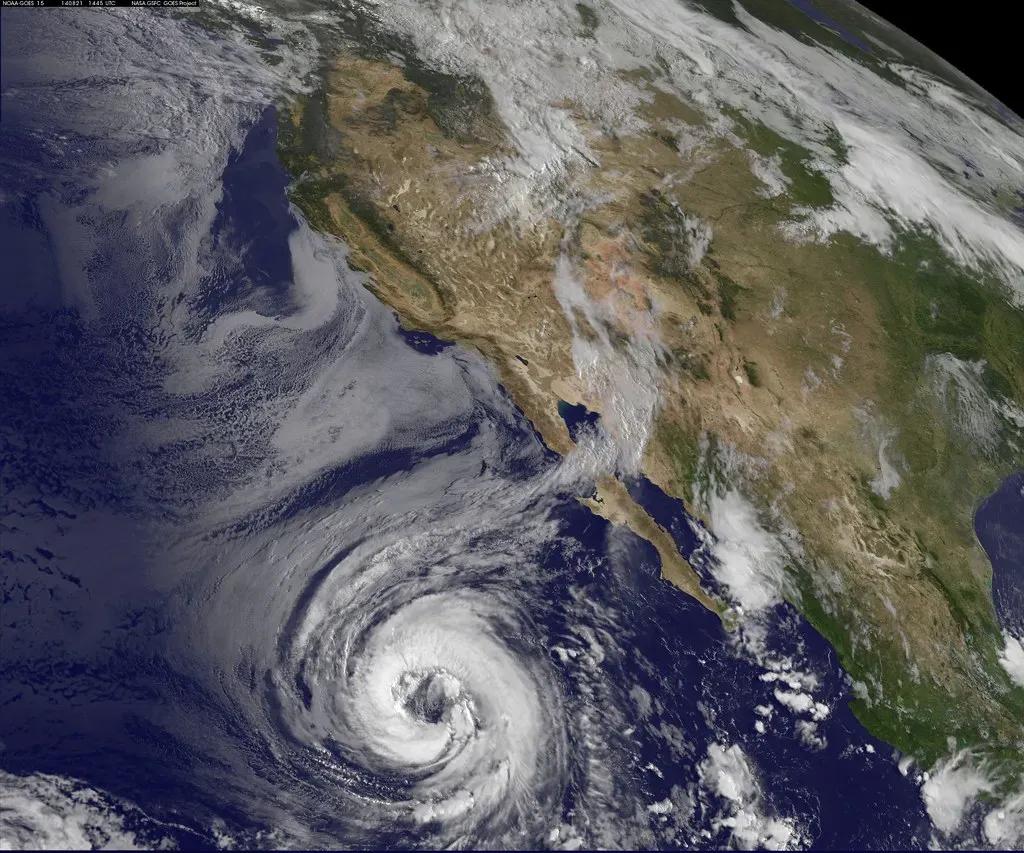
Systems such as the Climate Shift Index for Tropical Cyclones now quantify how much climate change has boosted individual storm intensity. Launched in 2025, the tool draws on ocean temperature data to show added wind speed for each named storm. This information helps refine long-term risk assessments.
Researchers can compare recent events against historical baselines with greater precision. The results support adjustments to maps that previously treated all storms as products of natural variability alone. Such tools keep risk evaluations grounded in the latest evidence.
Regional Differences Emerging in Pacific Basins

In the Pacific, studies indicate climate change has begun to outweigh El Niño as a driver of hurricane potential intensity in some years. One analysis of a recent storm found the human influence larger than the natural cycle. This changes how forecasters weigh seasonal outlooks.
Hawaii faces particular shifts, with models showing stronger storms possible even if total numbers remain uncertain. Track patterns relative to the islands are also evolving. Updated maps help local officials prepare for these altered dynamics.
Communication Graphics Undergoing Redesign
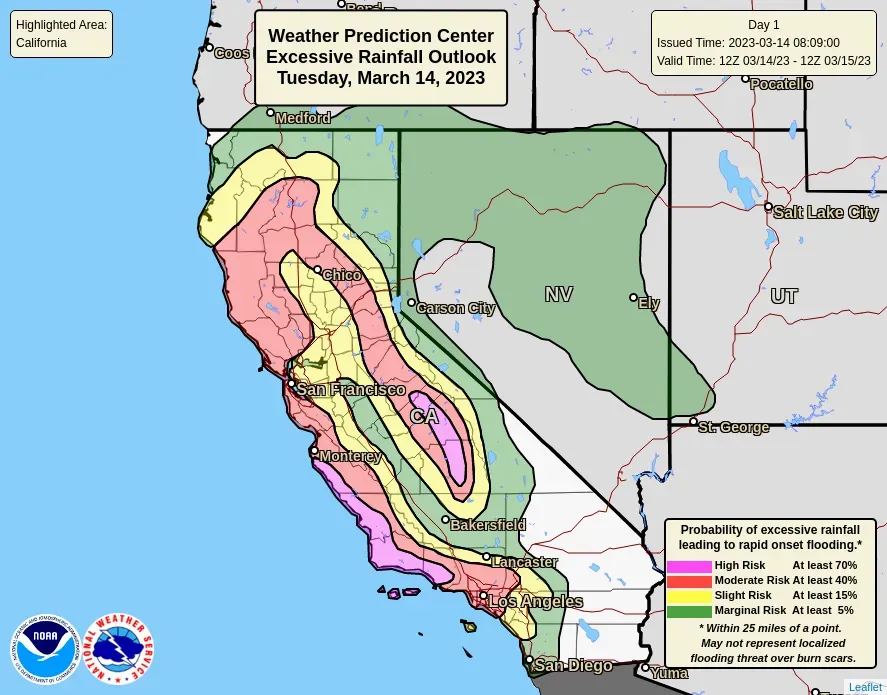
National Weather Service partners have tested redesigned Hurricane Threats and Impacts graphics with meteorologists and emergency managers. Feedback highlights the need for clearer hazard layers and more intuitive layouts. Iterative improvements aim to make complex risks easier to grasp quickly.
Professional users appreciate modern designs that improve accessibility during fast-moving events. Disagreements remain on exact colors and text volume, showing that effective visuals require ongoing refinement. These efforts directly influence how risk maps reach the public.
Implications for Insurance and Long-Term Planning

Redrawn flood and are prompting insurers to adjust rates and coverage in newly identified high-risk zones. Some homeowners face mandatory policies or higher premiums as a result. Accurate maps ultimately support more resilient building codes and land-use decisions.
Communities that update their preparedness based on current science reduce future losses. The process requires balancing new data with practical adaptation steps. Ongoing map revisions will continue as understanding of climate influences deepens.
Conclusion
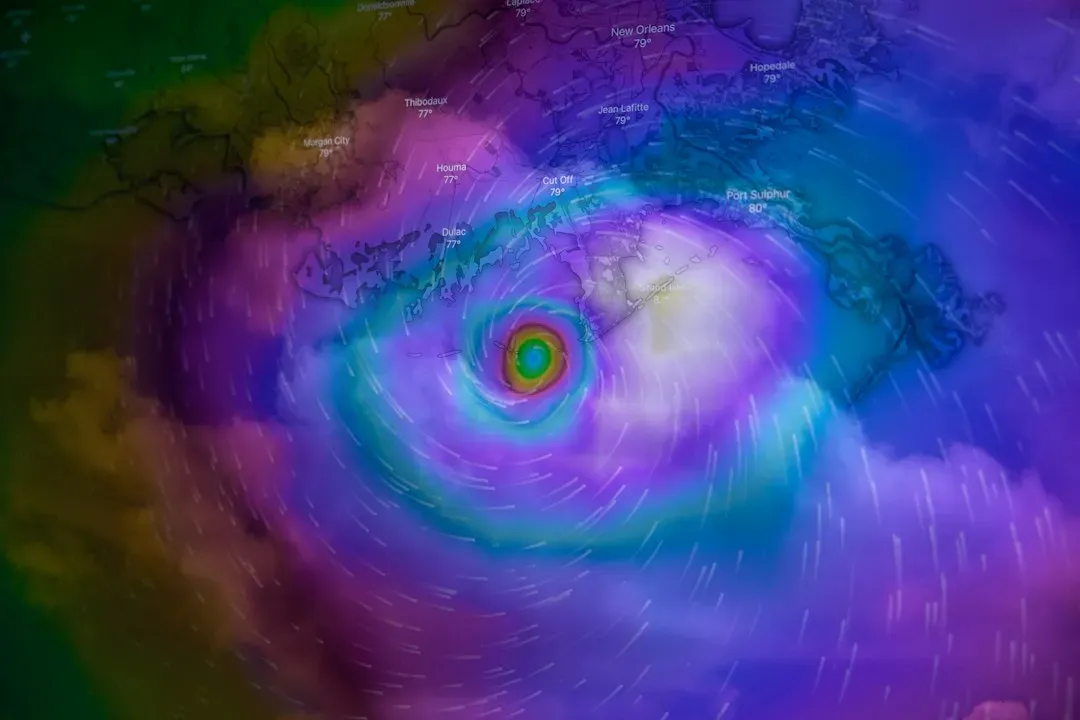
are evolving because the atmosphere itself is changing and our tools for measuring it have improved. These updates help close gaps between perception and reality for millions of people. Staying informed about the latest assessments remains one of the most practical steps anyone in vulnerable regions can take.
