

- The Planet Where It Rains Liquid Glass – 7 Alien Worlds Defying Known Physics - November 14, 2026
- Stars Consuming Entire Worlds – 6 Planetary Systems Swallowing Their Own Worlds - November 14, 2026
- The Ground Liquefies Like Water – 6 Silent Fault Lines Geologists Watch Closely - November 14, 2026
You check one app and it promises sunshine. You open another and it shows rain at the same hour. Neither is necessarily broken, and neither is necessarily lying. They’re usually answering slightly different questions with slightly different tools.
Modern forecasts rest on a shared foundation of observations and physics, yet the steps between raw data and the icon on your phone leave plenty of room for disagreement. Here’s where those differences tend to come from.
Different Computer Models Behind the Scenes
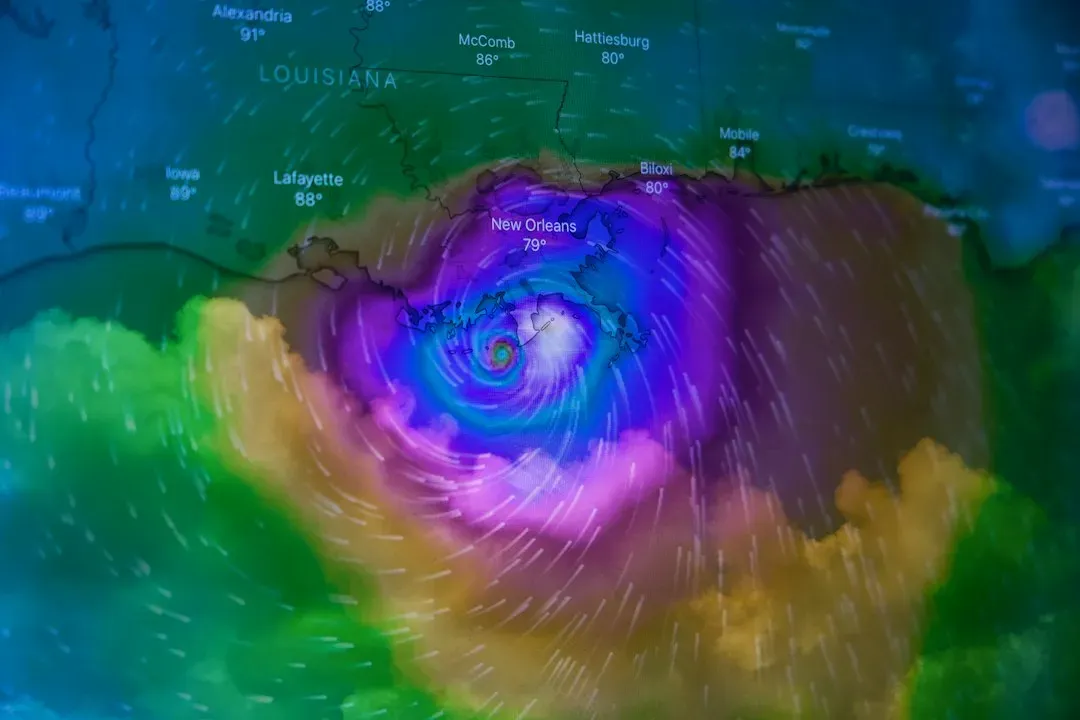
Most forecasts begin with numerical weather prediction, which uses supercomputers to simulate the atmosphere. Several major global models exist, including the American GFS, the European Centre for Medium-Range Weather Forecasts (ECMWF) model, and others run by national agencies in Canada, the UK, Germany and elsewhere. Each uses its own equations, resolution and methods, so they can produce different outcomes for the same day.
An app may lean on one model, blend several, or switch depending on the region. That choice alone can explain why two apps disagree about a storm’s timing. ECMWF has published verification results showing its flagship model has often scored very well in medium-range comparisons, but no single model wins every time or in every place.
Different Starting Points and Data Assimilation
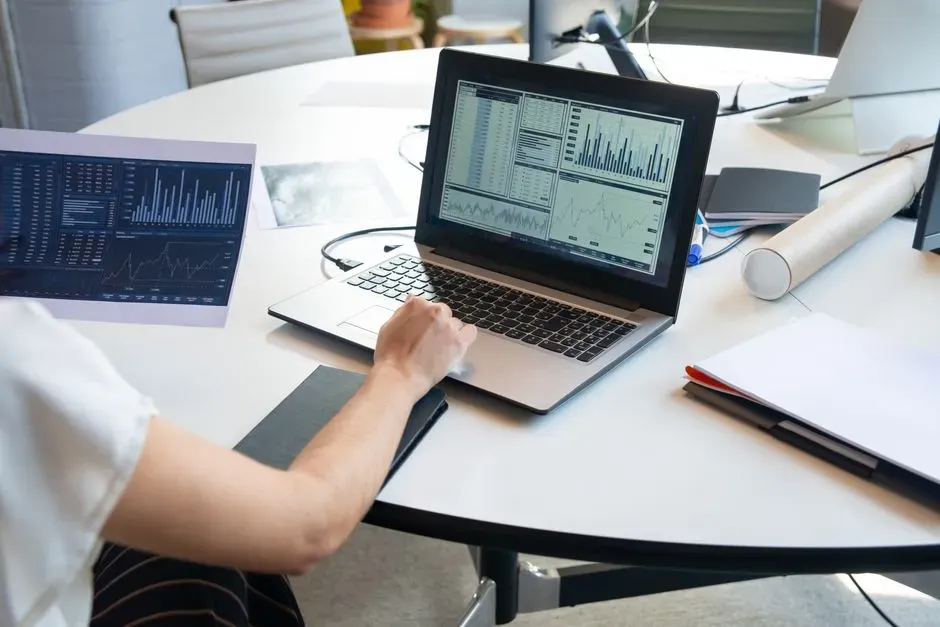
Every model needs a snapshot of today’s atmosphere to start from. That snapshot is built from weather stations, balloons, aircraft, radar, buoys and satellites, then merged through a process called data assimilation. Because centers use different methods and sometimes different observations, their starting snapshots are never identical.
The atmosphere is also chaotic, meaning tiny differences in the starting state can grow into noticeable differences days later. This is why forecasts for tomorrow tend to agree more than forecasts for next week. When apps disagree about day seven, that’s often a sign of real uncertainty rather than an error.
Resolution and Local Terrain

Models divide the world into grid boxes, and each box gets a single value for things like temperature and wind. Global models often use grid spacing of roughly ten to twenty-five kilometers, while regional models can be much finer. A city with hills, a coastline or a big lake can have very different conditions across a single grid box.
If one app uses a higher resolution model, it may catch a sea breeze or a valley fog that another smooths out. Still, finer resolution isn’t automatically better, since small features can be misplaced. That’s one reason local forecasters often adjust model output by hand.
Which Location the App Is Actually Using
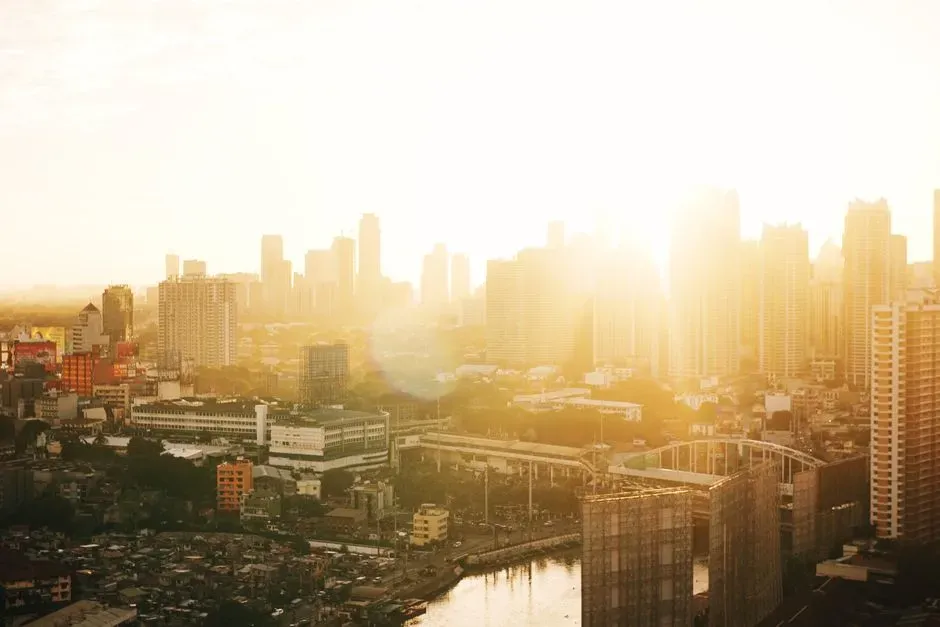
“The same city” can mean different spots. One app may pull from the nearest airport weather station, another from a grid point at the city center, and a third from your phone’s GPS. Airports are often on the outskirts and can run several degrees different from dense downtown areas, partly because of the urban heat island effect.
Reported current conditions can differ for the same reason. Some apps show an official station reading, while others show a modeled estimate or data from nearby personal stations. That can make “feels like right now” disagree before any forecasting even enters the picture.
How Rain Chances Are Defined and Displayed
Precipitation probability is one of the most misunderstood numbers. In the United States, the National Weather Service defines probability of precipitation as the chance that measurable rain will fall at any given point in the forecast area during the period. It combines both confidence that rain will occur and how much of the area it will cover.
Other apps may present their own versions, such as the chance of rain in the next hour or the share of model runs showing rain. A “40 percent” on one app may not mean the same thing as “40 percent” on another. Icons add another layer, because each app decides what threshold of probability turns a sun into a cloud with raindrops.
Government Data Versus Commercial Processing
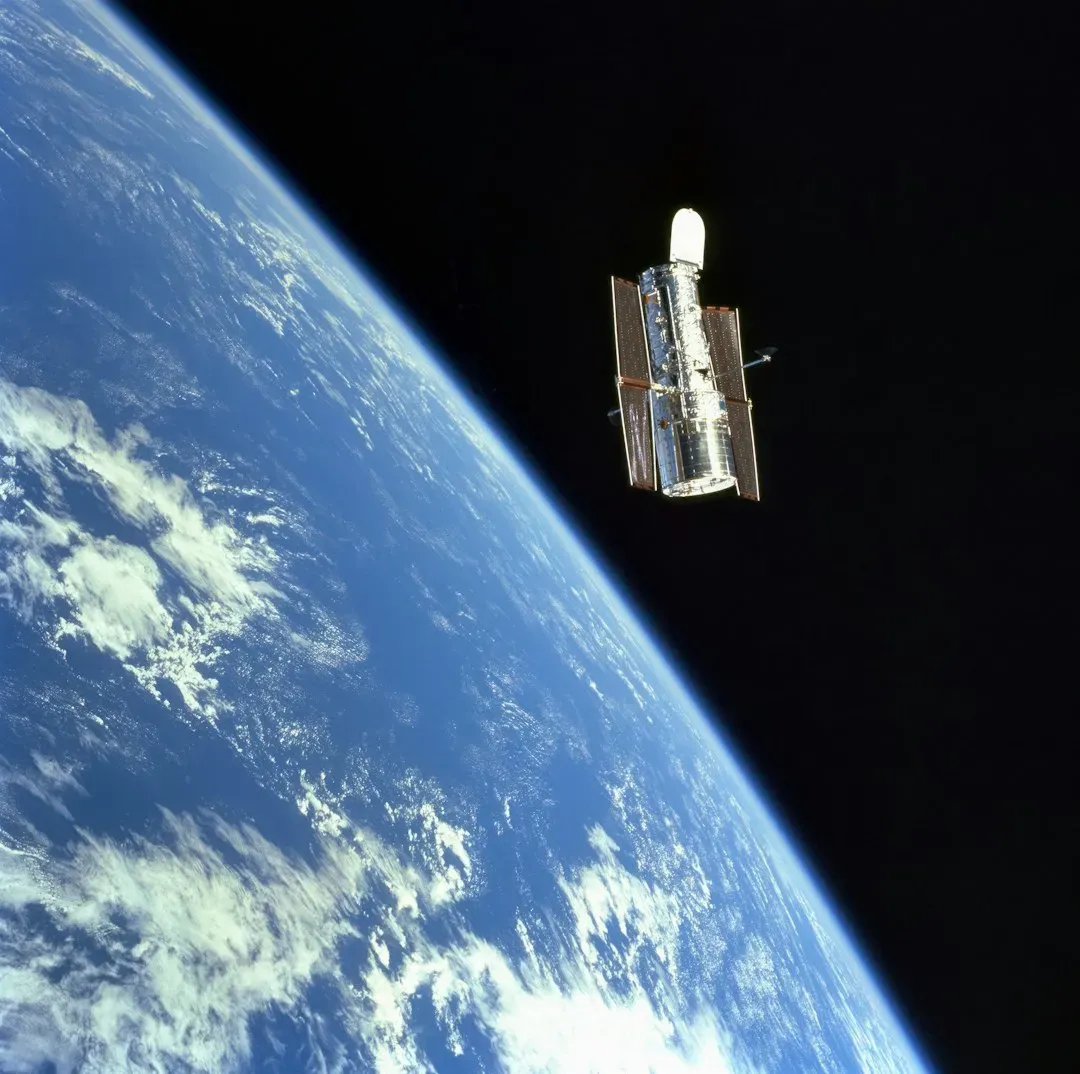
Many popular apps rely heavily on public data from agencies like the National Weather Service or the UK Met Office. Others add proprietary processing, machine learning or their own blends of models. Some companies also correct model output using local observations, a technique known as statistical post-processing.
The result is that two apps can start from similar public information and still end up in different places. Post-processing generally improves accuracy on average, but it can also introduce its own quirks. The methods are rarely published in detail, so it’s hard for users to know exactly what they’re getting.
Update Timing and Nowcasting
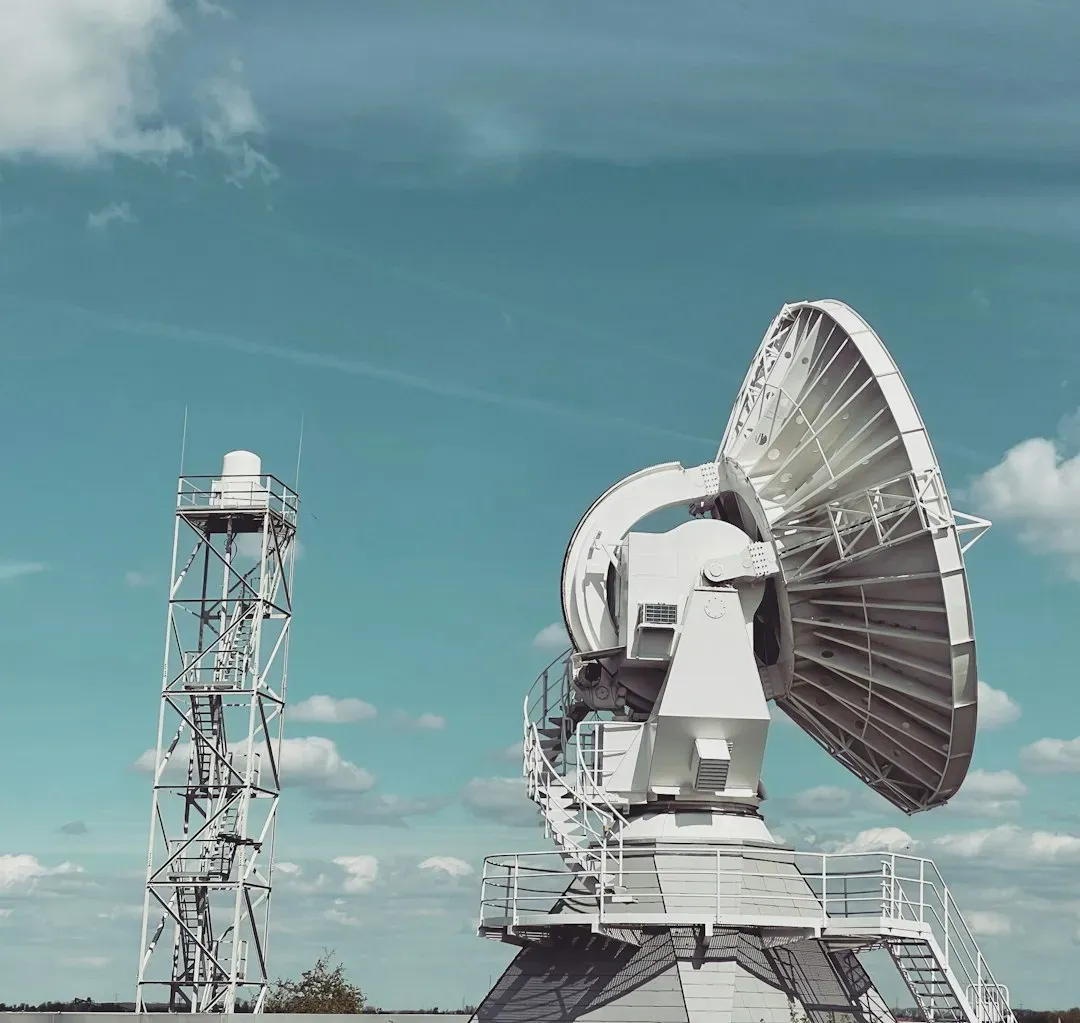
Major global models typically run a few times a day, and apps refresh on their own schedules. If one app updated an hour ago and another updated this morning, they may show different forecasts simply because newer data arrived. This matters most when fast-changing weather like thunderstorms is near.
For the next hour or two, many apps switch to nowcasting, which extrapolates radar and satellite imagery. These short-term minute-by-minute alerts can be useful, but they struggle with storms that form or fade quickly. Differences between apps are often largest in exactly these situations.
AI Forecasting Adds a New Variable
Machine learning weather models have advanced quickly in recent years. Google DeepMind’s GraphCast, published in Science in 2023, showed that an AI system trained on decades of historical data could rival leading traditional models on many global measures. ECMWF has also operated its own AI forecasting system, adding to a landscape where traditional and AI-based approaches now coexist.
As more apps and agencies adopt these tools, the sources behind your forecast may become even more varied. Early evidence is promising, though researchers still study how well AI handles extreme events and rare conditions. For now, it’s one more reason the numbers on your screen can differ.
How to Get More Reliable Answers
A practical habit is to check your national weather service alongside a favorite app, especially when the stakes are high. If both agree, confidence is reasonable. If they differ, treat the situation as uncertain and plan for either outcome.
Also look at the hourly details and the forecast discussion, if your local agency publishes one, since forecasters often explain how sure they are. Remember that forecasts get less certain the further out they go. Disagreement between apps isn’t a flaw in meteorology, it’s a visible reflection of a complicated atmosphere being described in slightly different ways.
